Determination of Range of Quadriceps Angle by Computed Tomography
Valida Rolin Mendonsa1, Winniecia Dkhar2, Suresh Sukumar3, Arathy Mary John4
1 Student, Department of Medical Imaging Technology, School of Allied Health Sciences, Manipal Academy of Higher Education, Manipal, Karnataka, India.
2 Assistant Professor, Department of Medical Imaging Technology, School of Allied Health Sciences, Manipal Academy of Higher Education, Manipal, Karnataka, India.
3 Associate Professor, Department of Medical Imaging Technology, School of Allied Health Sciences, Manipal Academy of Higher Education, Manipal, Karnataka, India.
4 Assistant Professor, Department of Medical Imaging Technology, School of Allied Health Sciences, Manipal Academy of Higher Education, Manipal, Karnataka, India.
NAME, ADDRESS, E-MAIL ID OF THE CORRESPONDING AUTHOR: Dr. Suresh Sukumar, Associate Professor, Department of Medical Imaging Technology, School of Allied Health Sciences, Manipal Academy of Higher Education, Manipal, Karnataka, India.
E-mail: suresh.sugumar@manipal.edu
Introduction
The Quadriceps angle (Q angle) has come to be accepted as an important factor in assessing knee joint function. Various conditions can affect the Q angle such as increased pelvic width, sociological factors, wearing high heels and certain sports postures such as an increase in pronation can lead to increase in Q angle. Therefore, measurement of Q angle is important in the field of Orthopaedics and sports medicine.
Aim
To determine the range of Q angle in right and left lower limbs and among genders and the association of Q angle with Tibial Tuberosity–Trochlear Groove (TT-TG) distance, lateralization of pelvis femur length, weight, height, body mass index and waist to hip ratio.
Materials and Methods
A total of 70 subjects were selected from patients who have undergone lower limb angiography in Computed Tomography (CT). The sample size was then categorised into 35 males and 35 females. Both legs of the subject were kept extended and in relaxed position. The images were then reconstructed into volume rendering (3D) and the Q angle, femur length and lateralization of pelvis were measured on volume rendering and TT-TG distance was measured on 2-dimensional axial images. The data were statistically analysed using descriptive statistics where mean, standard deviation, and range was used to report the data. ‘Multiple Logistic Regression’ test was used to analyse the association of Q angle with various factors.
Results
The mean Q angle in right leg was 11.76±4° and in left leg was14.76±6.45°. The mean of Q angle in right leg of male was 10.4±3.62°, and in females, it was 13.11±4.25° whereas the mean of Q angle in left leg of male was 12.17±4.59° and in females, it was 17.34±7.05°. The association of Q angle with TT-TG distance, lateralization of pelvis femur length, weight, height, body mass index and waist to hip ratio showed no significant association.
Conclusion
The range of the Q angle varies in both legs among gender. Though there was no significant association between Q angle and femur length, the major factor contributing to the varying Q angle was femur length compared to other parameters. Therefore, Q angle increases with increases in femur length and the left Q angle is more than that of right Q angle.
Hip ratio, Three dimensional imaging, Tibial tuberosity, Trochlear groove
Introduction
The knee joint is a complex synovial joint of the condylar variety that is stabilised by ligaments and muscles. It is involved in around 50% of musculoskeletal injuries [1]. The Q angle has come to be accepted as an important factor in assessing knee joint function [2]. The relative positions of the tibial tuberosity and the centre of patella are crucially important to determine the Q angle. The Q angle is an important parameter to assess patella-femoral mechanics and thus it is of great interest for clinicians. Q angle is the angle obtained by line drawn from anterior superior iliac spine to the centre of the patella and another line drawn from centre of the patella to the tibial tuberosity [3]. Increase in Q angle will be responsible for patellofemoral disorders such as patellar instability, patellar femoral pain syndrome, and subluxation associated with trochlear dysplasia, isolated patella-femoral arthritis, genu valgus, femoral anteversion, external tibial torsion which leads to surgical procedures such as patellar realignment [4]. Various conditions can affect the Q angle such as an increased pelvic width, sociological factors, wearing high heels and certain sports postures such as increase in pronation can lead to increase in Q angle [5]. Therefore, measurement of Q angle is important in the field of Orthopaedics and sports medicine. There are studies which were conducted for the validity of Q angle and their measurement, the common method to measure the Q angle is goniometer but study results are inaccurate and are not reliable, so the most accurate and reliable measurements are done through invasive methods such as radiography and CT scan. Several patello-femoral abnormalities measurements are done through radiological methods such as congruence angle, lateral patella-femoral angle, TT–TG distance and other indexes [5].
With the advancements of new technology in computed tomography such as volume rendering, faster scan times and less dose to patients it has become the robust method to do the measurement using measurement tools in CT. The quadriceps femoris angle (Q-angle) is an important indicator of biomechanical function in the lower extremities. It is a quantitative measurement of patella position in respect to the lower extremity alignment [6]. In the present study authors describe a reliable method used to calculate the Q angle and the factors that influence it. Apart from serving as a baseline data for sexual dimorphism in forensic significance, it also becomes a guideline for designing prosthesis for the knee replacement surgeries. The aim of this study was to determine the range of Q angle in right and left lower limbs and among genders, the association of Q angle with TT–TG distance and lateralization of pelvis femur length, weight, height, body mass index and waist to hip ratio.
Materials and Methods
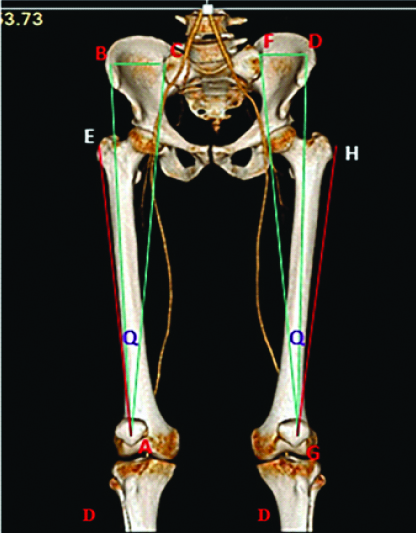
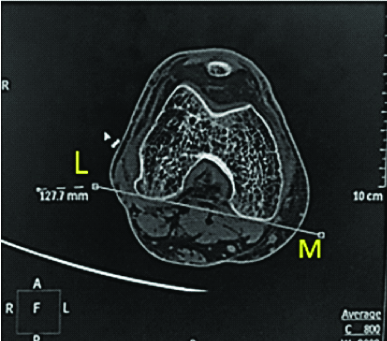
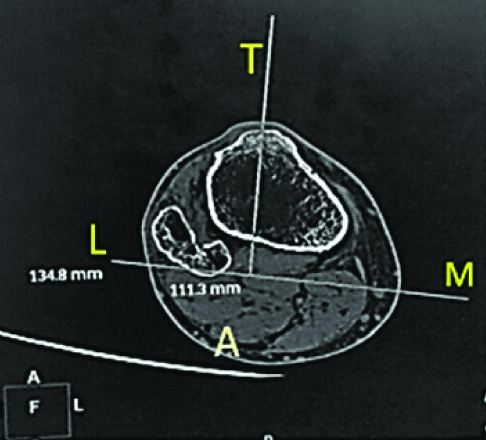
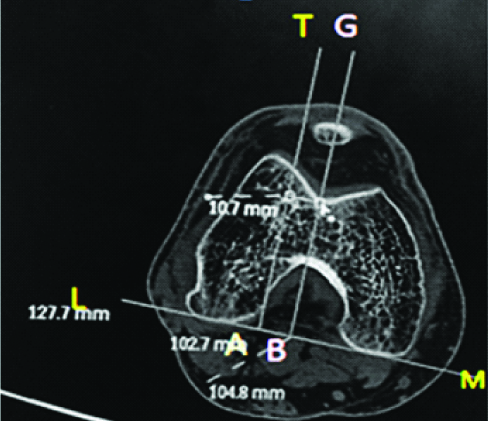
A cross-sectional study was conducted from November 2016- June 2017 in Department of Radiodiagnosis and imaging, Kasturba Hospital, Manipal, India and the EC were received from Kasturba Hospital Ethical Committee, Manipal, Karnataka, India. The patients were referred for CT scan of lower limb on Philips 64 slice CT. Sample size calculation was done using comparison of mean formula. The total 70 subjects (35 males and 35 females) were selected but subjects with the history or radiographic evidence of osteoarthritis trauma and knee replacement surgery were excluded from the study. Inform consent was taken from the patient before the procedure. Both the legs of the subject were kept extended and in a relaxed position. Further, lower limb CT scan of the subject was obtained using standard protocol with kVp=200, mAs=120 and filter=sharp C. The source axial lower limb images were then reconstructed into thinner slice of slice thickness 1/0.5 mm. The reconstructed images was reformatted into volume rendering (3D) and following parameters were measured for both extremities that are Q angle as part of a triangle with the hypotenuse formed by a line connecting the Anterior Superior Iliac Spine (ASIS) with the centre of the patella. The base formed by a line extending from the ASIS and perpendicular to the vertical line extended from the centre of the patella (BC). The angle formed by line connecting the ASIS with the centre of the patella and base formed by a line extending from the anterior superior iliac spine (Q). The femur length measured from greater trochanter to intercondylar fossa (EA) [Table/Fig-1]. TT-TG distance is taken as follows, first a line tangent to the posterior epicondyle (LM) [Table/Fig-2] then another line drawn parallel through the most anterior portion of the tibia tuberosity (TA) [Table/Fig-3], Line drawn perpendicular to the deepest trochlear groove (GB) and TT-TG distance was measured (AB) [Table/Fig-4].
A 3D CT of lower limb (A & G -Centre of patella, B& D - Anterior superior iliac spine, C& F –Sacroiliac joint, E & H – Greater trochanter, I- Tibial tuberosity)
Line tangent to the posterior epicondyle (LM). (Left)
Line drawn parallel through the most anterior portion of the tibia. (Right)
Line drawn perpendicular to the deepest trochlear groove (GB) & TT-TG distance measurement (AB).
Statistical Analysis
The data were statistically analysed utilising Social Package of Statistical Science software (SPSS, version 20.0). Mean, standard deviation, with error bars was used to determine the range of Q angle in right and left lower limbs and among genders. ‘Multiple Logistic Regression’ test was used to analyse association of Q angle with TT–TG distance, lateralization of pelvis femur length, weight, height, body mass index and waist to hip ratio.
Results
Statistical analysis of Q angle in right and left leg irrespective of gender is given in [Table/Fig-5]. The Q angle in right leg is varying from 8° to 24° with mean of 11.76±4°, whereas range of Q angle in left leg is varying from 8° to 32° with mean of 14.76±6.45°. Data analysis was done among gender and the value of Q angle among male subjects is given in [Table/Fig-6] and among females is given in [Table/Fig-7]. The association of Q angle with TT–TG distance, lateralization of pelvis femur length, weight, height, body mass index and waist to hip ratio was statistically analysed using multiple regression model, and it shows that there was no significant association between TT–TG distance, lateralization of pelvis femur length, weight, height, body mass index and waist to hip ratio. And also, authors found that compared to males Q angle among females in right leg is expected to increase by 2.9217 degree (95% Confidence Interval of 1.1457, 4.6976). When compared to males Q angle among females in left leg was expected to increase by 5.4996 degree (95% Confidence Interval of 2.6925, 8.3068).
Statistical significance to find the range and mean of Q angle in right and left leg in both genders.
| Varibles | Q angle (Right) | Q angle (Left) |
|---|
| Mean | 11.76 | 14.76 |
| Std. Deviation | 4.005 | 6.457 |
| Minimum | 8 | 8 |
| Maximum | 24 | 32 |
Statistical significance to find the range and mean of Q angle of males in right and left leg.
| Varibles | Q angle (Right) | Q angle(Left) |
|---|
| Mean | 10.40 | 12.17 |
| Std. Deviation | 3.265 | 4.592 |
| Minimum | 8 | 8 |
| Maximum | 21 | 24 |
Statistical significance to find the range and mean of Q angle of females in right and left leg.
| Varibles | Q angle (Right) | Q angle (Left) |
|---|
| Mean | 13.11 | 17.34 |
| Std. Deviation | 4.255 | 7.054 |
| Minimum | 8 | 8 |
| Maximum | 24 | 32 |
Discussion
This study was conducted to determine the range of Q angle in right and left lower limbs and also among genders with computed tomography and to find the association of Q angle with TT–TG distance, lateralization of pelvis femur length, weight, height, body mass index and waist to hip ratio. While most of the studies conducted measured Q angle with goniometer [7-8], authors measured the Q angle virtually by using 3-dimensional computed tomography. Computed tomography volume rendering gives an accurate measurement which will provide accurate range of Q angle to surgeons which will aid them towards better planning in patella-femoral surgeries and these data will aid in rehabilitation treatment in the field of sports medicine and physiotherapy. In present study, authors found that the range of Q angle in right leg was varying from 8° to 24° and in left leg Q angle was varying from 8° to 32° and among genders value of Q angle in right leg of male was varying from the 8° to 21° and range of Q angle in left leg of male was varying from 8° to 24° whereas in females the range of Q angle in right leg was varying from 8° to 24° and in left leg Q angle was varying from 8° to 32°. There were no studies which were done specifically to find the range of Q angle in right and left leg, also range of Q angle in male and females by considering bilateral legs. In the present study, authors measured the Q angle in both limbs and both genders but by the method of three-dimensional computed tomography in lower limb scan and found that the mean of Q angle in male right and left leg was 10.4±3.625 and 12.17±4.59 respectively and in females the mean of Q angle in right and left leg was found to be 13.11±4.25 and 17.34±7.05 respectively. These values of Q angle in left leg of males were similar with study conducted by Nandi M et al., measured Q angle through both radiological and clinical method. In radiological method, the Q angle was measured with the X-ray AP view from anterior superior iliac spine to the tibial tubercle. The Q angle was measured in both limbs and among genders and found that in males the Q angle of both right and left leg was 10.5±2.06 and 10.06±2.09 respectively but there was a difference in values of females Q angle in the right and left leg of 15.8±3.82 and 15.5±3.82 respectively [9]. Authors included femur length of both genders in left and right leg and found left leg femur length is higher than that of right leg femur length by 2 or 3 cm, thus authors can state that the difference in Q angle among right and left can be due to femur length among the gender. This result was similar with the study of Greshlamer RP and Klein J, where they found men have lower Q angles since they are taller than women [10]. In presents study, authors found that Q angle of right leg of both female and male subjects was higher than that of the Q angle of left leg, this result was similar with the study of Jaiyesimi AO and Jagede OO, where the right Q angle was higher than that of left Q angle [6], but this result does not correspond to study done by Nandi M et al., where there was not much difference in right and left Q angle [9]. When gender was considered in present study authors found that the Q angle was higher in females than males, found that in females Q angle in right leg was expected to increase about 2.9217° and in left leg it was expected to increase by 5.499°. But this result was different from that of the study conducted by Greshlamer RP and Klein J, where they found a little difference that is about 2.3° among males and females [10]. Cooney AD et al., conducted a study among 34 symptomatic and non-symptomatic knees to find any association between TT-TG distance and Q angle, their findings revealed that there was negative correlation among Q angle and TT-TG distance in symptomatic knees that is the TT-TG distance increases when Q angle decreases. Whereas, in the present study authors included 140 knees excluding history or radiographic evidence of osteoarthritis, trauma and knee replacement surgery and found there was negative correlation, but this correlation was not significant. This can be due to inclusion of subjects in present study was more comparable than the study conducted by Cooney AD et al., [11]. Metgud S et al., conducted a study in which they compared Q angle and BMI in osteoarthritis patients to find if there was any association. The results of their study revealed that there was no correlation between BMI and Q angle [12], which was similar to present study in which authors did not find a significant correlation between Q angle and BMI.
Clinical Relevance
The reason for conducting the study was to provide an accurate range of Q angle to surgeons which will aid them towards better planning in patella-femoral surgeries and these data will aid in rehabilitation treatment in the field of sports medicine and physiotherapy.
Limitation
The present study was conducted on the normal bone anatomy patient and therefore there is no mention of the TT-TG distance and Quadriceps angle affecting patellar instability and trochlear dysplasia. Since this study intends to give result related to normal anatomy further studies can be initiated considering the abnormality in the bone with a larger sample size and longer duration.
Conclusion
The range of the Q angle varies in both legs among gender. Though there was no significant association between Q angle and femur length, the major factor contributing to the varying Q angle was femur length compared to other parameters. Therefore, Q angle increases with increases in femur length and the left Q angle is more than that of right Q angle. The range of Q angle can vary depending on various factors such as gender, bilateral limbs, pathologies and geographical distribution. Hence, authors suggest the above factors should be taken into consideration for calculation of the range of Q angle.
[1]. Raveendranath V, Nachiket S, Sujatha N, Priya R, Rema D, The quadriceps angle (Q Angle) In Indian men and womenEur J Anat 2009 13(3):105-09. [Google Scholar]
[2]. JafarEmami M, Ghahramani MH, Abdinejad F, Namazi H, Q-angle: An invaluable parameter for evaluation of anterior knee painArchives of Iranian Medicine 2007 10(1):24-26. [Google Scholar]
[3]. Rahimi M, Alizadeh MH, Rajabi R, Mehrshad N, The comparison of innovative image processing and goniometer methods in Q angle measurementWorld Applied Sciences Journal 2012 18(2):226-32. [Google Scholar]
[4]. Madani A, The Correlation Between Q-Angle (Clinical) And TTTG Distance (Axial Computed Thomography) In Firuzgar HospitalMJIRI 2010 23(4):189-99. [Google Scholar]
[5]. Sanchis-Alfonso V, Anterior Knee Pain And Patellar InstabilityIgarss 2014 2014:1-5. [Google Scholar]
[6]. Jaiyesimi AO, Jegede OO, Influence of gender and leg dominance on q-angle among young adult NigeriansAJPARS 2009 1(1):18-23.10.4314/ajprs.v1i1.51309 [Google Scholar] [CrossRef]
[7]. Chevidikunnana MF, Saifb AA, Kc HP, Mathiasd L, Comparing goniometric and radiographic measurement of Q angle of the kneeAsian Biomedicine 2015 9(5):631-36.10.5372/1905-7415.0905.433 [Google Scholar] [CrossRef]
[8]. Mahmood S, Goel A, Grover S, Bedi M, Quadriceps angle and its relationship with gender and footednessJ Punjab Acad Forensic Med Toxicol 2016 16(1):8-12. [Google Scholar]
[9]. Nandi M, deb S, pal JN, tapadar A, roy H, Kar C, The quadricep angle- correlation between clinical and radiographic measurement from a study in north BengalJournal of Anatomical Society of India 2013 62(1):68-72.10.1016/S0003-2778(13)80016-0 [Google Scholar] [CrossRef]
[10]. Grelsamer RP, Klein JR, The biomechanics of the patellofemoral jointJ Orthop Sports Phys Ther 1998 28(5):286-98.10.2519/jospt.1998.28.5.2869809277 [Google Scholar] [CrossRef] [PubMed]
[11]. Cooney AD, Kazi Z, Caplan N, Newby M, Gibson ASC, Kader DF, The relationship between quadriceps angle and tibial tuberosity–trochlear groove distance in patients with patellar instabilityKnee Surg Sports Traumatol Arthrosc 2012 20(12):2399-404.10.1007/s00167-012-1907-822278658 [Google Scholar] [CrossRef] [PubMed]
[12]. Metgud S, Kondal S, Heggannavar A, Association of pain, function, BMI and radiographic evidence of osteoarthritis with clinical assessment of osteoarthritis of the knee jointInt J Physiother Res 2016 4(3):1518-23.10.16965/ijpr.2016.123 [Google Scholar] [CrossRef]