Analysis of MRI Slices of Hamstring Avulsion Injury using Histogram
TR Thamizhvani1, KF Tanveer Ahmed2, A Josephin Arockia Dhivya3, R Chandrasekaran4, RJ Hemalatha5
1 Assistant Professor, Department of Biomedical Engineering, Vels Institute of Science, Technology and Advanced Studies (VISTAS), Pallavaram, Chennai, Tamil Nadu, India.
2 Student, Department of Biomedical Engineering, Vels Institute of Science, Technology and Advanced Studies (VISTAS), Pallavaram, Chennai, Tamil Nadu, India.
3 Assistant Professor, Department of Biomedical Engineering, Vels Institute of Science, Technology and Advanced Studies (VISTAS), Pallavaram, Chennai, Tamil Nadu, India.
4 Assistant Professor, Department of Biomedical Engineering, Vels Institute of Science, Technology and Advanced Studies (VISTAS), Pallavaram, Chennai, Tamil Nadu, India.
5 Head, Department of Biomedical Engineering, Vels Institute of Science, Technology and Advanced Studies (VISTAS), Pallavaram, Chennai, Tamil Nadu, India.
NAME, ADDRESS, E-MAIL ID OF THE CORRESPONDING AUTHOR: Dr. TR Thamizhvani, Assistant Professor, Department of Biomedical Engineering, Vels Institute of Science, Technology and Advanced Studies (VISTAS), Pallavaram-600117, Chennai, Tamil Nadu, India.
E-mail: thamizhvani.se@velsuniv.ac.in
Introduction
Hamstring avulsion injury can be defined as improper functioning of the hamstring muscles due to external stress or strain. The detachment of hamstring muscular region from the tendons occurs under severe conditions. Magnetic Resonance Imaging (MRI) is used as a diagnostic tool to study the region of injury. Histogram analysis is a special type of image processing technique used to describe the changes in the gray levels of the images based on the abnormalities.
Aim
To analyse the region of Hamstring avulsion injury in MRI slices using histogram.
Materials and Methods
Hamstring avulsion injury MRI slices were obtained from an authorised database, Radiopeadia for analysis. Histogram of each slice of the MRI image was determined. Statistical features were derived from the histogram of each slice which was used to identify specific slice of MRI with high intensity avulsion injury. MRI slice with high intensity was determined for further processing and analysis of the injury. For further accurate identification of the high intensity slice in the MRI slices, statistical features of the slice histogram were obtained. These features were used to define the exact high intensity slice.
Results
Histograms of 10 slices of an image were compared to obtain the slice with high intensity region. After comparison, slice four described the high intensity which defines the affected region of hamstring muscle. For further detailed study, statistical values were derived from the histogram. These values were significant for all the 10 slices but highly significant for the slice four. Slice four was further analysed to confirm all the details about the nature of the affected region of injury in hamstring muscle.
Conclusion
Histogram defines the intensity variations of the pixels which mainly illustrate the nature of abnormalities, injuries or recognition of any region in the human body. Histogram based statistical values were used to analyse the abnormality or injury. These features were used in different ways for diagnosis and analysis of various abnormalities or disorders. Thus, Histogram and statistical features derived from the histogram from the MRI slices of hamstring avulsion injury were compared to identify the slice that possess high intensity region for the identification of the injury and its characteristics.
Avulsion injury, Magnetic resonance imaging, Statistical features
Introduction
Image processing is a process mainly defined for the analysis and determination of digital images which changes the quality and intensity of the image. The imaging process is performed to study and analyse the abnormalities or any absurd changes in the image. This process is specifically used to detect abnormalities and absurdities in the structural and functional regions of the body in the digital image. Histogram can be described as the graphical representation of the intensity variations of the gray levels or colour variations. Histogram studies the nature of the pixels and intensity flexibilities in the digital image. Histogram can be obtained for various medical images to diagnose the abnormalities and to identify the affected region. Histogram can be performed in images of different imaging modalities like CT, MRI, and Ultrasound for determination of the affected regions in the body [1].
Statistical analysis in image processing can be described as the interpretation and analysis of the statistical values of the region of interest or the digital image to diagnose and detect the medical state of the individual [2]. Statistical features such as Average intensity, Entropy, Standard deviation and Variance were determined for the analysis of MRI slices of hamstring avulsion image. Thus, the digital image can be defined exactly with these simple statistical values or features.
Malathi G et al., described use of histogram for classification of 11 ultrasound images of placenta. Histogram was used for the clear description and detection of placenta. Placental structures were analysed using histogram technique [1]. Kumar S et al., defined the change in enhancement of the brain MRI images after applying the pre-processing technique. The change in the quality and visual appearance of the image was analysed based on the grey level values of the digital image. The grey level of the image can be determined with the help of histogram [2]. Stevens MA et al., described that MR imaging was most suitable to detect the injuries in the knee, pelvis, ankle and foot of the participants in organised sports. Recognition of the injury with the help of characteristic imaging features was possible using MR imaging [3].
The objective of the study was to identify the absolute slice of MRI which possesses the entire section of the hamstring avulsion injury. In this study histogram of the MRI slices and statistical analysis of the histogram obtained were used for the determination and diagnosis of the avulsion injury.
Materials and Methods
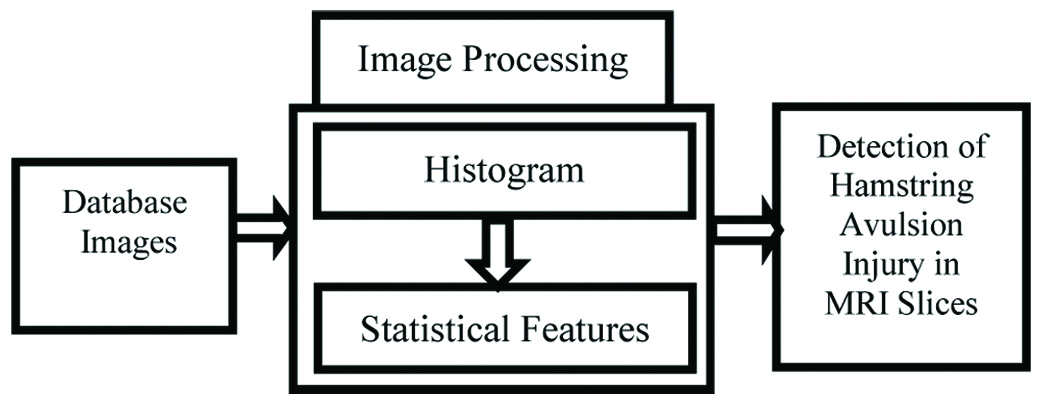
In this study, MRI slices of hamstring avulsion injury were obtained from the standard database for analysis. Radiopaedia (https://radiopaedia.org/cases/hamstring-avulsion-injury) is the authorised database from which the MRI slices of hamstring avulsion injury of a male patient (45-year-old) was obtained for study. Histogram of the MRI slices of the image was obtained from which statistical features were extracted. Based on these features, hamstring avulsion injury region in a particular slice of MRI was identified. Pixel and intensity variations in the histogram of the MRI slices were studied with the help of this high intensity slice can be used for diagnosis of the nature of the injury which can be prolonged to tear. The methodology for analysis of particular slice of avulsion injury using histogram based statistical values is described in the [Table/Fig-1].
Methodology for analysis of specific MRI slice of hamstring injury.
Histogram
Histogram is a graphical representation that can be defined as static probability distribution of the gray levels of digital images. Histogram also describes density, the average luminance of an image and image contrast. Histogram is mainly used in image enhancement for detection of the affected region [4,5]. Variations in the Pixel Intensity define the image histogram. Histogram of an image is described in the equation (1) with nk as number of pixels in the image having the gray level (rk). P(rk) is the probability of the kth gray level and n is the total number of pixels.
Histogram based Statistical Analysis
Statistical features were obtained from the histogram of MRI slices of hamstring injury image. Statistical features obtained from the histogram of each slice vary according to the gray level intensity changes or distribution in the image histogram. Four different statistical features based on histogram were considered for the analysis of specific MRI slice with high intensity regions of hamstring avulsion injury or tear.
Average Intensity is defined as the average numerical value of pixels in gray level images. Intensity was mainly defined to determine the quality of brightness and contrast of gray level image as required for visualising the affected hamstring injury region. Entropy is randomness in statistical form which is mainly used to characterise the texture in an image. Entropy was used to calculate the quantity or amount of gray level pixels [6,7]. Entropy of an image is described in the equation (2) with P (i, j) the gray coded values.

Standard deviation (σ) determines the variation or dispersion measure of a set of data values with the mean μ and number of probabilities from p1, p2… pN. as pi which is shown in the equation (3).

Standard deviation of the elements of matrix was determined for further statistical analysis [8]. Expectation of the squared deviation of a random variable from its mean can be defined as Variance. In general, it is described as the spread out of set of random numbers from their average value [9,10]. Variance determines the quality of gray level images in different locations by enhancing the contrast of the image which is defined in the equation (4):

Histogram and the statistical features based on the histogram of 10 slices of MRI image were analysed to obtain the appropriate slice of high intensity for description of the hamstring avulsion injury.
Results
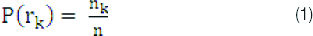
In this paper, histogram was used for comparison of 10 slices of an MRI image. Histogram describes the increase in contrast of an image that can be helpful in identifying the hamstring muscle tear or injury. Intensity variations otherwise known as contrast changes of each slice were described with the histogram. Slice 1, slice 4, slice 6, slice 8 and slice 10 of avulsion injury MRI along with the histogram of plot is illustrated in [Table/Fig-2]. In this figure, image of each slice with the intensity variations in the form of a plot called histogram is defined. Histogram in this study was used to describe the intensity in the pixels of the image to the spread of the intensity and its variations in the slice considered. With these intensity variations, the region of injury can be defined. When the 10 slices are compared, slice four possess highly spread intensity region. Fourth slice with high intensity can be used to describe the affected region of avulsion injury. Histogram for the MRI slices of Hamstring avulsion injury for different slices with varying intensity was used to analyse the injury or tear.
Histogram of five different slices of MRI hamstring injury image.
Statistical values of the histogram of the image slices were obtained to illustrate the nature of the injury. Significance of the statistical values was defined with the help of intensity and pixel values. Each slice of hamstring avulsion injury possesses various intensity levels. Statistical features derived from the histogram show the presence of exact region of muscle tear by analysing the contrast of gray level images of MRI slices. From these values, Slice four was determined to possess highly significant statistical values when compared to all other MRI slices of injury image considered for analysis. A p-value of the statistical features was determined to study the significant nature of the features obtained from the histogram of the MRI slices of hamstring avulsion injury. Histogram based statistical features of MRI slices of a single hamstring avulsion injury image is described in the [Table/Fig-3].
Histogram based statistical features for MRI slices of Hamstring avulsion injury.
| Histogram based Statistical Features | Slice 1 | Slice 2 | Slice 3 | Slice 4 | Slice 5 | Slice 6 | Slice 7 | Slice 8 | Slice 9 | Slice 10 | p-value |
|---|
| Avg Intensity | 33.1 | 31.6 | 32.9 | 38.1 | 36 | 30.1 | 24.1 | 19.2 | 12.5 | 13.1 | <.0001 |
| Entropy | 4.31 | 4.32 | 4.37 | 4.95 | 4.47 | 4.22 | 3.98 | 3.62 | 2.94 | 2.72 |
| Standard deviation | 2.39 | 2.81 | 3.37 | 4.10 | 3.62 | 3.28 | 3.03 | 3.04 | 2.54 | 2.36 |
| Variance | 5.72 | 7.90 | 11.3 | 16.8 | 13.1 | 10.8 | 9.20 | 9.29 | 6.45 | 5.56 |
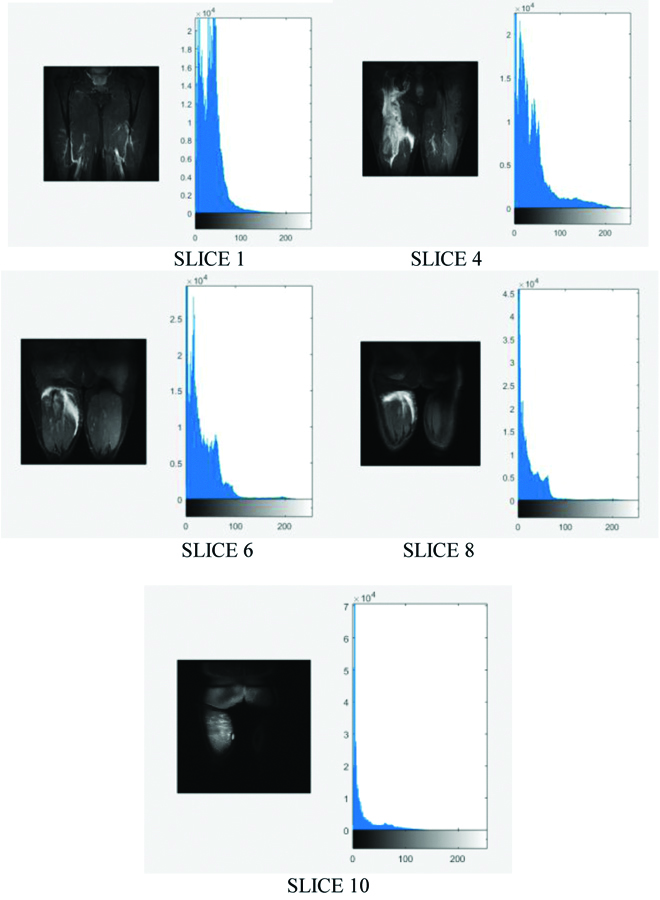
Statistical features obtained from the histogram of the MRI slices of hamstring avulsion injury are represented graphically in [Table/Fig-4]. The graph shows accurate values for analysis of the hamstring avulsion injury. Slice four of MRI image was determined to possess the high intensity regions of hamstring avulsion injury by comparing all the statistical features derived from histogram. Average intensity, entropy, standard deviation and variance were the basic statistical features derived from the histogram for analysis. Thus histogram and the statistical features derived from the histogram were used for identification of the specific slice with high intensity hamstring avulsion injury in the MRI.
Graphical representation of statistical features of MRI slices.
With the help of this slice, the affected injury region can be analysed and studied. Thus the nature of the injury, whether it leads to muscle tear or tendon detachment can be configured with histogram and statistical features derived from the histogram.
Discussion
Histogram and statistical analysis of the histogram were used to diagnose the slice of MRI which possesses the high intensity regions of hamstring avulsion injury. Histogram is used to analyse the quality and visual appearance of the digital image based on the pixel density distribution. Several studies mainly concentrate on the use of histogram, graphical representation for the study of the digital images.
Analysis of MRI images performed with histogram are to understand the different section of the regions in the image. Histogram feature extraction derived from the MRI structural data was used to determine gray matter similarity-matrix which classifies the Alzheimer’s patients from normal people [4]. Abnormality or injury in the intervertebral discs was analysed with the help of histogram features. Histogram analysis was proved to be suitable for the description of the injury [5]. Posterior fossa tumour types in children were identified and classified based on the shape, histogram and texture features. Histogram features were used to detect the accurate type of tumours after classification [11]. Histogram and statistical features derived from the histogram were used for the description of the affected region or injury in the hamstring muscle.
Conclusion
Hamstring avulsion injury is predominant among the athletes which lead to serious damage to the muscles in the posterior thigh regions. Hamstring avulsion injury causes muscle tear or detachment of muscle from the bone at extreme conditions. This avulsion injury can be studied effectively with Magnetic Resonance Imaging since the injury is related to muscular tissue region. In this paper, MRI slices of Hamstring avulsion injury was obtained from the standard database for analysis. The image considered for analysis possesses 10 slices, histogram was described for each slice of the image. Statistical features for histogram of each slice was determined. Based on these features, slice four was defined to possess the equal distribution of high intensity injury region. With this slice, region of injury can be described accurately for the detection and diagnosis of the affected muscular region. Histogram and statistical values were used for comparing the slices of MRI and to illustrate that which slice possesses equal distribution of high intensity of injury region for further analysis. Thus the MRI slice with the distribution of high intensity avulsion injury was obtained from an image by comparing the histogram and histogram based statistical features.
Future work concentrates on determination of various morphological and structural features for the hamstring avulsion injury region for exact segmentation of the avulsion injury. For diagnosis and detection of the injury region, classification process can be carried out.
Limitation
Histogram is basic and simple technique which is used in determining the high intensity MRI slice from the hamstring avulsion injury image. The MRI slices of hamstring avulsion injury may possess varying intensity ranges for T1 and T2 images obtained. Histogram may not be more effective for highly varying intensity. Histogram cannot distinguish certain intensity values. So along with histogram, adjustment of the pixel values based on clipping and contrast adjustment using histogram can be performed.
[1]. Malathi G, Shanthi V, Histogram based classification of ultrasound images of placentaInternational Journal of Computer Applications [Internet] 2010[cited 2010 Feb] 1(16):49-52.Available from: https://www.ijcaonline.org/archives/number16/343-52210.5120/343-522 [Google Scholar] [CrossRef]
[2]. Yadav AK, Kumar S, Analysis of histogram processing for brain MRI using MATLABInternational Journal of Innovative Research in Engineering & Science [Internet] 2015 [cited 2015 March] 3:20-30.Available from: https://www.researchgate.net/profile/Ashwani_Yadav3/publication/278501432_Analysis_of_Histogram_Processing_for_Brain_MRI_using_MATLAB/links/55813c0708aea3d7096e6544.pdf00000000000 [Google Scholar]
[3]. Stevens MA, El-Khoury GY, Kathol MH, Imaging features of avulsion injuriesRadiographics [Internet] 1999 [cited 1999 May] 19(3):655-72.Available from: https://www.ncbi.nlm.nih.gov/pubmed/1033619610.1148/radiographics.19.3.g99ma0565510336196 [Google Scholar] [CrossRef] [PubMed]
[4]. Beheshti I, Maikusa N, Matsuda H, Demirel H, Anbarjafari G, Histogram-based feature extraction from individual gray matter similarity-matrix for alzheimer’s disease classificationJournal of Alzheimer’s Disease [Internet] 2016 [cited 2016 Dec 20] 55(4):1571-82.Available from: https://content.iospress.com/articles/journal-of-alzheimers-disease/10.3233/JAD-16085027886012 [Google Scholar] [CrossRef] [PubMed]
[5]. Waldenberg C, Hebelka H, Brisby H, Lagerstrand KM, MRI histogram analysis enables objective and continuous classification of intervertebral disc degenerationEuropean Spine Journal [Internet] 2018 [cited 2018 Aug 18] 27(5):1042-48.Available from: https://www.ncbi.nlm.nih.gov/pubmed/2882197410.1007/s00586-017-5264-728821974 [Google Scholar] [CrossRef] [PubMed]
[6]. Chamming’s F, Ueno Y, Ferré R, Kao E, Jannot AS, Chong J, Features from computerized texture analysis of breast cancers at pretreatment mr imaging are associated with response to neoadjuvant chemotherapRadiology [Internet] 2017 [cited 2017 Oct 4] 286(2):1-9.Available from: https://doi.org/10.1148/radiol.201717014310.1148/radiol.201717014328980886 [Google Scholar] [CrossRef] [PubMed]
[7]. Katsaros VK, Nikiforaki K, Manikis G, Marias K, Liouta E, Boskos C, Whole tumor MR Perfusion histogram analysis in the preoperative assessment of patients with gliomas: Differentiation between high- and low-grade tumorsNeuroradiology [Internet] 2016 [cited 2016 Dec 15] 2(1):30-38.Available from: http://hjradiology.org/index.php/HJR/article/view/130 [Google Scholar]
[8]. Zhang Y, Brady M, Smith S, Segmentation of brain MR Images through a hidden markov random field model and the expectation-maximization algorithmIEEE Transactions on Medical Imaging [Internet] 2001[cited 2001 Jan] 20(1):45-57.Available from: https://ieeexplore.ieee.org/abstract/document/90642410.1109/42.90642411293691 [Google Scholar] [CrossRef] [PubMed]
[9]. Chang DC, Wu WR, Image contrast enhancement based on a histogram transformation of local standard deviationIEEE Transactions on Medical Imaging [Internet] 1998 [cited 1998 Aug] 17(4):518-31.Available from: https://ieeexplore.ieee.org/document/73039710.1109/42.7303979845308 [Google Scholar] [CrossRef] [PubMed]
[10]. DeCarli C, Murphy DG, Teichberg D, Campbell G, Sobering GS, Local histogram correction of MRI spatially dependent image pixel intensity non-uniformityJournal of Magnetic Resonance Imaging [Internet] 1996 [cited 1996 May] 6(3):519-28.Available from: https://www.ncbi.nlm.nih.gov/pubmed/872441910.1002/jmri.18800603168724419 [Google Scholar] [CrossRef] [PubMed]
[11]. Rodriguez Gutierrez D, Awwad A, Meijer L, Manita M, Jaspan T, Dineen RA, Metrics and textural features of MRI diffusion to improve classification of pediatric posterior fossa tumorsAmerican Journal of NeuroRadiology [Internet] 2013 [cited 2014 May] 35(5):1009-15.Available from: http://www.ajnr.org/content/35/5/100910.3174/ajnr.A378424309122 [Google Scholar] [CrossRef] [PubMed]