Introduction
In Orthodontics, malposed teeth are moved into proper alignment by the application of forces. These forces originate from wires, elastics and other appliances attached to the teeth [1]. Often, teeth that are in proper alignment are used to provide the force to move those that are not, and are referred as anchorage teeth [2,3]. Anchorage is a critical component to successful orthodontic treatment.
Obtaining maximum or absolute anchorage has always been the main goal for the Orthodontist. A Skeletal Anchorage System (SAS) derived from dental implant provides absolute anchorage. Mini-implant is used for skeletal anchorage. The retention and stability is derived from mechanical inter-digitation between the cortical bone and the mini-implant [4]. And so, locations with thick and dense cortical bone are the most favourable sites for the placement of mini-implants [5].
Cortical bony morphology is influenced by the application of forces, stresses and strains produced by functional load of muscles. Facial divergence is related to muscular function and there is a relationship between cortical bone thickness and facial divergence [6]. Many researchers have suggested that bone shape and structure are closely related to the attached muscle activity. Their studies showed that the thickness of cortical bone of the jaw develops poorly due to the level of stimulation from the masticatory system. It was also found that buccal and lingual cortical plate thickness was thicker in hypo divergent individuals than in the normal and hyper divergent individuals [3,4]. The present study focused on the use of three-D volumetric imaging method for the placement of mini-implants.
However, the hyper divergent face pattern and large gonial angle have thin cortical bone and therefore have increased incidence of mini-implant failure. The thin buccal cortical bone is associated with weak masticatory musculature in hyper divergent facial pattern. Thick buccal cortical bone is associated with a hypo divergent face pattern, smaller gonial angle and strong masticatory musculature [7,8].
Though there are constant advancements in the use of mini-implants, there placement is still a topic of concern. Placement of mini-implants without damage to vital structures is the prime disquiet. Stability, especially initial stability plays a major role in preventing premature loosening of mini-implant by placing mini-implant in alveolar bone with sufficient bone thickness and adequate bone mineral density. Till date to evaluate the optimal locations for mini-implant placement various methods have been used including panoramic radiographs, computed tomography, digital volume tomography based on the cone-beam technique and human cadaver skulls [9,10].
The 3-DVT images can provide accurate measurements of small areas in bone to determine the best anchors placement areas which moreover offers significant protection against the two major problems of mini-implant placement that is safety and stability. The advent of 3-DVT has decreased patient radiation exposure and has increased accessibility to imaging. This technique provides volume data that is used to obtain cross-sectional slices of the jaws and to assess the volume of the alveolar bone (width and height) and thickness of cortical bone prior to mini-implant placement [11].
Therefore, this study was carried out to measure the thickness of cortical bone and inter-radicular space at specified sites (i.e., 5 mm, 7 mm and 9 mm) from CEJ between permanent canine to permanent second molar in maxilla and mandible on both sides respectively for mini-implant placement using 3-DVT. The thickness of cortical bone and inter-radicular space which was measured in both the jaws was compared in subjects with hypo divergent, hyper divergent and normal facial growth patterns.
Materials and Methods
A cross-sectional study was carried out with the age group of 18 to 26 years over a period of six months i.e., March 2011-Aug 2011 in the Department of Orthodontics and Dentofacial Orthopaedics at Sharad Pawar Dental College, Sawangi, Wardha, Maharashtra. Research Ethical Committee approval was obtained before starting the study. Total 45 subjects were randomly selected based on an alpha significance level of 5% (0.05) and a beta of 0% (0.20) to achieve 80% power test. The study subjects were divided into three groups consisting 15 subjects in each group.
The inclusion criterion was subjects without any systemic illness, subjects without any indication for orthognathic surgery and history of orthodontic treatment. Exclusion criteria was subjects with missing teeth (excluding third molar), incomplete eruption of crowns, severe periodontitis (determined from radiographic signs of alveolar bone resorption), ectopic eruption, severe posterior crowding and subjects with moderate interdental spacing (≥1 mm space between adjacent crowns).
The selected subjects were categorised into hyper divergent, hypo divergent and normal facial growth pattern individuals based on Frankfort Horizontal Plane angle (angle FMPA) with the help of cephalometric analysis. Cephalograms were taken with the teeth in maximum inter cuspation in standardised manner. The facial patterns were then classified according to the FMA angle which follows: Hyper Divergent Facial Pattern-FMA greater than 30°, Normal Facial Growth Pattern-FMA 20°-30° and Hypo Divergent Face Pattern-FMA less than 20 [12].
A 3-DVT scan was conducted using KODAK 9000C 3D and KODAK 9000C at an imagining centre. The 3-DVT was obtained for all the study subjects. They were made to stand straight with the support of hand grip rods. Face was stabilised with 3D chin rest in the standard plane, which consisted of midpoint of both central incisors coinciding the centre mark on the 3D chin rest. The head was adjusted to the X-ray beam and was stabilised with the temple support rods. Laser beam was then used to confirm the correct position of the patient. In case of incorrect positioning, whenever a red light was displayed on the control panel, the position was corrected accordingly.
Methodology
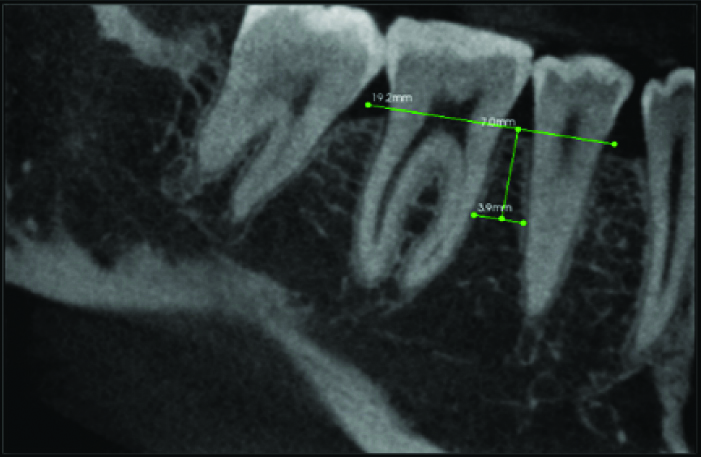
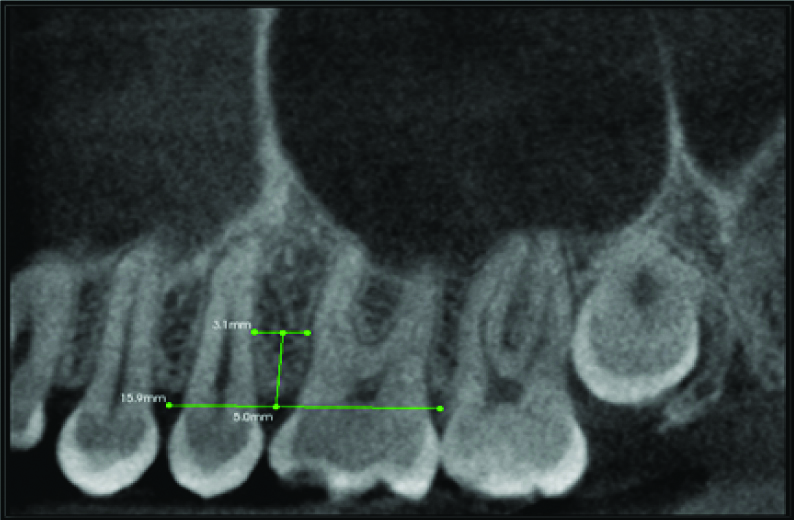
The 3-DVT images were generated by the Kodak 3D viewer, 2.2 version software for each subject. By using this software, curved slicing images with sections of 76 μm thickness were selected for measurements. The images were oriented in three planes (sagittal plane, axial plane, coronal plane) of space so that the inter-radicular space and buccal cortical plates could be measured from the CEJ [Table/Fig-1,2].
Inter-radicular space determination in Mandibular Arch, Horizontal green line=Connecting line between CEJ of both the teeth.
Inter-radicular space determination in Maxillary Arch, Horizontal green line=Connecting line between CEJ of both the teeth.
Horizontal green line on root surface=inter-radicular width,
Vertical green line in between molar and premolar=Distance from inter radicular space between premolar and molar till the depth of 7 mm.
Two measurements were done on buccal side between the canine to second molar region with the help of measurement tool in the KODAK 3D viewer software for inter-radicular distance at three random heights chosen i.e., at 5 mm, 7 mm and 9 mm and for cortical bone thickness at three heights i.e., at 5 mm, 7 mm, 9 mm from the CEJ on both sides of the upper and lower arches. The inter-radicular space was measured in sagittal plane and the cortical space was measured in coronal plane.
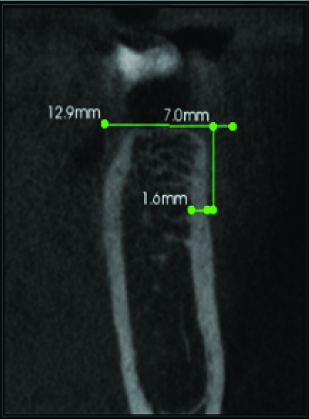
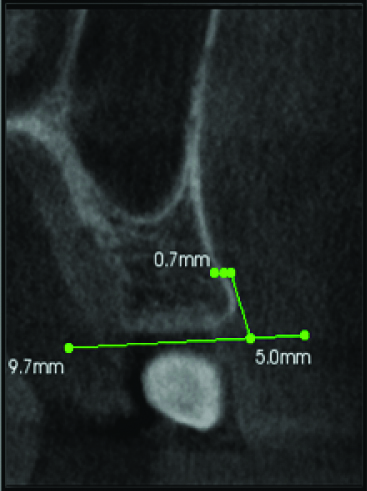
For measurement of inter-radicular space, a line was drawn from the mesial CEJ of one tooth to the distal CEJ of adjacent tooth and from that line, perpendicular line was drawn at 5 mm, 7 mm and 9 mm respectively between two adjacent roots to measure the inter-radicular space. The inter-radicular distance is the distance between distal most and mesial most surface of the roots of two adjacent teeth. For measurement of cortical bone thickness a line was drawn from the buccal CEJ to palatal/lingual CEJ and from that line a perpendicular line was drawn on the buccal side at 5 mm, 7 mm and 9 mm [Table/Fig-3,4].
Cortical bone thickness in Mandible.
Perpendicular line was drawn on the buccal side depicts the cortical bone thickness in Mandible
Cortical bone thickness in Maxilla.
Perpendicular line was drawn on the buccal side depicts the cortical bone thickness in Maxilla
Statistical Analysis
One-way ANOVA was used to analyse the data with statistical significance considered at a p-value lower than 0.05 at 95% confidence interval. The statistical analysis was performed with IBM SPSS Statistics Version 20 for Windows (IBM Corporation, NY, USA. SPSS, Inc., an IBM Company).
Results
The present cross sectional study had three groups with 45 total study subjects and they were randomly selected including both males and females, consisting 15 subjects in each group.
Cortical bone thickness in mandible.
| Quadrant | Level (mm) | Region | Hypo | Normal | Hyper | p-value |
|---|
| | | Mean | SD | Mean | SD | Mean | SD | |
|---|
| Right | 5 | 7-6 | 2.34 | 0.2701 | 2.32 | 0.3346 | 2 | 0.5338 | 0.4598 |
| 6-5 | 1.78 | 0.2588 | 1.68 | 0.2280 | 1.38 | 0.0836 | 0.2675 |
| 5-4 | 1.82 | 0.3114 | 1.48 | 0.2949 | 1.38 | 0.1095 | 0.0571 |
| 4-3 | 1.48 | 0.2774 | 1.24 | 0.3781 | 1.18 | 0.2167 | 0.1428 |
| 7 | 7-6 | 2.52 | 0.4086 | 2.5 | 0.3872 | 2.28 | 0.3271 | 0.4693 |
| 6-5 | 2.16 | 0.3974 | 2 | 0.2549 | 1.5 | 0.0707 | 0.2350 |
| 5-4 | 2.08 | 0.31144 | 1.78 | 0.4381 | 1.58 | 0.0836 | 0.1236 |
| 4-3 | 1.62 | 0.1643 | 1.5 | 0.4301 | 1.28 | 0.1643 | 0.2880 |
| 9 | 7-6 | 2.52 | 0.4086 | 2.5 | 0.5385 | 2.3 | 0.3240 | 0.4744 |
| 6-5 | 2.24 | 0.4159 | 2.3 | 0.3872 | 1.74 | 0.0547 | 0.4096 |
| 5-4 | 2.16 | 0.3130 | 1.94 | 0.3507 | 1.68 | 0.1303 | 0.1629 |
| 4-3 | 1.88 | 0.2280 | 1.68 | 0.3834 | 1.46 | 0.2408 | 0.2010 |
| Left | 5 | 7-6 | 2.52 | 0.1643 | 2.36 | 0.3577 | 1.14 | 0.2880 | 0.0890 |
| 6-5 | 2 | 0.2774 | 1.66 | 0.3286 | 1.36 | 0.1816 | 0.1237 |
| 5-4 | 1.78 | 0.4527 | 1.54 | 0.2302 | 1.42 | 0.1643 | 0.0864 |
| 4-3 | 1.52 | 0.4604 | 1.26 | 0.2509 | 2.0 | 0.1516 | 0.2571 |
| 7 | 7-6 | 2.82 | 0.2167 | 2.54 | 0.4242 | 1.24 | 0.3041 | 0.2943 |
| 6-5 | 2.1 | 0.3049 | 1.88 | 0.3271 | 1.52 | 0.1923 | 0.1149 |
| 5-4 | 1.94 | 0.4636 | 1.7 | 0.2949 | 1.64 | 0.2073 | 0.1984 |
| 4-3 | 1.62 | 0.4816 | 1.5 | 0.3130 | 2.26 | 0.2966 | 0.1537 |
| 9 | 7-6 | 2.8 | 0.3768 | 2.62 | 0.5128 | 2.3 | 0.2280 | 0.4728 |
| 6-5 | 2.18 | 0.3781 | 2.12 | 0.3 | 1.72 | 0.1949 | 0.2674 |
| 5-4 | 2.04 | 0.4266 | 1.9 | 0.3834 | 1.66 | 0.2588 | 0.4104 |
| 4-3 | 1.78 | 0.4472 | 1.76 | 0.5118 | 1.42 | 0.3872 | 0.2850 |
Test Applied : One-way ANOVA, 3-Canine, 4-First Premolar, 5-Second Premolar, 6-First Molar, 7-Second Molar
Cortical bone thickness in maxilla.
| Quadrant | Level (mm) | Region | Hypo divergent | Hyper divergent | Normal | p-value |
|---|
| | | Mean | SD | Mean | SD | Mean | SD | |
|---|
| Right | 5 mm | 7-6 | 1.32 | 0.1643 | 1.04 | 0.1673 | 1.34 | 0.894 | 0.0141* |
| 6-5 | 1.26 | 0.2190 | 1.0 | 0.2738 | 1.04 | 0.1516 | 0.0679 |
| 5-4 | 1.24 | 0.3049 | 1.2 | 0.3391 | 1.18 | 0.1140 | 0.4247 |
| 4-3 | 1.16 | 0.1949 | 0.92 | 0.0836 | 1 | 0.1581 | 0.0176* |
| 7 mm | 7-6 | 1.42 | 0.1923 | 1.14 | 0.1673 | 1.4 | 0.1224 | 0.0197* |
| 6-5 | 1.34 | 0.1516 | 1 | 0.1581 | 1.04 | 0.2190 | 0.0081* |
| 5-4 | 1.24 | 0.1923 | 0.92 | 0.2167 | 1.2 | 0.2236 | 0.0806 |
| 4-3 | 1.16 | 0.2167 | 0.96 | 0.0894 | 1.1 | 0.1581 | 0.2430 |
| 9 mm | 7-6 | 1.5 | 0.0707 | 1.2 | 0.1870 | 1.5 | 0.2236 | 0.0050* |
| 6-5 | 1.4 | 0.1581 | 1.0 | 0.1581 | 1.14 | 0.1673 | 0.0057* |
| 5-4 | 1.38 | 0.1483 | 1.08 | 0.1308 | 1.22 | 0.2280 | 0.0047* |
| 4-3 | 1.42 | 0.2167 | 1.04 | 0.1140 | 1.18 | 0.1788 | 0.0042* |
| Left | 5 mm | 7-6 | 1.3 | 0.1673 | 1.08 | 0.0894 | 1.26 | 0.1673 | 0.0230* |
| 6-5 | 1.3 | 0.3130 | 1.16 | 0.3646 | 1.26 | 0.4159 | 0.3270 |
| 5-4 | 1.26 | 0.1 | 1.02 | 0.1303 | 1.14 | 0.2302 | 0.0025* |
| 4-3 | 1.16 | 0.2121 | 0.96 | 0.2049 | 0.96 | 0.1516 | 0.0669 |
| 7 mm | 7-6 | 1.28 | 0.1923 | 1.04 | 0.0894 | 1.3 | 0.1788 | 0.0471* |
| 6-5 | 1.4 | 0.3130 | 1.24 | 0.1673 | 1.16 | 0.2073 | 0.1007 |
| 5-4 | 1.2 | 0.2236 | 1 | 0.1581 | 1.16 | 0.2607 | 0.0057* |
| 4-3 | 1.22 | 0.1303 | 1.16 | 0.1516 | 1.08 | 0.0707 | 0.1311 |
| 9 mm | 7-6 | 1.46 | 0.1414 | 1.28 | 0.1303 | 1.28 | 0.1303 | 0.0348* |
| 6-5 | 1.46 | 0.2073 | 1.1 | 0.1224 | 1.2 | 0.2 | 0.00509* |
| 5-4 | 1.38 | 0.2280 | 1.06 | 0.1516 | 1.18 | 0.2274 | 0.0220* |
| 4-3 | 1.3 | 0.2607 | 1.12 | 0.2280 | 1.18 | 0.2280 | 0.1393 |
Test Applied : One-way ANOVA, 3-Canine, 4-First Premolar, 5-Second Premolar, 6-First Molar, 7-Second Molar
In hypo divergent individuals, in both the jaws, cortical bone thickness exhibited a tendency to increase from CEJ to the apex, but a more remarkable increase was seen in the mandible. Mandibular cortical bone thickness increased from canine to second molar. Also, mandibular cortical bone was significantly thicker, especially between the first and second molars. Average maxillary cortical bone thickness was 1.16 to 1.5 mm (SD=0.16-0.07). Average mandibular cortical bone thickness was 1.48 to 2.82 mm (SD=0.27-0.48).
In hyper divergent individuals, cortical bone was thinner than in hypo divergent and normal facial growth pattern patients. Average maxillary cortical bone thickness was 0.92 to 1.28 mm (SD=0.08-0.22). Average mandibular cortical bone thickness in hyper divergent facial form was 1.14 to 2.30 (SD=0.28-0.38).
In normal facial growth pattern individuals, average maxillary cortical bone thickness was 0.96 to 1.5 mm (SD=0.16-0.22). Average mandibular cortical bone thickness was 1.24 to 2.82 mm (SD=0.35-0.51).
Inter radicular distance in Mandible.
| Quadrant | Level (mm) | Region | Hypo | Normal | Hyper | p-value |
|---|
| | | Mean | SD | Mean | SD | Mean | SD | |
|---|
| Right | 5 mm | 7-6 | 3.62 | 0.6099 | 2.76 | 0.3507 | 3.24 | 0.8561 | 0.0128* |
| 6-5 | 2.62 | 0.2588 | 2.92 | 0.1923 | 2.68 | 0.5848 | 0.0355* |
| 5-4 | 2.54 | 0.5272 | 2.48 | 0.4549 | 2.92 | 1.1819 | 0.4260 |
| 4-3 | 1.7 | 0.5385 | 1.98 | 0.9959 | 1.56 | 0.7569 | 0.2976 |
| 7 mm | 7-6 | 4.0 | 0.8 | 2.98 | 0.5019 | 3.64 | 1.0014 | 0.0210* |
| 6-5 | 2.62 | 0.4207 | 3.24 | 0.3042 | 3.22 | 0.6266 | 0.0212* |
| 5-4 | 2.86 | 0.5941 | 2.92 | 0.4381 | 3.26 | 1.3849 | 0.4301 |
| 4-3 | 1.98 | 0.6723 | 2.22 | 1.1300 | 1.52 | 0.7661 | 0.3469 |
| 9 mm | 7-6 | 4.5 | 1.0583 | 3.12 | 0.7596 | 4.32 | 1.1882 | 0.0226* |
| 6-5 | 2.81 | 0.5897 | 3.58 | 0.3033 | 3.76 | 0.6348 | 0.0166* |
| 5-4 | 3.16 | 0.6348 | 3.22 | 0.4764 | 3.68 | 1.5319 | 0.4349 |
| 4-3 | 2.2 | 0.9617 | 2.44 | 1.2856 | 1.66 | 0.8203 | 0.3733 |
| Left | 5 mm | 7-6 | 1.66 | 0.5504 | 1.86 | 0.7197 | 1.74 | 0.8384 | 0.2818 |
| 6-5 | 2.9 | 0.6819 | 2.88 | 0.6140 | 2.78 | 1.1222 | 0.4811 |
| 5-4 | 2.62 | 0.7120 | 2.7 | 0.4358 | 2.8 | 0.4690 | 0.4178 |
| 4-3 | 2.96 | 0.6693 | 2.72 | 0.7563 | 2.92 | 0.9679 | 0.3047 |
| 7 mm | 7-6 | 1.92 | 0.7463 | 2.04 | 1.0163 | 1.8 | 0.9899 | 0.4184 |
| 6-5 | 3.42 | 0.7395 | 3.4 | 0.6324 | 3.22 | 1.1077 | 0.4822 |
| 5-4 | 2.82 | 0.6379 | 3.0 | 0.4358 | 3.14 | 0.6877 | 0.3082 |
| 4-3 | 3.24 | 1.0644 | 2.92 | 0.8843 | 3.38 | 1.1388 | 0.3095 |
| 9 mm | 7-6 | 2.26 | 0.8502 | 2.18 | 1.1189 | 1.9 | 1.0583 | 0.4509 |
| 6-5 | 4.0 | 0.9246 | 3.76 | 0.7987 | 3.84 | 1.045 | 0.3360 |
| 5-4 | 3.14 | 0.6024 | 3.32 | 0.4919 | 3.36 | 0.6387 | 0.3094 |
| 4-3 | 3.98 | 1.4498 | 3.34 | 0.9396 | 4.16 | 1.6876 | 0.2157 |
Test Applied: One-way ANOVA, 3-Canine, 4-First Premolar, 5-Second Premolar, 6-First Molar, 7-Second Molar
Inter Radicular distance in Maxilla.
| Quadrant | Level (mm) | Region | Hypo | Normal | Hyper | p-value |
|---|
| | | Mean | SD | Mean | SD | Mean | SD | |
|---|
| Right | 5 mm | 7-6 | 1.88 | 0.8526 | 1.6 | 0.7582 | 1.62 | 1.1519 | 0.1397 |
| 6-5 | 3.14 | 0.6877 | 3.02 | 0.5718 | 2.94 | 1.0188 | 0.2043 |
| 5-4 | 2.54 | 0.4722 | 2.38 | 0.6340 | 2.36 | 0.4827 | 0.2298 |
| 4-3 | 2.22 | 0.5922 | 1.64 | 0.3049 | 2.14 | 0.9989 | 0.2371 |
| 7 mm | 7-6 | 2.04 | 1.1480 | 1.7 | 0.8093 | 1.84 | 1.3069 | 0.1120 |
| 6-5 | 3.46 | 0.7162 | 3.24 | 0.6655 | 3.34 | 1.2856 | 0.4751 |
| 5-4 | 2.72 | 0.8105 | 2.54 | 0.7300 | 2.6 | 0.4847 | 0.3074 |
| 4-3 | 2.4 | 0.5522 | 1.8 | 0.3807 | 2.34 | 1.1674 | 0.1423 |
| 9 mm | 7-6 | 2.52 | 1.4601 | 2.22 | 0.8105 | 2.56 | 1.2601 | 0.0467* |
| 6-5 | 4.06 | 1.0737 | 3.7 | 0.9192 | 4.06 | 1.2521 | 0.4815 |
| 5-4 | 2.82 | 1.2111 | 2.58 | 0.8074 | 2.92 | 0.5540 | 0.2502 |
| 4-3 | 2.62 | 0.6534 | 1.88 | 0.4549 | 2.48 | 1.4429 | 0.1429 |
| Left | 5 mm | 7-6 | 2.16 | 0.7469 | 1.38 | 0.3033 | 2.18 | 0.9038 | 0.3613 |
| 6-5 | 2.68 | 0.3033 | 2.44 | 0.7797 | 2.18 | 0.2167 | 0.4327 |
| 5-4 | 3.4 | 1.1247 | 2.72 | 0.5805 | 2.48 | 1.0084 | 0.3679 |
| 4-3 | 1.7 | 0.9165 | 1.4 | 0.6633 | 1.62 | 1.1432 | 0.3626 |
| 7 mm | 7-6 | 2.32 | 0.8105 | 1.52 | 0.4086 | 2.42 | 1.2173 | 0.3575 |
| 6-5 | 2.6 | 0.5612 | 2.58 | 0.8012 | 2.32 | 0.2774 | 0.3802 |
| 5-4 | 3.9 | 1.2589 | 2.98 | 0.7259 | 2.76 | 1.2934 | 0.3553 |
| 4-3 | 1.9 | 1.0392 | 1.36 | 0.7127 | 1.72 | 1.3367 | 0.2479 |
| 9 mm | 7-6 | 2.64 | 0.8414 | 1.86 | 0.7436 | 2.64 | 1.5993 | 0.3475 |
| 6-5 | 2.6 | 0.7176 | 2.62 | 0.8814 | 2.52 | 0.4711 | 0.4491 |
| 5-4 | 4.32 | 1.4184 | 3.46 | 0.8532 | 3.42 | 1.5912 | 0.3539 |
| 4-3 | 2.12 | 1.2111 | 1.82 | 0.7661 | 2.06 | 1.2953 | 0.1851 |
Test Applied: One-way ANOVA, 3-Canine, 4-First Premolar, 5-Second Premolar, 6-First Molar, 7-Second Molar
In Hypo Divergent individuals, the maxilla exhibits average inter-radicular spaces ranged from 1.7 to 4.32 mm (SD=0.9-1.41) [Table/Fig-8]. The inter-radicular space became larger from CEJ to the apex. The inter-radicular space between the first and second molars was the least, whereas between the second premolar and the first molar was the greatest. The inter-radicular space between the second premolar and the first molar was 3.14 to 4.32 mm.
In mandible, the average inter-radicular spaces were 1.66 to 4.5 mm (SD=0.55-1.05) [Table/Fig-7]. As in the maxilla, inter-radicular spaces also showed a trend to increase from the CEJ to the apex. In general, inter-radicular spaces of the mandible were larger than those of the maxilla, except for the areas between the canine and the first premolar. The mandibular inter-radicular space between the first and second molars was the largest. In addition, most mandibular inter-radicular spaces were close to 3 mm or greater.
In Hyper Divergent individuals, the average maxillary inter-radicular spaces ranged from 1.62 to 4.06 mm (SD=1.15-1.25) [Table/Fig-8]. The inter-radicular space between second premolar and first molar was the greatest and it ranged from 2.48 to 4.06 mm whereas, the inter-radicular space between the first and second molars was the least.
In mandible, average inter-radicular spaces were 1.52 to 4.32 mm (SD=0.76-1.18) [Table/Fig-7]. It also showed a pattern of increase from the CEJ to apex. Between canine and first premolar, the inter-radicular spaces were greatest whereas between first and the second molar, it was the least. Most mandibular inter-radicular spaces were close to 3 mm or greater.
In Individuals with Normal Growth Pattern, the maxillary average inter-radicular spaces were 1.36 to 3.7 mm (SD=0.71-0.91) [Table/Fig-8]. The greatest space was seen between second premolar and the first molar region, it ranged from 2.44 to 3.7 mm and the least was observed between first molar and the second molar. In mandible, average inter-radicular spaces were 1.86 to 3.4 mm (SD=0.71-0.63) [Table/Fig-7].
Hence, the study concludes that no statistical significant differences were seen in inter-radicular spaces in any facial growth pattern subjects when compared with each other except some area in maxillary and mandibular arch.
Discussion
The objective of the present study was to evaluate the required adequate thickness of cortical bone and inter-radicular distance in both the jaws for the placement of mini-implants using 3-DVT. The study showed no major differences in the cortical bone thickness of the hypo divergent individuals when compared to normal. Same results were found by Tsunori M et al., and by Turkyilmaz I et al., that the cortical bone thickness is associated with the facial type [7,13]. They found that the cortical bone thickness of the first and second molar section was thicker in short face subjects than the average and long face subjects. In our study the results showed the cortices of hypo divergent subjects were 1.16 to 2.82 mm thicker, depending on the site and jaw. The differences in cortical bone thickness identified for the mandible substantiate the findings of Tsunori M et al., and Masumoto T et al., who showed that cortical bone in the mandibles of Japanese and Asiatic Indian dry skulls was 0.10 to 2.50 mm thicker in hypo than hyper divergent individuals [7,8]. The cortical bone thickness at some sites of hyper divergent subjects was less than 0.8 to 0.9 mm, which holds implications in terms of mini-implant stability. It has been suggested that mini-implant stability success depends on placing the mini-implant in at least 1 mm of cortical bone [14].
In our study, cortical bone was found to be thicker in the posterior region than in anterior region in both the jaws and greater in mandibular arch than maxillary arch. In 2002, Park H-S et al., found the same results, thickness of the cortical bone in the mandibular arch proved better than the maxillary arch for mini-implant placement [10]. The posterior teeth area has thicker cortical bone than the anterior teeth area. These results demonstrate that the alveolar bone at the anterior teeth area is unsuitable as a location for mini-implants. In case of placement of mini-implants in the anterior teeth area, the basal bone might be a good site. The cortical bone of the posterior teeth area is considered the best site for the placement of mini-implant [15].
Cortical bone thickness is site dependent and it increases as the distance from the alveolar bone increases. In the present study, it was found that the cortical bone thickness had a tendency to increase from CEJ to apex. Park J et al., in 2009 reported a similar outcome. In both jaws, buccal cortical bone thickness tends to increase from the CEJ to the apex [16]. In the present study, the cortical bone thickness of mandibular arch was thicker than that of the maxillary arch.
For all facial growth patterns, the safest zone in the inter-radicular space of the posterior maxilla was the space between the second premolar and the first molar at all heights. Mandibular posterior region in the jaw has the safest zones situated, seen between the second premolars and first molar and between the first and second molars. These zones were found to be fairly similar in the previous studies in which the inter-radicular spaces were assessed [2,4,7].
In the present study, available inter-radicular space for mini-screw implant placement in the maxilla greater than 3 mm was found at 5 mm, 7 mm and 9 mm height in hypo divergent, at 7 mm and 9 mm height in hyper divergent and at 5 mm, 7 mm and 9 mm height in normal facial growth pattern individuals between second premolar and first molar. Mean inter-radicular distances were from 1.7 to 4.32 mm in the maxilla and 1.6 to 4.5 mm in the mandible in hypo divergent individuals. In hyper divergent individuals, in maxilla it was 1.62 to 4.06 mm and in mandible 1.52 to 4.32 mm and in normal facial growth pattern individuals, in maxilla 1.36 to 3.7 mm and in mandible 1.86 to 3.4 mm.
Therefore, in general, it is recommended to place mini-implants at 5 mm or more apically from the CEJ. Clinically, assuming that the sulcus depth is 1 mm and the junctional epithelium is 1 mm, the location of 5 mm apical from the CEJ can be found by going down 7 mm apically from the buccal gingival margin.
Limitation
The sample size of the present study was small hence, further studies should be conducted with a larger sample size and a more accurate patient selection criterion should be considered for the more precise and adequate placement of mini-implant using the method given in this study.
Conclusion
Cortical bone thickness at 5 mm, 7 mm and 9 mm height from the CEJ in most sites of the maxilla and mandible was thicker in hypo- than hyper and normal facial growth pattern subjects. Cortical bone thickness in the maxilla and mandible increases from anterior to posterior and mandibular cortical bone is thicker than maxillary cortical bone in all the three facial growth pattern subjects. No significant differences were seen in inter-radicular spaces in any facial growth pattern when compared with each other except for some areas in maxillary and mandibular arches. There was a significant change in the cortical bone thickness in maxilla but it was noticed that the cortical bone thickness was reduced in vertical growth pattern and was increased in horizontal growth pattern subjects. The present study depicts adequate recommendations for the placement of mini implants, whereas, it also highlights the area and height at which a micro implant can be placed.
Future Recommendations
Similar study can be carried in more number of subjects to evaluate the safe placement of mini-implants in anterior regions of the jaws.
[1]. Egolf RJ, BeGole EA, Harry S, Upshaw. Factors associated with orthodontic patient compliance with intraoral elastic and headgear wearAJODO 1990 97(4):336-48.10.1016/0889-5406(90)70106-M [Google Scholar] [CrossRef]
[2]. Bobak V, Christiansen RL, Hollister SJ, Kohn DH, Stress-related molar responses to the transpalatal arch: A finite element analysisAJODO 1997 112(5):512-18.10.1016/S0889-5406(97)90100-1 [Google Scholar] [CrossRef]
[3]. Thiruvenkatachari B, Pavithranand A, Rajasigamani K, Kyungd HM, Comparison and measurement of the amount of anchorage loss of the molars with and without the use of implant anchorage during canine retractionAJODO 2006 129:551-54.10.1016/j.ajodo.2005.12.01416627183 [Google Scholar] [CrossRef] [PubMed]
[4]. Miyawaki S, Koyama I, Inoue M, Mishima K, Sugahara T, Takano-Yamamoto T, Factors associated with the stability of titanium screws placed in the posterior region for orthodontic anchorageAJODO 2003 124:373-78.10.1016/S0889-5406(03)00565-1 [Google Scholar] [CrossRef]
[5]. Huja SS, Litsky AS, Beck FM, Johnson KA, Larsen PE, Pull-out strength of monocortical screws placed in the maxillae and mandibles of dogsAJODO 2005 127:307-13.10.1016/j.ajodo.2003.12.02315775945 [Google Scholar] [CrossRef] [PubMed]
[6]. Kiliaridis S, Mejersjo C, Thilander B, Muscle function and craniofacial morphology: a clinical study in patients with myotonic dystrophyEuropean Journal of Orthodontics 1989 11(2):131-38.10.1093/oxfordjournals.ejo.a0359752767145 [Google Scholar] [CrossRef] [PubMed]
[7]. Tsunori M, Mashita M, Kasai K, Relationship between facial types and tooth and bone characteristics of the mandible obtained by CT scanningAngle Orthodontics 1998 68(6):557-62. [Google Scholar]
[8]. Masumoto T, Hayashi I, Kawamura A, Tanaka K, Kasai K, Relationship among facial types, buccolingual molar inclination and cortical bone thickness of the mandibleEuropean Journal of Orthodontics 2001 23:15-23.10.1093/ejo/23.1.1511296507 [Google Scholar] [CrossRef] [PubMed]
[9]. Schnelle MA, Beck FM, Jaynes RM, Huja SS, A radiographic evaluation of the availability of bone for placement of miniscrewsAngle Orthod 2004 74:832-37. [Google Scholar]
[10]. Park HS, An anatomical study using CT images for the implantation of micro-implantsKorea J Orthod 2002 32(6):435-41. [Google Scholar]
[11]. Cederlund A, Kalkeand M, Welander U, Volumetric tomography - a new tomographic technique for panoramic unitsDentomaxillofacial Radiology 2009 38:104-11.10.1259/dmfr/1657793319176653 [Google Scholar] [CrossRef] [PubMed]
[12]. Tweed CH, The Frankfort-mandibular plane angle in orthodontic diagnosis, classification, treatment planning and prognosisAmerican J of Ortho and Oral Surgery 1946 32:175-230.10.1016/0096-6347(46)90001-4 [Google Scholar] [CrossRef]
[13]. Turkyilmaz I, McGlumphy EA, Influence of bone density on implant stability parameters and implant success: a retrospective clinical studyBMC Oral Health 2008 8:3210.1186/1472-6831-8-3219025637 [Google Scholar] [CrossRef] [PubMed]
[14]. Motoyoshi M, Inaba M, Ono A, Ueno S, Shimizu N, The effect of cortical bone thickness on the stability of orthodontic mini-implants and on the stress distribution in surrounding boneIJOMS 2009 38:13-18.10.1016/j.ijom.2008.09.00618963818 [Google Scholar] [CrossRef] [PubMed]
[15]. Kuroda S, Yamada K, Deguchi T, Hashimoto T, Kyung HM, Takano-Yamamoto T, Root proximity is a major factor for screw failure in orthodontic anchorageAJODO 2007 131:S68-S73.10.1016/j.ajodo.2006.06.01717448389 [Google Scholar] [CrossRef] [PubMed]
[16]. Park J, Cho HJ, Three-dimensional evaluation of interradicular spaces and cortical bone thickness for the placement and initial stability of micro implants in adultsAJODO 2009 136:314.e1-314.e12.10.1016/j.ajodo.2009.01.02319732658 [Google Scholar] [CrossRef] [PubMed]