The human brain consists of wide range of neurons and its complex axon arrangement makes it one of the most complex structures in our body. MRI is one of the safest and easiest of all imaging methods to non-invasively image of the entire brain in-vivo. Conventional MRI cannot image the complex axonal structure organisation of the brain which is very well demonstrated by DTI which was introduced in the mid 1990’s and followed by many experimental animal studies and now used very routinely in clinical practice [1]. Fractional Anisotropy (FA) value is used to express water diffusion in vivo occurring in varied directions which is one of the scalar derivatives of diffusion tensor imaging. The data obtained using diffusion tensor are the basis for calculating Eigen vectors or Eigen values. For quantification of anisotropy many parameters are thus used which are derived from Eigen vectors. Currently FA is the best technique to measure diffusion anisotropy and used widely for fibre tracking [2,3].
FA values have no specific units and it ranges between 0 and 1. A greater degree of anisotropic motion will reflect in high FA values. FA values also depend upon the number of diffusion weighting directions [4]. The other factors which affect FA values are b-value and Time of Echo (TE). As b-value decreases, FA decreases and as TE increases, FA increases [5]. TE and b-value are the two parameters which quantitatively affect FA values among other factors like diffusion weighting direction and the strength of the MRI [6]. FA values can be used to monitor, treat and for follow-up of cases with neurological abnormalities. Clinical studies have proved FA values to be a concrete index for white matter abnormalities in ageing [7] and neurological disorders [8]. Thus, a normative chart of FA values in different age groups will be helpful in staging and treating complex neurological abnormalities [9,10]. This study has tried to find the consistency of FA values using different combinations of b-value and TE as these two parameters quantitatively affect FA values. The main purpose of this study was to find a fixed setting of b-value and TE while using DTI medium sequence with 15 diffusion weighting directions in getting consistent FA values. As this fixed combination of b-value and TE can be used across all 1.5 T magnets to calculate FA values in different regions of brain white matter and can be used for early diagnosis of neuro degenerative abnormalities. The chosen white matter regions of the brain in this study includes the corpus callosum, centrum semiovale and the pons [9-11].
Materials and Methods
Study Design
A cross-sectional study was performed using 1.5 T (Philips MRI Achieva, class IIA series, 16 channel system), DTI of brain white matter. The duration of the current study was approximately 11 months from September 2016 to August 2017. The participants were selected after the required criteria were met and scanned at Shirdi MRI scan centre in the Department of Radio diagnosis and Imaging, Kasturba Medical College and Hospital, MAHE, Manipal, Karnataka, India. Ethical approval was obtained from Institutional Ethical Committee and Hospital Ethical Committee (IEC). The extended brilliance workstation was used for image analysis and post processing of diffusion tensor images to calculate FA values using Region Of Interest (ROI) technique.
Sample Size
A sample size of 23 participants was employed with 5% level of significance and standard deviation of 0.073 in six different combinations of b-value and TE using DTI protocol. Based on previous literature, the standard deviation was found to be 0.073 [12].
Participants Recruitment
Participants who were willing to participate in the study after detailed explanation of the study by the principal investigator were included. The present study included 23 healthy participants without any neurological brain abnormalities (13 males and 10 females) in the age group of 18-28 years. Written consent was obtained from all the participants of the study. Participants detected with structural brain abnormalities and space occupying lesions seen on conventional MR brain imaging sequence were excluded. We also excluded participants who were absolutely contraindicated for MRI.
Imaging Protocol
A DTI sequence was acquired using a slice thickness of 2 mm with echo planar imaging single shot imaging sequence. The number of diffusion weighting directions used was 15. The entire brain was included during MRI image acquisition. A routine FLAIR axial and T1 sagittal sequence was also acquired for anatomy correlation while computing FA values.
Procedure for Data Collection
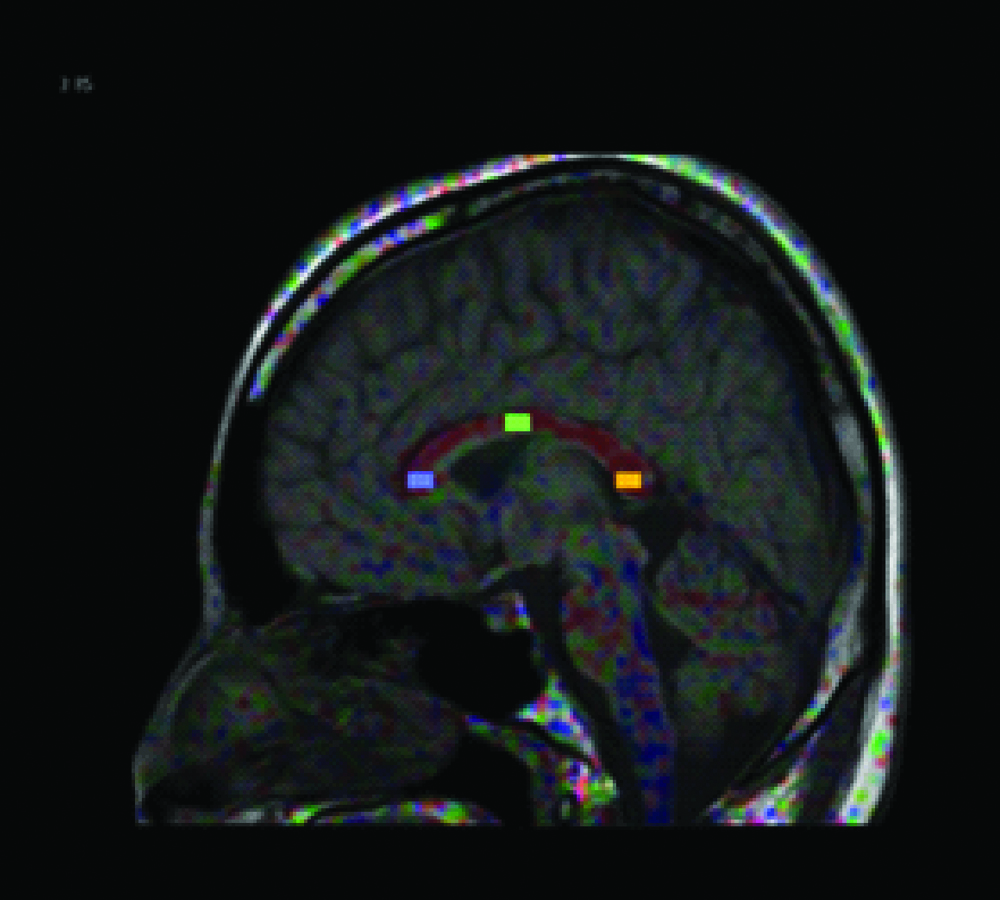
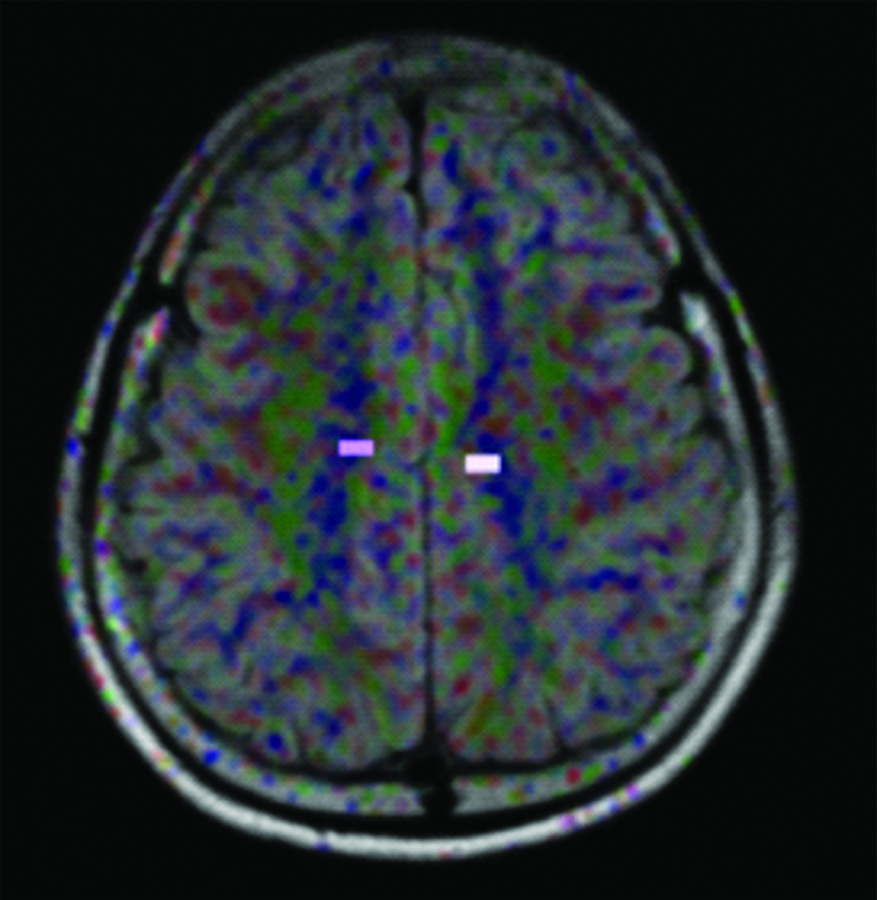
To find the effects of b-value and TE on FA values in DTI; three different sets of b-values (800,1000 and 1200) with a fixed TE of 100 and another three sets of TE (90,110 and 120) with fixed b-value of 1000 was selected and FA values were measured on the above said regions of the brain white matter. An oral interview for history was conducted on all the participants. A double check confirmation was made to rule out neurological abnormalities by a routine MR brain imaging sequence FLAIR axial. For corpus callosum the sagittal section was chosen to obtain FA values while the axial section was used for both centrum semiovale and pons. ROI placements for the brain matter regions studied are depicted in [Table/Fig-1,2 and 3].
ROI placement at the corpus callosum.
ROI placement at the right and left centrum semiovale.
ROI placement at the right and left pons.
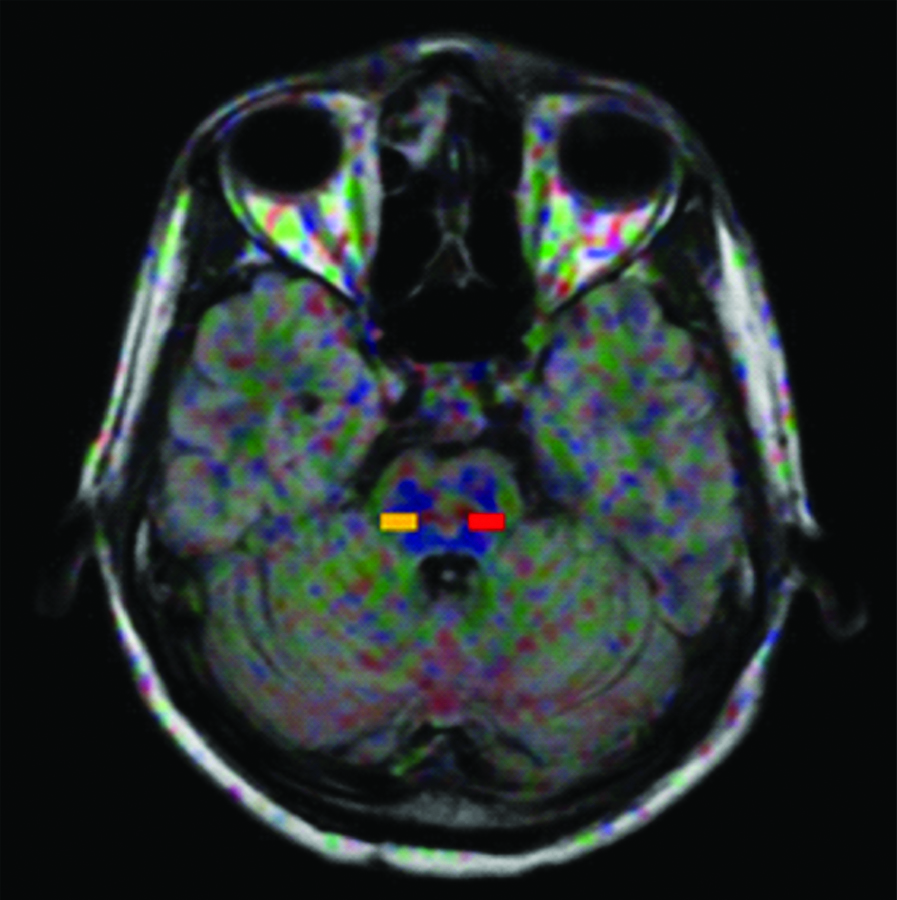
Image Analysis and Post-Processing
The DTI image analysis was done on the Philips extended workstation using the fibre track analysis software. The DTI image sets were loaded along with sequence FLAIR axial and T1 Sagittal images for anatomy correlation to visualise and calculate FA values. Fibre tracking analysis software was used to estimate FA values using a rectangular ROI with eight voxel size at the following white matter regions of the brain: corpus callosum (three regions namely genu, body and splenium), centrum semiovale (two regions namely left and right), and pons (two regions namely left and right).
Statistical Analysis
The mean and standard deviation were calculated for each individual combination and the corresponding brain white matter regions. The reliability of FA values for fixed values of b-value and TE was determined by commuting Coefficient of Variation (CV). Statistical analysis was performed on SPSS version 20.0. CV (Coefficient of Variation)=Standard deviation/Mean×100. The trace analysis and variance co-variance matrices were also calculated. Inter-hemispheric differences were ruled out using paired t-test.
Results
A total number of 23 participants with mean age 22.04 years±4.96 including 13 males and 10 females were studied. [Table/Fig-4] depicts analysis of CV with fixed b-value of 1000 s/mm2 and TE of 90,110 and 120 respectively. Eight voxel analysis using rectangular ROI showed the least CV of 8.628% in the splenium of the corpus callosum using b=1000 and TE=90 and also showed CV was increasing with increased TE when b-value was 1000 in the splenium and left centrum semiovale showed comparatively low CV using b=1000 as constant and TE of 90, 110 and 120 respectively. Overall the combination of b=1000 s/mm2 as constant and TE at 90 ms,110 ms and 120 ms respectively did not show good consistency of FA values in corpus callosum, centrum semiovale and pons. [Table/Fig-5] depicts analysis of coefficient of variation with fixed TE of 100 and b-value of 800, 1000 and 1200 s/mm2 respectively. The least CV of 7.147% in the splenium of the corpus callosum was found using b=1000 and TE=100. Overall combination of b=1000 s/mm2 and TE=100 showed least variance except for pons and showed very good consistency of FA values in corpus callosum and centrum semiovale.
Analysis of coefficient of variation with fixed b-value of 1000 s/mm2 and TE of 90,110 and 120.
| White Matter region | b=1000, TE=90 | b=1000, TE=110 | b=1000, TE=120 |
|---|
| CV % | CV % | CV % |
|---|
| Genu of corpus callosum | 20.565 | 18.538 | 26.927 |
| Body of corpus callosum | 14.202 | 19.556 | 16.012 |
| Splenium of corpus callosum | 8.628 | 9.739 | 10.384 |
| Centrum semiovale right | 15.488 | 12.522 | 15.865 |
| Centrum semiovale left | 12.987 | 13.384 | 11.257 |
| Pons right | 19.616 | 18.127 | 19.082 |
| Pons left | 13.051 | 16.677 | 13.069 |
Analysis of coefficient of variation with fixed TE of 100 and b-value of 800, 1000 and 1200 s/mm2.
| White Matter region | b=800, TE=100 | b=1000, TE=100 | b=1200, TE=100 |
|---|
| CV % | CV % | CV % |
|---|
| Genu of corpus callosum | 11.155 | 10.018 | 12.082 |
| Body of corpus callosum | 13.598 | 12.962 | 14.891 |
| Splenium of corpus callosum | 20.723 | 7.147 | 7.445 |
| Centrum semiovale right | 16.122 | 12.401 | 17.092 |
| Centrum semiovale left | 15.216 | 11.224 | 13.425 |
| Pons right | 23.978 | 13.276 | 12.432 |
| Pons left | 22.008 | 14.212 | 15.898 |
If we compare the six different combinations of b-value and TE to find consistent FA values, we observed the least CV difference with combination of b-value 1000 and TE-100 ms where CV range was between 7.147% to 14.212% respectively. Coming FA values in different regions of brain white matter we found that least and highest FA values varied among different combinations of b-value and TE.
[Table/Fig-6] depicts the variance co-variance matrix analysis where the variances of the overall anatomical regions of the brain for each of the six protocols were calculated. We found that b=1000 and TE=100 had the least overall variance of 0.0379. The best combination for FA is b=1000 and TE=100 as coefficient of variance is least for 5 regions except for pons. [Table/Fig-7] depicts interhemispheric differences calculated using paired t-test to rule out differences between pons and centrum semiovale. α/12=.05/12=0.0042 was set as the level of significance. There were no statistically significant differences found in right and left hemispheres of the centrum semiovale and pons respectively.
Variance co-variance matrix analysis.
| Regions of the brain white matter | b-value & TE combination | Overall variance |
|---|
| Genu of corpus callosum | b-1000, TE-90 | 0.062119 |
| Body of corpus callosum | b-1000, TE-110 | 0.068193 |
| Splenium of corpus callosum | b-1000, TE-120 | 0.074329 |
| Centrum semiovale right | b-800, TE-100 | 0.088761 |
| Centrum semiovale left | b-1000, TE-100 | 0.037988 |
| Pons rightPons left | b-1200, TE-100 | 0.050079 |
Interhemispheric differences in centrum semiovale and pons.
| Protocol combination | Centrum Semiovale (Right and Left) | Pons (Right and Left) |
|---|
| b=1000, TE=90 | 0.769 | 0.79 |
| b=1000, TE=110 | 0.548 | 0.510 |
| b=1000, TE=120 | 0.398 | 0.187 |
| b=800, TE=100 | 0.136 | 0.267 |
| b=1000, TE=100 | 0.017 | 0.230 |
| b=1200, TE=100 | 0.432 | 0.945 |
Discussion
This study has tried to find the consistency of FA values using different combinations of b-value and TE as these two parameters quantitatively affect FA values. The main purpose of this study was to find a fixed setting of b-value and TE while using DTI medium sequence with 15 diffusion weighting directions in getting consistent FA values. As this fixed combination of b-value and TE can be used across all 1.5 T magnets to calculate FA values in different regions of brain white matter and can be used for early diagnosis of neuro degenerative abnormalities. Strengths of the current study includes the use of a sample size of 23 healthy participants and a fixed ROI size of 8 voxel size which were some of the limitations reported in literature [9,13]. Chou MC et al., studied the effects of b-value and TE on FA at 1.5 T MRI scan and they had also used five different combinations of b-value and TE to check the reproducibility and accuracy of the above mentioned matrices in both grey and white matter with the participation of only one 26-year-old volunteer which was the limitation of their study [5]. Current study was conducted on the normal brain white matter of the corpus callosum (genu, body and splenium), centrum semiovale and pons. Current study used six different combinations of b-value and TE on 23 healthy participants by keeping b-value fixed at 1000 and varying TE at 90, 110 and 120 respectively and TE fixed at 100 ms and varying b-value at 800, 1000 and 1200 respectively.
Comparison of FA values in different regions of brain white matter studied in the current study is in line with studies conducted by Lee CEC et al., Huisman TAGM et al., Hunsche S et al., and Snook L et al., as shown in [Table/Fig-8] [14-17]. FA at the genu of the corpus callosum in the current study of 0.649 showed slight variation while similar studies have shown variation from 0.806, 0.79 to 0.80 and 0.78 respectively as shown in [Table/Fig-8] [9,14-17]. FA obtained at the splenium of the corpus callosum of 0.759 is in line with previous studies reported in literature [14-17]. Similarly, FA at the body of the corpus callosum of 0.705, right centrum semiovale of 0.566, left centrum semiovale of 0.628, right pons of 0.563 and left pons of 0.587 was also found. To comment on b=1000 and TE=100 combination in the current study is in line with studies conducted by Brander A et al., Lee CEC et al., b=1000 and TE=86; Huisman TAGM et al., b=1000 and TE=91; Hunsche S et al., and Snook L et al., b=1000 and TE=88; and as shown in [Table/Fig-8] [9,14-17].
Comparison of the fractional anisotropy values of the present study with previous studies [9,14-17].
| Brain region | Current study n=23 b-1000&TE-100 ms | Brander A et al., [9] | Lee CEC et al., [14] 3 T n=19 | Huisman TAGM et al., [15] 3 T n=12 | Hunsche S et al., [16] 3 T n=7 | Huisman TAGM et al., [15] 1.5 T | Hunsche S et al., [16] 1.5 T | Snook L et al., [17] 1.5 T |
|---|
| Optic radiation | | | 0.495±0.045 | | 0.51±0.05 | | 0.47±0.007 | |
| Ant limb of internal capsule | | | 0.454±0.030 | | | | | 0.66±0.05 |
| Post limb of internal capsule | | | 0.714±0.049 | 0.722±0.024 | | 0.681±0.031 | | 0.70±0.03 |
| Genu of C.C | 0.649±0.187 | 0.840 | 0.806±0.065 | | 0.80±0.08 | | 0.79±0.06 | 0.78±0.03 |
| Body of C.C | 0.705±0.134 | 0.643 | | | | | | |
| Splenium of C.C | 0.759±0.120 | 0.857 | 0.775±0.052 | 0.800±0.034 | 0.77±0.07 | 0.764±0.021 | 0.75±0.08 | 0.81±0.03 |
| Putamen | | | 0.121±0.028 | | | | | 0.17±0.02 |
| Globus pallidus | | | 0.233±0.045 | | | | | 0.28±0.04 |
| Thalamus | | | 0.279±0.020 | 0.330±0.072 | 0.40±0.003 | 0.296±0.062 | 0.37±0.03 | 0.33±0.03 |
| Corona radiata | | | 0.530±0.069 | | | | | 0.62±0.04 |
| Right Centrum Semiovale | 0.566±0.120 | 0.488 | | | | | | 0.44±0.05 |
| Left Centrum semiovale | 0.628±0.132 | 0.484 | | | | | | 0.47±0.05 |
| Right Pons | 0.563±0.162 | 0.594 | | | | | | |
| Left pons | 0.587±0.152 | 0.611 | | | | | | |
If we compare overall, FA values in various white matter regions of the corpus callosum, centrum semiovale and pons we found varying results. FA in the genu of the corpus callosum decreases as both b-value and TE increases. FA in the body of the corpus callosum also decreases as b-value and TE increases. FA in the splenium of the corpus callosum slightly increases as b-value and TE increases. FA in the right part of the centrum semiovale remains almost constant as b-value increases but increases as TE increases. FA in the left part of the centrum semiovale decreases as b-value and TE increases. FA in the right part of the pons increases as b-value and TE increases. And finally, FA in the left part of the pons increases as b-value and TE increases.
Using the b-value of 100 and TE of 100 ms; current study showed lower coefficient of variation in the genu of the corpus callosum of 10.018%; body of the corpus callosum of 12.962%; centrum semiovale right of 12.401%; centrum semiovale left of 11.2241% and right pons of 13.276%. Overall combination of b=1000s/mm2 and TE of 100 ms showed least variance except for pons and showed very good consistency of FA values in corpus callosum and centrum semiovale.
Limitation
There are three limitations in our study, firstly the healthy participants included in our study were in the age group of only 18-30 years, thus consistency of FA values in older age groups were not studied. Secondly DTI medium sequence with 32 weighting directions were not compared for consistency of FA values. Thirdly, the present study tested only the consistency and found the best protocol for FA value imaging in the brain white matter and did not present a normative chart of FA values.
Conclusion
The current study investigated the consistency of FA values using different b-value and TE combinations obtained at 1.5 T MRI scanner and the combination of b-1000 and TE-100 showed the most consistent FA values with least variation in the corpus callosum, centrum semiovale except pons and also established a standardised protocol for calculating FA values in different regions of normal brain white matter.