Malnutrition is a most common nutritional disorder in the developing countries and it remains as one of the most common causes of morbidity and mortality among preschool children worldwide [1]. It is often an invisible problem [2]. The effect of under-nutrition on young children can delay physical growth and motor development [1]. It jeopardizes children’s survival, health, growth, and development, and it slows national progress towards development goals [2]. Malnutrition in early childhood has serious, long-term consequences; greater risk of disease, and early death [1].
An estimated 45% of deaths of under-five children are linked to malnutrition in 2013 [3]. UNICEF-WHO-The World Bank Joint Child Malnutrition estimates globally 159 million (23.8%) under-five children are stunting and 66 million (9.9%) wasting (Joint Child Malnutrition 2015). In 2015, stunting prevalence globally declined from 39.6% to 23.8%. Out of every four stunted children and half of all wasted children lived in South Asia [4]. UNICEF-WHO-The World Bank Joint Child Malnutrition again estimated the status of malnutrition in 2016. It was reported that slight stunting rates are dropping but still 156 million children under-five are stunted around the world. Wasting continued to threaten the lives of 50 million children under-five globally [5].
The WHO estimates that the malnutrition accounts for 54% of child mortality worldwide, i.e., about one million children. Another estimate by WHO states that the childhood underweight is the cause for about 35% of all deaths of children under the age of five years, worldwide. Asia bears the greatest share of all forms of malnutrition. In 2015, more than half of all stunted and more than two-third wasted children under-five live in Asia. It means that the majority of children under-five suffering from wasting live in Asia [4].
Despite global efforts for improving maternal and child health and specific efforts like Integrated Child Development Services (ICDS), the malnutrition among children remains a significant problem in India [6]. More than one-third of the world’s children who are wasted live in India and 20% of children under-five years of age suffer from wasting due to acute undernutrition. A 43% of children under-five years are underweight and 48% (61 million) are stunted due to chronic undernutrition. India accounts for more than three out of every 10 stunted children in the world. Undernutrition is substantially higher in rural areas than in the urban [7]. There is a wide disparity in the prevalence of under nutrition of children among the states of India, ranging from high (Madhya Pradesh-55%) to relatively low (Tamil Nadu-25%) [8].
National Family Health Survey-4 (NFHS-4, 2015-16) reported that the prevalence of underweight, stunting, and wasted among under-five is 36%, 38%, and 28.5%, respectively at the national level [8] and 31.5%, 32.6%, 24.8%, and 9.7%, respectively, in Karnataka State. The disparity in prevalence of malnutrition is also noted in Karnataka [9]. A study conducted in rural Bengaluru reported that 70% of children under five are malnourished [10]. Prevalence of underweight is 37% among under-five children using the WHO growth standards reported in a study done in Belgaum [11]. A cross-sectional study from Udupi district reported that 15% of children between 1-3 years are underweight and the prevalence of underweight among the children aged between two and five years is 46% [12,13]. District Family Health Survey-4 (DFHS-4, 2015-16) reported that the prevalence of underweight among under-five children in Udupi district is 22.3%, Bagalakot 45%, and Raichur 41%. Even though several nutritional programs are implemented and existing in Karnataka and India, the problem of under-nutrition among children has not changed significantly [14].
Hence, we aimed at performing a systematic review and meta-analysis to arrive at pooled estimates of malnutrition among the children in Karnataka.
Materials and Methods
This is a review and meta-analysis done between October 2016 and December 31, 2016. An extensive literature search of International and National electronic databases including PubMed, CINHAL, Scopus, Clinical key, Indmed, J gate and Google scholar was carried out in the Karnataka [Table/Fig-1]. Combinations of medical subject headings (MESH) and free text words that included the search terms related to the exposure (e.g., malnutrition, under- nutrition, underweight, nutritional status, thinness, child nutrition) were combined with the search terms related to the subjects (e.g., children, preschool children, under-five, Anganawadi children, preschooler) and the outcomes (e.g., prevalence, epidemiology, survey). Identified the articles eligible for further review by performing an initial screen of the identified titles or abstracts, and followed by a full-text review. The complete details on the search terms used in Medline have been included.
PRISMA chart of selection of studies.

Selection criteria and data extraction: The criteria used for the search were limited to descriptive studies, cross-sectional studies, and epidemiological studies conducted among children less than six years; the studies were on prevalence, assessment, epidemiology of malnutrition, underweight, nutritional status and under-nutrition. The articles/papers selected for the studies conducted at community or Anganawadi centres among children below six-year age group were in English language. The articles were excluded if they were abstracts, conference proceedings, reviews, and meta-analysis; not conducted on humans.
Study selection: Two independent reviewers (reviewer I and reviewer II) screened the titles and abstracts of the initially identified studies to determine whether they would satisfy the selection criteria. The disagreements on the selection were resolved with discussion. The full-text articles were retrieved for the selected titles.
Reference lists of the retrieved articles were searched for additional publications. Both the authors assessed again the retrieved studies independently to ensure that they satisfied the inclusion criteria.
Study quality: Strengthening the Reporting of Observational Studies in Epidemiology (STROBE) guidelines were used to assess the quality of the selected articles [15] [Table/Fig-2]. Quality scores were defined based on the presence of eligibility criterion, sources and methods of selection of participants, reported numbers of outcome events or summary measures, and mentioned limitations of the study. The 24 studies, which met the eligibility criteria, were included for meta-analysis and two studies that did not meet the quality scores were excluded.
| Sl. No | STROBE item | % of studies met the criteria |
|---|
| 1 | Indicate the study’s design with a commonly used term in the title or the abstract | 79.16 |
| 2 | Provide in the abstract an informative and balanced summary of what was done and what was found | 95.83 |
| 3 | Explain the scientific background and rationale for the investigation being reported | 100 |
| 4 | State specific objectives, including any pre-specified hypotheses | 100 |
| 5 | Present key elements of study design early in the paper | 100 |
| 6 | Describe the setting, locations, and relevant dates, including periods of recruitment, exposure, follow-up, and data collection | 100 |
| 7 | Give the eligibility criteria, and the sources and methods of selection of participants | 87.5 |
| 8 | Clearly define all outcomes, exposures, predictors, potential confounders, and effect modifiers. Give diagnostic criteria, if applicable | 91.66 |
| 9 | For each variable of interest, give sources of data and details of methods of assessment (measurement). Describe comparability of assessment methods if there is more than one group | 100 |
| 10 | Describe any efforts to address potential sources of bias | 62.5 |
| 11 | Explain how the study size was arrived at | 45.83 |
| 12 | Explain how quantitative variables were handled in the analyses. | 100 |
| 13 | Describe all statistical methods, including those used to control for confounding | 87.50 |
| 14 | Describe any methods used to examine subgroups and interactions | 100 |
| 15 | Explain how missing data were addressed | 41.66 |
| 16 | Describe analytical methods taking account of sampling strategy | 58.33 |
| 17 | Describe any sensitivity analyses | 8.33 |
| 18 | Report numbers of individuals at each stage of study | 100 |
| 19 | Give reasons for non-participation at each stage | 12.5 |
| 20 | Give characteristics of study participants | 95.83 |
| 21 | Indicate number of participants with missing data for each variable of interest | 12.5 |
| 22 | Report numbers of outcome events or summary measures | 100 |
| 23 | Give unadjusted estimates and, if applicable, confounder-adjusted estimates and their precision | 12.5 |
| 24 | Report category boundaries when continuous variables were categorized | 100 |
| 25 | Report other analyses done–analyses of subgroups and interactions | 100 |
| 26 | Summaries key results with reference to study objectives | 100 |
| 27 | Discuss limitations of the study, taking into account sources of potential bias or imprecision | 20.83 |
| 28 | Give a cautious overall interpretation of results considering objectives, limitations, multiplicity of analyses, results from similar studies, and other relevant evidence | 100 |
| 29* | *Give the source of funding and the role of the funders | 0* |
Note: * Item no.29: All studies are self –funded. Since it is prevalence and cross-sectional study, all the participants were participated and included for the analyses except few studies.
Data extraction: A data extraction form was designed prior to the implementation of the search strategy. Cochrane data extraction form was used for non-experimental studies to extract the data [16]. Two independent reviewers used this form to extract the relevant information from the selected studies. The data extraction form included the questions on year of publication, design, geographic setting, selection criteria, samplings and location of research group, participant characteristics (e.g., Age range, sample size, and comorbidities), and information on the reported outcomes (e.g., measure of nutritional status, criteria/standards (WHO/IAP) used to assess the malnutrition, percentage of malnutrition, and type of statistical analysis).
Statistical Analysis
Meta-analysis was performed in Stata 13.1. Metan package was used for analysis. As we had anticipated a substantial amount of statistical heterogeneity, we adopted random effects model for meta-analysis. Heterogeneity was assessed by Chi-square statistic. We also presented the I2 statistic which quantifies the heterogeneity as a percentage. We constructed forest plot for each of the four outcomes [Table/Fig-3]. Every forest plot consists of name of the study, sample size, prevalence estimate with corresponding 95% CI, % weight, pooled estimate with 95% CI, significance of Chi-square statistic and I2 statistic. For publication bias, we performed Egger’s test, which provides the statistical significance of publication bias.
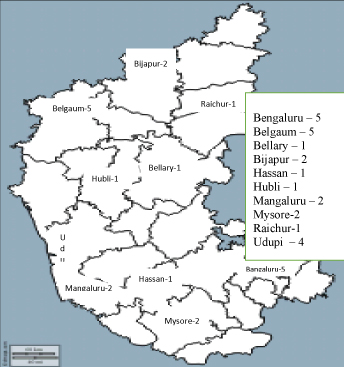
The studies reported from different regions of Karnataka.
Results
As per the inclusion criteria, 2183 abstracts were screened. Out of 28 potentially relevant full text articles 24 eligible studies (cross-sectional–21; descriptive-explorative study–1; prospective-observational study–1; epidemiological study-1) were included for the review and analysis. Out of the 24 studies, 19 studies reported the prevalence of malnutrition as per WHO new child growth standards (2006) [9-13,17-35]. And five studies reported the prevalence of malnutrition as per IAP classification [12,17,23,28,29] [Table/Fig-4].
Characteristics of studies included in the Meta analysis [9-13,17-35].
| Sl No. | Source | SampleSize | Malnutrition measuring criteria | Interpretation of malnutrition | Prevalence of malnutrition (%) |
|---|
| 1 | Chakravarthy, Soans & Hanumanth, 2015 [12] | 934 | IAP classification | Weight checking & weight for the age | 14.8 |
| 2 | Kumar, Kamath, Kamath,Rao & Pattanshetty, 2010 [23] | 585 | IAP classification | Weight checking & weight for the age | 32.3 |
| 3 | Prabhat & Malla, 2015 [13] | 200 | WHO classification | Weight checking & weight for the age | 46 |
| 4 | Imran, Sarwari, & Jaleeli, 2012 [24] | 245 | WHO classification | Weight checking & weight for the age | 47.3 |
| 5 | Mangala & Subrahmanyam, 2014 [17] | 157 | IAP classification | Weight checking & weight for the age | 42 |
| 6 | Joseph, Rebello, Kullu & Raj, 2002 [10] | 295 | WHO classification | Weight checking & weight for the age | 70 |
| 7 | Mathad, Metgud, & Mallapur, 2011[25] | 290 | WHO classification | Weight checking & weight for the age | 26.5 |
| 8 | Das, Angolkar & Shrestha,2014 [20] | 275 | WHO classification | Weight checking & weight for the age | 29.1 |
| 9 | Nayak, Walvekar, Mallapur & Katti, 2014 [11] | 933 | WHO classification | Weight checking & weight for the age | 37 |
| 10 | Kulkarni & Baliga, 2013 [26] | 1085 | WHO classification | Weight checking & weight for the age | 10.6 |
| 11 | Yadav, Angolkar, Chaudhary & Jha, 2015 [27] | 385 | WHO classification | Weight checking & weight for the age | 51 |
| 12 | Patil & Divyarani, 2015 [28] | 180 | IAP classification | Weight checking & weight for the age | 67.7 |
| 13 | Bant, 2013 [29] | 680 | IAP classification | Weight checking & weight for the age | 49.1 |
| 14 | Jawaregowda & Angadi, 2015 [18] | 236 | WHO classification | Weight checking & weight for the age | 43 |
| 15 | Biradar, 2013 [30] | 980 | WHO classification | Weight checking & weight for the age | 10.6 |
| 16 | Algur, Yadavannavar & Patil, 2012 [31] | 500 | WHO classification | Weight checking & weight for the age | 46.4 |
| 17 | Renuka, Rakesh, Babu, & Santosh, 2011[19] | 220 | WHO classification | Weight checking & weight for the age | 38.6 |
| 18 | Renuka, Jagadish, Kulkarni,Khyrunissa & Gangadha, 2014 [21] | 101 | WHO classification | Weight checking & weight for the age | 60.4 |
| 19 | Nanjunda 2014 [22] | 300 | WHO classification | Weight checking & weight for the age | 87.6 |
| 20 | NFHS -4, 2015 [9] | 7161033 | WHO classification | Weight checking & weight for the age | 35.2 |
| 21 | Brahmbhatt, Hameed, Naik,Prasanna & Jayram,2012 [32] | 171 | WHO classification | Weight checking & weight for the age | 58.4 |
| 22 | Mercy, 2012 [35] | 200 | WHO classification | Weight checking & weight for the age | 56 |
| 23 | Yellanthoor & Shah, 2014 [34] | 206 | WHO classification | Weight checking & weight for the age | 54.9 |
| 24 | Meshram et al., 2012 [33] | 14587 | WHO classification | Weight checking & weight for the age | 43 |
Prevalence of Malnutrition in Karnataka
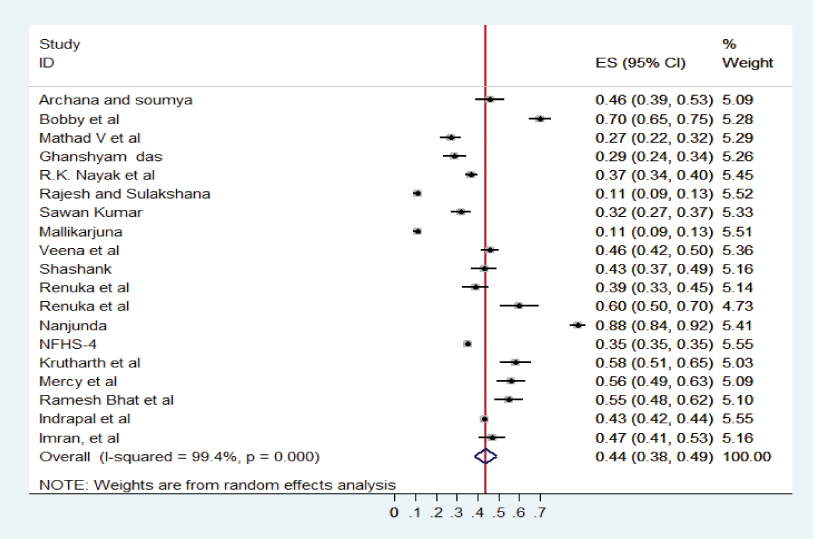
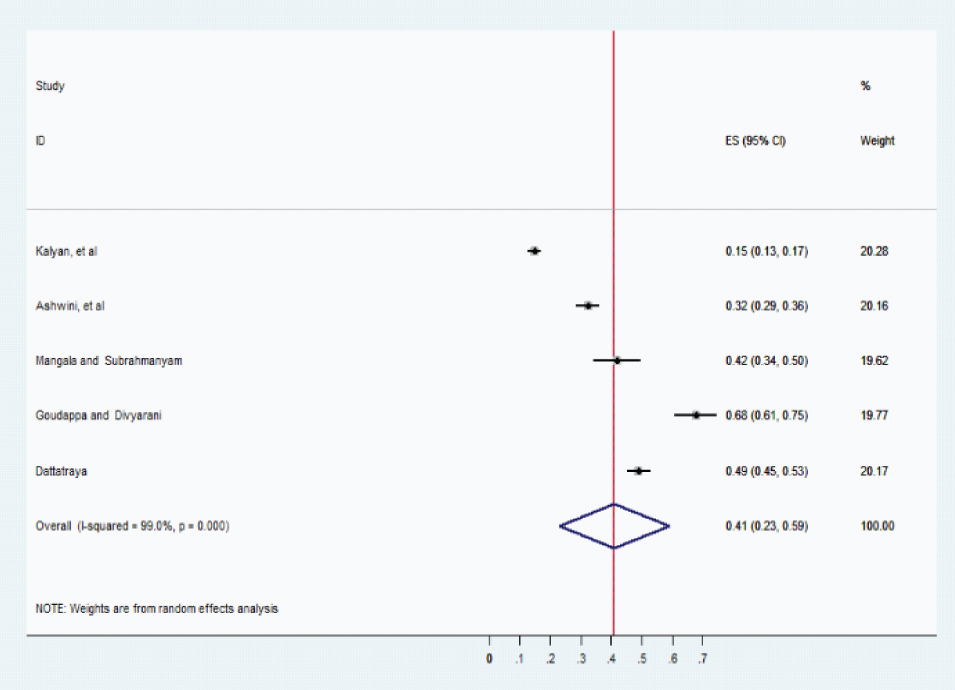
Prevalence of underweight: [Table/Fig-5] summarises the prevalence of underweight. The pooled prevalence of Underweight as per WHO child growth standard was 44% with 95% CI: 0.38–0.49; I2=99.4%, p < 0.001. [Table/Fig-6] summarises the prevalence of malnutrition. The pooled prevalence of malnutrition as per IAP classification was 41% with 95% CI (0.23-0.59).
Overall pooled estimation of underweight (WHO).
Overall pooled estimation of malnutrition (IAP).
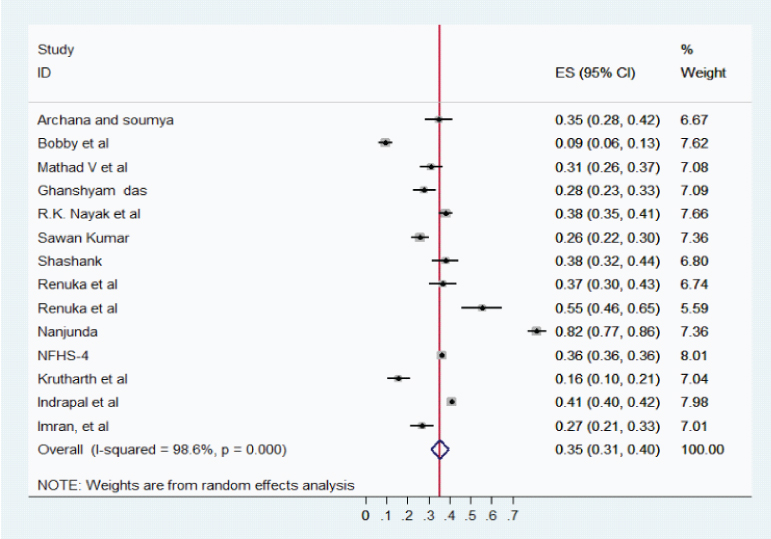
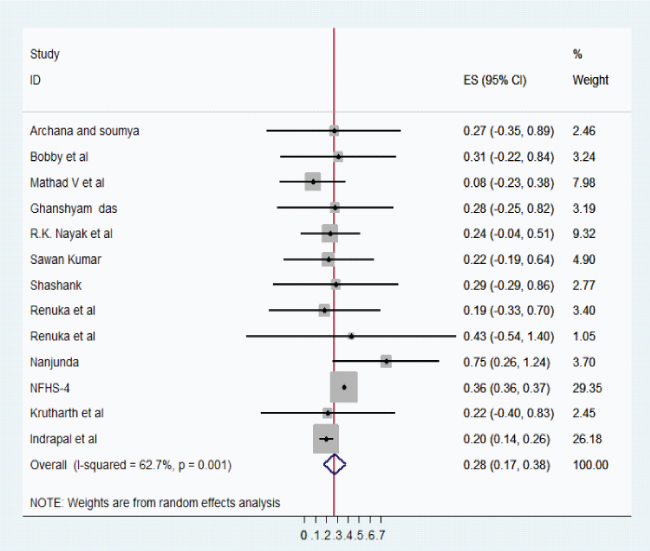
Prevalence of stunting and wasting: The pooled prevalence of stunting was 35% with 95%, CI: 0.31-0.40; I2 = 98.6%, p < 0.001 and wasting was 28% with 95%, CI: 0.17– 0.38; I2 = 62.7%, p = 0.001. [Table/Fig-7,8] summarises the prevalence of stunting and wasting.
Overall pooled estimation of stunting.
Overall pooled estimation of wasting.
To evaluate the publication bias Egger’ test was computed and presented in [Table/Fig-9]. It can be observed that, for all the four outcomes, publication bias is found to be statistically non-significant.
| Outcome | Bias (95%CI) | p-value |
|---|
| Malnutrition | 17.67 (-6.06, 41.41) | 0.1 |
| Underweight | 2.28 (-4.08, 8.64) | 0.46 |
| Stunting | 0. 12 (-5.22, 5.46) | 0.96 |
| Wasting | -7.24 (-17.13, 2.65) | 0.14 |
Discussion
This study summarised the prevalence of malnutrition in Karnataka for a 10-year period (2006-2016). In our study the pooled prevalence of underweight (as per WHO standards) was found to be 44% (95%, CI: 0.38-0.49, p <0.001). In addition, as per IAP classification the pooled prevalence of malnutrition was 41% (95%, CI: 0.23- 0.59, p<0.001). It is almost equal or a little higher percentage (44%) of prevalence of underweight as per WHO standards compared with IAP classification (41%). The pooled prevalence of underweight is higher than the current national (36%) and state (31.5%) level estimate. The pooled result is consistent with the other literature examining the prevalence of malnutrition in different parts/districts of the Karnataka state. For instance, prevalence of malnutrition in recent studies in Karnataka reported were 43% in Mangaluru, 42% in rural Bengaluru, 43% in Bijapur and 39% in Mysore [17-19,36].
In this review, we found that the pooled prevalence of stunting and wasting was 35% (95%, CI: 0.31-0.40; p < 0.001) and 28% (95%, CI: 0.17 – 0.38, p<0.001), respectively. This study finding is consistent with the current National Family Health survey report of the country and the state. The prevalence of stunting and wasting in India is 38% and 28.5% and in Karnataka 32.6% and 34.5%, respectively [9]. The findings with regard to stunting and wasting are consistent with the studies done in different parts of Karnataka. The prevalence of stunting and wasting found in the study done in Udupi is 35% and 27%, Bangaluru 29% and 31%, Belgaum 38% and 24%, another study in Belgaum 28% and 28.4%, Bijapur 38% and 29%, respectively [10,11,13,18,20]. In addition, some studies reported very high prevalence of stunting and wasting i.e. study in Mysore the prevalence of stunting and wasting is 55% and 43%, in Hassan and Kodagu 75% and 82%, respectively [19,20].
The prevalence of underweight, stunting, and wasting in Karnataka is higher than the neighboring state based on NFHS-4 survey report. The estimation of underweight, stunting, and wasting in Tamil Nadu is 24%, 27%, and 28%, in Kerala 16%, 20%, and 22% in Andhra Pradesh 31.9%, 31%, and 22%, respectively [9]. It revealed that Karnataka has a higher percentage of malnutrition than the neighboring state in South India.
Limitation
The study has some limitations which are remarkable. Our study is limited only to the selected database source and English-language publications and therefore might have missed some relevant publications. Overall, a high degree of heterogeneity was observed in the included studies. Three articles fulfilled the criteria for reporting high-quality studies. The majority of the articles lacked the limitations of their studies.
Conclusion
Our pooled results support the finding that the malnutrition in children is currently and still a health issue of high burden in Karnataka. Despite many interventional programs from Government it remains a significant problem among the children in Karnataka. An improvement in the nutritional status of children can be achieved by creating awareness among the mothers. A holistic approach comprising empowering the women with education, decision making in child rearing, health care, complete immunisation including optional immunisation and preparation of nutritious food is required to combat the malnutrition among children.
Funding: The authors’ have not received any funding support.
Author’s contribution: Ms. Ansuya conceptualised the idea, conducted literature search, analysed and prepared the manuscript. Dr. Baby S Nayak conceptualised the idea, provided inputs in study design and critically revised the manuscript. Dr. B. Unnikrishnan, Dr. Avinash Shetty, Dr. Suneel C. Mudnkur provided inputs in study design and critically revised the manuscript. Dr. N Ravishankar analysed and interpreted data.
Note: * Item no.29: All studies are self –funded. Since it is prevalence and cross-sectional study, all the participants were participated and included for the analyses except few studies.