Magnetic resonance imaging plays important role in diagnosis of musculoskeletal lesions because of its multiplanar imaging and excellent soft tissue resolution. However, accuracy of differentiation between malignant and benign tumour on MRI alone is not always feasible. Proton MRS is a non invasive special imaging sequence in adjunct to MRI which helps in molecular characterisation of lesions and differentiation between malignant and benign lesions. Proton MR Spectroscopy detects 1H-containing metabolites other than water, thus giving the molecular information of the tissue in-vivo. MRS is widely used in neuroimaging, breast and prostatic tumours with promising results [1].
However, raised choline on MR spectroscopy is not a tumour-specific marker and cannot be considered specific for malignancy. Increased choline levels can be seen in certain non-neoplastic conditions and in few benign tumours.
In present study also, we evaluate the MRS features of GCT and to assess whether choline is a frequent occurrence in these tumours and whether MRS appearance can be correlated with clinical, radiologic and histopathological findings.
Materials and Methods
A prospective study was carried out in 10 patients who were suspected of GCT clinically and on radiograph in a duration of June 2014 to June 2016. All these patients were subjected to the MRI of affected region and MRS study. Approval from Institutional Ethical Committee was taken before commencement of study and informed consent was taken from all these patients. All underwent surgery and histopathology was done in all these patients. Contrast study was done in only one patient. GCT was staged according to the Campanacci system [17]. The two groups were made one with choline peak and another without choline peak.
MRI and MR Spectroscopy
MRI was done on GE machine, Signa HDxt 1.5 Tesla 16 channel echo speed. Surface coils were used according to the portion of the body to be evaluated. We used T1 and T2 weighted images, Short Tau Inversion Recovery (STIR), fat suppressed proton density and gradient echo sequences. Parameters for each of these sequences are as follows:
T1 weighted spin echo sequence-TR-600 /TE-13.1--, Matrix 320×256/2.00 NEX
T2 weighted spin echo sequence-TR-25000/TE-28, Matrix-288×224/2.00 NEX
STIR—TR-5400/TE-44.7, TI-139, Matrix-256×192/2.000 NEX
Fat Suppressed Proton Density (PDFS)-TR-2500/TE-28, Matrix-288×224/2.00 NEX
Gradient echo (MERGE)-TR-553/TE-14.5--, Matrix 256×192/2.00 NEX, Flip angle-20.
In only one patient, contrast study was done by using gadolinium 0.1 mmol/kg.
MR Spectroscopy was done in all 10 patients. Multivoxel MRS was done in all the patients. PROBE MV144 i.e., long TE sequence was used with TR-1000/TE144, FOV-24, frequency-16, phase-16, NEX-1 with auto shimming and relative SNR of 100%. The MRS data from the solid component of the tumour was taken avoiding the necrotic or cystic component of the tumour.
Choline was said to be present when there was demonstrable peak at 3.22 ppm in at least two of the spectra obtained at two different portion of the solid component. The total examination time was 25 to 30 minutes. The parameters which were evaluated includes size of the tumour, surrounding cortex, extension into soft tissue, presence of cystic component, signal intensities on MRI, fluid-fluid levels and clinical staging.
Statistical Analysis
The two groups of GCTs viz., GCT with choline peak and GCT without choline peak were compared using EPI Info Software version 6.0 statistical software program. Age of the patient and size of the tumour were evaluated using unpaired t-test. Imaging parameters between these two groups were evaluated using Fisher’s-exact test. A p-value of 0.05 was considered significant.
Results
Out of these 10 subjects, four were male and six were female with mean age of presentation in male was 40.6 years (range 26-60 years) and in female was 42.2 years (range 24-60 years). One of the patients was operated case of GCT. Duration of symptoms range from one month to two years with average age of presentation is 8.8 months. The GCTs which we have evaluated were more than 3 cm in size; largest one is in the right lower femoral condyle (size 16×13×12 cm). Cortex was broken in all the cases so, according to Campanacci clinical grading for GCT, all the 10 cases of GCTs fall in stage III. Summary of clinical, MRI and MRS findings are given in [Table/Fig-1].
Summary clinical, MRI, MRS, histopathological findings in all the patients.
| Patient No. | Age | Sex | Duration | Location | Size (cm) | Cortex | Soft tissue | Cystic component | T2 signal | Campanacci stage | MRS | Histopathology |
|---|
| 1 | 30 | F | 2 years | Right femoral condyle | 16×13×12 | Eroded | Yes | Yes | Intermediate, hyperintense | 3 | Choline | GCT |
| 2 | 57 | M | 6 months | Left proximal tibia | 6×5×6 | Eroded | Yes | Yes | Hyperintense | 3 | None | Low gd.GCT |
| 3 | 26 | M | 1 year | Left femoral condyle | 9×10×9 | Eroded | no | Yes | Intermediate, hyperintense | | Choline | GCT |
| 4 | 60 | M | | Lower rt radius | 4×3.7×4 | Eroded | No | Yes | Intermediate | 3 | Choline | GCT |
| 5 | 30 | M | 1 year | Lower end of lt humerus | 5×3×5 | Eroded | Yes | No | Intermediate | 3 | None | GCT |
| 6 | 60 | F | 3 months | Lower end of right femur | 13×8×7 | Eroded | Yes | No | Intermediate | 3 | None | GCT |
| 7 | 40 | F | - | Lower end of left femur | 9.7×10.5×19.9 | Eroded | Yes | No | Intermediate | 3 | None | GCT |
| 8 | 55 | F | 1 month | Sacrum and coccyx | 8.4×10×9.5 | Eroded | Yes | Yes | Intermediate, hyperintense | 3 | None | GCT |
| 9 | 24 | F | 4 months | Lower end of femur | 5.2×7.5×7.5 | Eroded | No | No | Intermediate | 3 | Choline | GCT |
| 10 | 32 | F | 1 month | Right talus | 5×3×3 | Eroded | Yes | Yes | Intermediate | 3 | None | GCT |
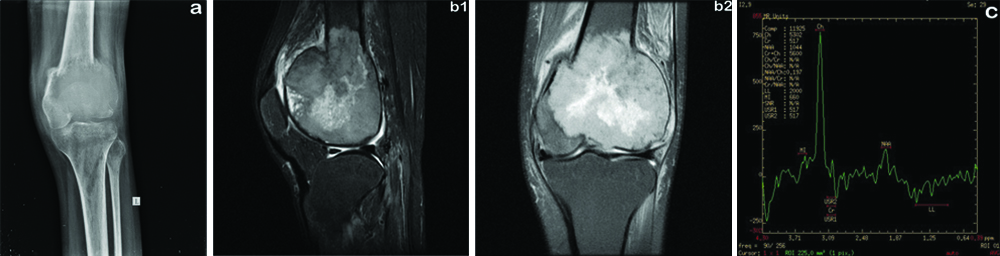
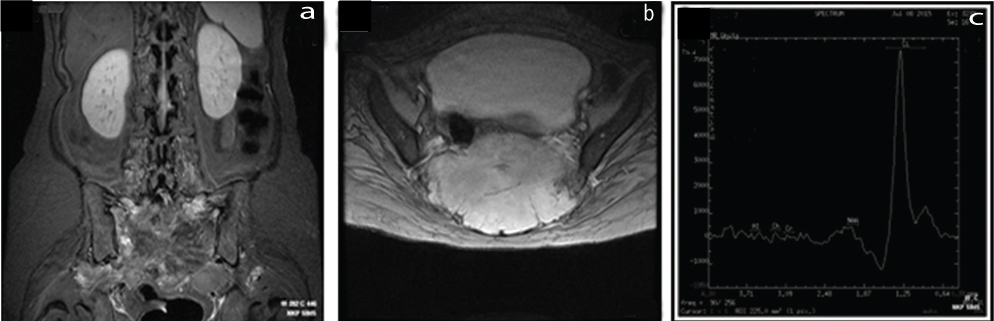
On MRS, four patients showed demonstrable choline peak [Table/Fig-2] and six did not show choline peak [Table/Fig-3].
(a) radiograph of knee showing expansile lytic lesion in the lower end of the femur in the subarticular location with narrow zone of transition associated with cortical breech. (b1) MR Proton Density Fat Suppressed (PDFS) sagittal image shows peripheral intermediate and central hyperintense signal intensity lesion in the lower end of the femur. (b2) MR T2 weighted coronal image shows intermediate to hyperintense lesion with cortical breech. (c) Proton MRS shows choline peak at 3.2ppm with lactate peak.
a) STIR Coronal image; b) MERGE T2 A axial image showing large, expansile intermediate signal intensity lesion in the sacrum; c) No demonstrable choline peak. Only lactate peak noted.
Non specific lactate peak is seen in both the groups. Out of 10 GCTs showing Campanacci Stage III only four showed choline peak (40%). Size of the tumour showed no association with occurrence of the choline peak. Soft tissue component was seen in one patients and cystic component was seen in three patients showing choline peak. Fluid-fluid levels were seen in only one patient with demonstrable choline peak. [Table/Fig-4] gives comparison between the two groups with or without choline peak.
Gives comparison between the two groups with or without choline peak.
| MR features (n=10) | MRS (n=10) | Fisher-exact test p-value* |
|---|
| Choline peak (n=4) | No choline peak (n=6) |
|---|
| 1. Campanacci stage |
| Stage 3 | 4 | 6 | |
| 2. Soft tissue component |
| Present | 1 | 5 | 0.23 |
| Absent | 3 | 1 |
| 3. Cystic component |
| Present | 3 | 3 | 0.90 |
| Absent | 1 | 3 |
| 4. Fluid-fluid level |
| Present | 1 | 1 | 0.99 |
| Absent | 2 | 5 |
No statistically significant difference was found in two groups of GCTs; *: Fisher-exact test
In these entire patients preoperative histopathology was done, which confirmed it to be benign GCT. Out of these, all patients went for operative procedures and findings were again confirmed on postoperative specimen. No statistically significant differences were found for age of patients and size of tumour between GCTs showing choline and those not showing choline (p=0.349 and 0.898, respectively). No parameters evaluated on imaging showed statistically significant difference between the two groups.
Discussion
Many studies are done in evaluation of MRS features of musculoskeletal lesions those includes osseous and non-osseous, neoplastic and non-neoplastic lesions. Very few studies are done in the past on MRS feature of GCT. The present study shows that GCT can show elevated choline levels on MRS which is benign on histopathology. All the 10 patients in present study group showed aggressive imaging findings i.e., Campanacci Stage III. Out of these only 4 (40%) showed choline peak and rest 6 (60%) did not show choline peak. All these GCTs were benign on histopathology.
Raised choline levels have also been described in breasts of lactating mothers [18] and in the brains of neonates [19]. This shows that choline is seen in non-neoplastic conditions and also in physiological condition and hence cannot be considered as a marker of malignancy.
The occurrence of choline peak at 3.2 ppm on vivo proton MR spectroscopy is mainly due to phosphocholine, glycerol-phosphocholine, and free choline which are present in the cell membrane [14]. These metabolites are markers of cellular proliferation and cell membrane turnover [20]. Increased choline is noted in malignancy owing to its hyper cellularity and increased membrane turnover. Likewise it can be increased in non malignant conditions which show hypercellularity and raised metabolite activity [21,22]. For MR spectroscopy of bone, nuclei of hydrogen are preferred over 31P considering its abundant nature and good signal to noise ratio.
Wang CK et al., had done a study of in-vivo proton MR spectroscopy for the evaluation of musculoskeletal tumours and suggested that differentiation of benign from malignant musculoskeletal tumours is possible on the basis of presence or absence of choline metabolites [12]. In this study, both bone and soft tissue tumours were included, out of that two had GCT. Out of these two, one of the GCT showed choline peak which is contradicting to their conclusion. Dedicated MRS studies of particular bone tumour are not many. Shah PL et al., concluded that though most of the malignant bone tumours have raised choline, converse is not true because few GCTs can show raised choline levels [14]. In present study, we also found similar results i.e., four out of ten GCTs in present study showed raised choline levels and on histopathology all turned out to be benign in morphology. The diagnosis of bone tumours and distinguishing benign from malignant bone tumour is mainly done on radiography. Similarly in present case almost all the patients were diagnosed or suspected of having GCT on radiography. Further imaging in the form of MRI is needed to look for extent of the lesion, neurovascular invasion, adjoining joint and soft tissue. However in soft tissue tumours dynamic contrast enhanced MRI is important in differentiating malignant from benign tumours [22]. On T2-weighted images, intermediate signal is due to chronic haemosiderin deposition [23,24] is a well-recognised MRI feature of GCT, which was also seen in all the patients of present study. GCT account for 20% of all benign tumours [25]. It is locally aggressive tumour. It has been categorised into three categories by Campanacci staging [17]. All the patients in present study group fall in Stage III. This is likely to be due to low socio-economic status and lack of awareness regarding personal health and reluctance to undergo further imaging.
Out of 10 patients only four showed raised choline peak that means staging has nothing to do with the occurrence of choline peak. This is contradictory to the study done by Shah PL et al., [14], which suggested that the presence of choline in some of the GCTs may be due to their local aggressiveness. And they related it to the soft tissue extension. However in present study, only one patient did not have soft tissue but had cortical breech and the same patient showed choline peak on MRS. However, we do not have follow-up of all these patients to look for recurrence. Also, DNA analysis of these patients was not done.
Many proliferation markers such as the p53 gene and DNA analysis are showing encouraging results in predicting the clinical outcome of GCTs [26,27]. Elevated choline may represent a growing phase of the tumour, as reported in a case of breast fibro adenoma with an elevated choline level [28]. Therefore we postulate that raised choline in GCT is related to tumour proliferation and disease activity and not to the aggressiveness of the tumour per se. This may have an implication on type of treatment for GCT [14]. No concrete data are available on MR spectroscopy findings of benign bone tumours. We can only say that similar findings are seen in GCT of bone as in other areas such as the breast and the brain.
Limitation
The main limitation of present study was a small sample size. Moreover, we have not correlated presence of choline and biologic behaviour of the tumour. Also, proliferation markers and DNA analysis were not performed.
Conclusion
Giant cell tumour of bone can show elevated choline levels. However, there is no positive correlation between occurrence of choline and malignant transformation as seen in the present study out of 10 GCTs only four showed choline peak. Therefore, we conclude that benign GCT of bone may show elevated choline levels on proton MR spectroscopy, irrespective of its clinical staging.
No statistically significant difference was found in two groups of GCTs; *: Fisher-exact test