Introduction
Type II Diabetes Mellitus (T2DM) is a serious metabolic disorder in which Oxidative Stress (OS) is responsible for tissue damage and complications. An 8-iso prostaglandin F2 alpha (8-iso-PGF2α) is a stable and abundant active product of oxidative stress that could promote complications in DM and could be used as a biomarker for the detection of oxidative injury and lipid peroxidation.
Aim
The study was designed to evaluate the accuracy of 8-iso prostaglandin F2 alpha (8-iso-PGF2α) and Superoxide Dismutase (SOD) activity as a biomarker of OS in T2DM and to verify their relation with the glycaemic control and lipid profile.
Materials and Methods
This is a cross-sectional case control study that included 58 (20 good glycaemic control and 38 poor glycaemic control) T2DM patients from Al-Noor Specialist Hospital, Holly Makkah and 20 healthy volunteers. 8-iso-PGF2α was measured by quantitative ELISA and SOD enzyme activity assayed by colorimetric technique. Data were analysed using SPSS version 20. All numerical data were represented as mean±SD. ANOVA test was used for comparisons between the different groups. Receiver Operating Characteristic (ROC) curve was conducted to calculate sensitivity and specificity.
Results
There was a highly significant increase in 8-iso-PGF2α level in the uncontrolled DM cases compared to both the control and controlled DM groups (p<0.001) and it showed positive correlation with HBA1c (r = 0.817 and p<0001). SOD activity showed a highly significant decrease in the controlled and uncontrolled DM group compared to the control group (p<0.001) with larger reduction in the uncontrolled group (p 0.009). Based on ROC curve analysis, 8-iso PGF2α at a cut-off 113.8 pg/mL showed 100% sensitivity, specificity, Positive Predictive Value (PPV) and Negative Predictive Value (NPP) for prediction of OS associated with poor glycaemic control. Levels lower than 2.37 SOD activity can predict OS with 87.8% sensitivity, 66.7% specificity, 90.3% PPV and 73.5% NPV.
Conclusion
This study highlights the validity of 8-iso-PGF2α as a biomarker of OS with high accuracy compared to SOD in T2DM that make it worthy to move serum 8-iso-PGF2α detection from research to clinical utility.
Introduction
Worldwide T2DM is an emerging health challenge due to an inactive lifestyle linked to urbanisation, high prevalence of obesity and stress-related factors in addition to the genetic prevalence [1].
Oxidative Stress results from imbalance between Reactive Species (RS) production and antioxidant defenses. OS is connected to a variety of pathological conditions, including cancer, chronic inflammatory disease, rheumatoid arthritis, post-ischemic organ injury, and DM [2]. Antioxidants strategies aimed at either reduction of the harmful effects of free radicals or boost the natural defense systems [3].
Superoxide Dismutase is one of the enzymatic antioxidants defense mechanisms. It catalyses the dismutation reaction of superoxide radical anion to hydrogen peroxide which is then catalysed to innocuous O2 and H2O by glutathione peroxidase and catalase. An imbalance in this coordinated system leads to increased OS [4]. Three genetically distinct mammalian isoforms of SOD are known; SOD1 and SOD3 are copper and zinc-containing SOD (Cu Zn-SOD). SOD1 is localised primarily to cytoplasmic and nuclear compartment. SOD3 is the predominant Extra Cellular (EC) antioxidant enzyme. SOD2 is a manganese-containing SOD (Mn-SOD) and found predominantly in mitochondria. EC-SOD has been found in serum, cerebrospinal, ascetic and synovial fluids. EC-SOD enzyme activity equals or exceeds that of both SOD1 and SOD2 [5].
An 8-iso prostaglandin F2 alpha (8-iso-PGF2α) or 8-Isoprostane (8-IP) is a prostaglandin-like compound generated during the free radical-mediated, non-enzymatic peroxidation of arachidonic acid in phospholipids of cell membranes [6]. Many studies have demonstrated that 8-iso-PGF2α is not only a marker of OS but also a biologically active molecule [7,8]. It promotes atherosclerosis and attenuates angiogenesis by activating thromboxane receptor [9]. Elevated levels of 8-iso-PGF2α have been observed in a number of conditions associated with increased reactive oxygen species such as alcoholic and non-alcoholic liver diseases [10], pulmonary disease [11] and diabetes [12]. An 8-iso-PGF2α is one of the most stable products of OS compared to thiobarbituric acid reactive substances, malondialdehyde and lipid hydroperoxide [13] and one of the most abundant F2-Isoprostane stereoisomers that enable it to become a gold standard biomarker for detection of oxidative injury [14] and lipid peroxidation [15].
This study aimed at evaluation of the clinical utility of 8-iso-PGF2α versus SOD activity in T2DM with regards to OS and verification of their relation to glycaemic control and lipid profile.
Materials and Methods
Study Population
This study was a cross-sectional case-control study that included 58 T2DM patients and 20 healthy volunteers. PASS version 15 program was used to validate the sample size; the total sample of 78 subjects achieves 90% power to detect differences among the means versus the alternative of equal means. The size of the variation in the means is represented by their standard deviation alpha error 0.5.
The patients were selected from those who regularly attend the diabetes clinic in Al-Noor specialist hospital, Holly Makah, Saudi Arabia from May 2016 to September 2016. The patients were diagnosed as T2DM according to the World Health Organisation Consultation and International Expert Committee [16].
T1DM patients or T2DM patients who complained of cardiovascular, liver, kidney diseases, other endocrine disorders, acute and chronic inflammatory diseases as well as those who were on antioxidants supplementation in the previous two months were excluded from the study. All the participants were subjected to full medical history taking and clinical examination.
The study was performed in accordance with the declaration of Helsinki 1964 [17]. The protocol was approved by the ethical committee of Faculty of Applied Medical Sciences, Umm Al Qura University. An informed written consent was obtained from each participant in this study.
Specimen and Methods
Five millilitres venous blood was withdrawn from both healthy individuals and patients after 12 hours fasting and before taking medications and was divided into two tubes; an EDTA tube for HbA1c assay and serum separator tubes. The serum was separated by centrifugation for 15 minutes at 1500 X g, all quoted for assay of 8-iso-PGF2α and SOD after performance of the routine biochemical investigations that included Fasting Blood Glucose (FBG), Lipid profile; Triglyceride (TG), Total Cholesterol (TC), Low-Density Lipoprotein Cholesterol (LDL-C), High-Density Lipoprotein Cholesterol (HDL-C) from which the atherogenic index LDL/HDL ratio was calculated, Kidney function tests; serum creatinine, urea and uric acid and liver function tests; serum activity of Alanine Amino Transferase (ALT), Aspartate Amino Transferase (AST) and Alkaline Phosphatase (ALP), albumin, protein and total bilirubin level. All routine laboratory tests were analysed by using an auto-analyser COBAS INTEGRA® 6000 Roche Diagnostics, GmbH, Mannheim (Germany).
An 8-iso-PGF2α was measured by quantitative sandwich enzyme immunoassay technique following the manufacture instruction (CUSABIO BIOTECH, China. The catalog No. is CSB-E09441h). The SOD enzyme activity assayed by colorimetric technique (BioAssay system) [18].
Statistical Analysis
Data were analysed using SPSS (Statistical Package for Social Sciences; SPSS Inc., Chicago, IL, USA) version 20 for Microsoft windows. Numerical data were presented as mean±SD or median, and range as appropriate. Comparisons between different groups of numerical data were conducted using ANOVA (ANALYSIS OF VARIANCE), paired comparisons were conducted using Bonferroni’s test. Pearson’s correlation was used for correlation analysis. Probability (p-value) < 0.05 was considered significant and <0.001 highly significant. ROC curve was conducted for the potential studied risk factors to calculate sensitivity and specificity.
Results
This study included 58 T2DM patients of both sexes and 20 healthy volunteers. The age of the patients ranged from 40 to 71 years and male to female was ratio was 1:1. The diabetic patient group was classified on the basis of their blood HbA1c % into:
Controlled DM, 20 patients with their HbA1c ≤7% denoting good glycaemic control. They were 11 males (55%) and 9 females (45%), their median age was 52 and ranged from 27 to 72 years.
Uncontrolled DM, 38 patients with their HbA1c >7%, denoting poor glycaemic control and include 38 patients. They were 20 males (52.6%) and 18 females (47.4%), their median age was 54 and ranged from 25 to 75 years.
Basic laboratory investigations are presented in [Table/Fig-1].
Basic laboratory investigations in the different studied groups^.
| Variables | Normal controln=20 | Controlled DMn=20 | Uncontrolled DMn=38 | p-value |
|---|
| FBG (mg/dL) | 84.85±7.01 | 129.19±49.43a | 221.65±96.62b** & c** | <0.001 |
| HbA1c (%) | 4.92±0.40 | 6.16±0.49a* | 9. 9±1.78b** & c** | <0.001 |
| Albumin (mg/dL) | 4.36±0.48 | 4.08±0.41 | 4.34±2.02 | >0.05 |
| Total bilirubin (mg/dL) | 0.6±0.23 | 0.59±0.28 | 0.60±0.37 | >0.05 |
| Total protein (g/dL) | 7.38±0.59 | 7.10±1.38 | 7.33±0.92 | >0.05 |
| ALT (U/L) | 17.14±3.47 | 27.18±10.66a* | 24.64±10.71b* & c | 0.002 |
| AST (U/L) | 23.90±5.24 | 26.90±9.89 | 23.31±15.45 | >0.05 |
| ALP (U/L) | 50.30±4.85 | 91.95±33.21a* | 94.95±45.52b**& c | <0.001 |
| Urea (mg/dL) | 22±3.01 | 26.45±7.48 | 30.94±13.58b* | 0.009 |
| Creatinine (mg/dL) | 0.855±0.2114 | 0.93±0.36 | 1.16±1.19 | >0.05 |
| Uric acid (mg/dL) | 5.12±1.01 | 5.16±2.15 | 4.97±1.10 | >0.05 |
| TC (mg/dL) | 63.6±7.64 | 179.38±31.37a** | 185.97±47.03b**& c | <0.001 |
| TG (mg/dL) | 52.47±6.39 | 129.38±57.14a* | 141.22±82.62b**& c | <0.001 |
| LDL-C (mg/dL) | 46.80±9.33 | 110.31±24.27a** | 104.78±37.06b**& c | <0.001 |
| HDL-C (mg/dL) | 64.55±11.27 | 44.93±10.9a** | 45.36±12.87b**& c | <0.001 |
| LDL-C/HDL-C ratio | 0.75±0.21 | 2.55±0.63a ** | 2.41±0.83b**& c | <0.001 |
n=number of cases; P: Probability of chance
aControlled DM vs. control group
bUncontrolled DM vs. control group
cUncontrolled DM vs. controlled DM groups
*Significant (p value <0.05); ** Highly significant (p-value<0.001)
^ all investigations were performed on serum sample except HbA1c% that was performed on red cell lysate
□ p-values were calculated by ANOVA test and paired comparisons were conducted using Bonferroni’s test
Fasting Blood Glucose Level and HbA1c%
Uncontrolled DM group demonstrated highly significant levels of FBG and HbA1c% compared to both the control and the controlled DM groups (p<0.001). The controlled DM group did not differ significantly from the control group regarding FBG levels (p=0.16) while it had a significantly higher HbA1c % than the control group (p=0.008).
Lipid Profile
A significant elevation in the levels of TC, TG, LDL-C and LDL-C/HDL-C ratio and highly significant low levels of HDL-C was detected in both uncontrolled and controlled DM when compared with the control (p<0.001).
Liver Function Tests
ALP ad ALT activity in both controlled and uncontrolled DM groups revealed a significant increase in relation to the control (p <0.001 and 0.002 respectively) without a significant difference in between. Otherwise, no significant difference regarding AST activity, total protein, total bilirubin or albumin levels was seen.
Kidney Function Tests
The uncontrolled DM had a significant higher urea level than the control group (p =0.007) while the controlled DM group showed no significant difference from the normal control or the uncontrolled DM groups (p >0.05). No significant difference related to creatinine and uric acid levels could be detected in the studied groups (p >0.05).
An 8-Iso-Prostaglandine F2α Levels and SOD Activity
There was a highly significant increase in 8-iso-PGF2α level in the uncontrolled DM cases when compared with both the control and the controlled DM groups (p<0.001). However, the controlled DM group did not show any significant difference from the control group. Data shown in [Table/Fig-2].
Serum levels of 8-iso-prostaglandin F2α level & SOD activity among the different studied groups n= number of cases.
| Variables | Controln=20 | Controlled DMn=20 | UncontrolledDMn=38 | p-value |
|---|
| 8-iso-prostaglandin F2α (pg/mL) | 81.69±10.98 | 85.94±9.57a | 159.20±17.75b**& c** | <0.001 |
| SOD (U/mL) | 13.04±1.95 | 2.95±1.05a** | 1.87±0.93b**& c* | <0.001 |
aControlled DM vs. control group
bUncontrolled DM vs. control group
cUncontrolled DM vs. controlled DM groups
P: probability of chance
*Significant (p-value <0.05); ** Highly significant (p-value<0.001)
Ỽ p-values were calculated by ANOVA test and paired comparisons were conducted using Bonferroni’s test
Regarding SOD activity, it showed a highly significant decrease in the controlled and uncontrolled DM group compared to the control group (p<0.001). Also, a significant lower value was detected in the uncontrolled compared to the controlled DM groups (p=0.009). Data shown in [Table/Fig-2].
Correlations analysis between the serum level of 8-iso-PGF2α and SOD with lipid profile and FBG, HbA1c revealed a significant positive correlation between 8-iso-PGF2α and HbA1c, SOD activity showed negative correlation with HbA1c, 8-iso-PGF2α, TC, LDL-C and LDL-C/HDL-C ratio and positive correlation with HDL-C. Data shown in [Table/Fig-3].
Pearson’s correlation between potential predictors of diabetic complications and basic laboratory investigations.
| Parameters | 8-isoprostaglandin F2α (pg/mL) | SOD (U/mL) |
|---|
| p | r | p | r |
|---|
| FBG (mg/dL) | 0.001 | 0.578** | 0.001 | -0.520** |
| HbA1c (%) | 0.001 | 0.817** | 0.001 | -0.656** |
| TC (mg/dL) | 0.001 | 0.492** | 0.001 | -0.792** |
| TG (mg/dL) | 0.042 | 0.231* | 0.001 | -0.441** |
| HDL-C (mg/dL) | 0.016 | -0.274* | 0.001 | 0.532** |
| LDL-C (mg/dL) | 0.001 | 0.370** | 0.001 | -0.632** |
| LDL-C/HDL-C ratio | 0.001 | 0.373** | 0.001 | -0.704** |
| 8-isoprostaglandin F2α (pg/mL) | | | 0.001 | -0.623** |
| SOD (U/mL) | 0.001 | -0.623** | | |
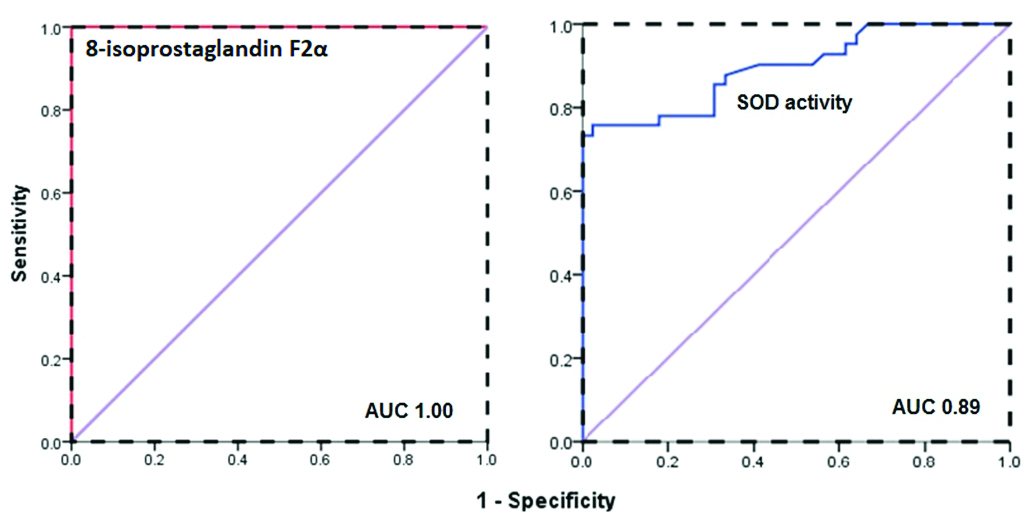
ROC curve was plotted for the uncontrolled DM group versus the rest of the studied cases to calculate the best cut-off value, sensitivity and specificity for 8-iso- PGF2α and SOD levels for the prediction of OS in DM. The Area Under the ROC curve (AUROC) for 8-iso- PGF2α was 1.00 denoting the best accuracy, on the same context using 113.8 pg/mL as a cut-off revealed perfect sensitivity, specificity, PPV and NPV; 100% for prediction of OS associated with poor glycaemic control. Regarding SOD activity, lower levels than 2.37 can predict OS with 87.8% sensitivity, 66.7% specificity, 90.3% PPV and 73.5% NPV. Data presented in [Table/Fig-4,5].
Diagnostic accuracy of potential prediction of diabetic complications.
| Markers | AUC | Cut-off | Sensitivity | Specificity | PPV | NPV |
|---|
| 8-isoprostaglandin F2α (pg/mL) | 1.00 | 113.8 | 100% | 100% | 100% | 100% |
| SOD (U/mL) | 0.89 | 2.37 | 87.8% | 66.7% | 90.32% | 73.46% |
ROC curve analysis of 8-isoprostaglandin F2α level and superoxide dismutase activity as potential predictors of oxidative stress in type 2 diabetes mellitus.
Discussion
The relation between DM and dyslipidemia is well known and forms a vicious circle. Hyperglycaemia causes glucose autoxidation with free radical formation and consequently OS. Dyslipidemia induced by OS had a lipotoxic effect on the pancreatic β-cell that adds more to poor glycaemic control [19].
In the present study, the uncontrolled diabetics had significantly higher levels of 8-iso-PGF2α which is in line with many authors [20-22]. The changes in the lipid profile previously mentioned with T2-DM are associated with oxidation of arachidonic acid to 8-iso-PGF2α [23] leading to elevated levels of 8-iso-PGF2α. Meanwhile, a significant low level of HDL-C was detected; the carrier for 8-iso-PGF2α in the diabetic group compared to the control that may be another contributing factor for the elevated 8-iso-PGF2α [24]. High level of 8-iso-PGF2α denotes the existence of lipid peroxidation and provides evidence about a condition of systemic rather than local pro-oxidant status [25]. Increased lipid peroxidation impairs membrane functions by decreasing membrane fluidity and changing the activity of membrane-bound enzymes and receptors [26]. Another feature of 8-iso-PGF2α is its action as a link between oxidative milieus and vascular dysfunction where formation of 8-iso-PGF2α in platelet membrane results in defective platelet function with increased adhesion liability [27]. Furthermore, it was proved by in-vitro study that it has a deleterious effect on platelet shape and function [28]. All together, these facts make 8-iso-PGF2α a superior predictive of lipid peroxidation as it could predict vascular complications as well.
In accordance to a previous study, we revealed a positive correlation between 8-iso-PGF2α as an indicator of OS and high levels of HbA1C denoting the linkage of 8 iso-PGF2α with the degree of glycaemic control [29]. Chronic hyperglycaemia leads to mitochondrial overproduction of ROS. Those ROSs are considered an upstream event that leads to increased flux of glucose, formation of glycation end products, and expression of advanced glycation end products receptors and its activating ligands. Also, mitochondrial ROS activate protein kinase C isoforms, and hexosamine pathway. All these factors work together to end in OS and tissue damage [30].
In the current study, SOD activity was diminished in diabetic group with more reduction in the uncontrolled than controlled DM this finding would emphasises the glucose as a modifier for SOD activity [31]. The reduction in SOD activity indicates exhaustion of antioxidant reserve and decreased scavenging capacity of SOD-dependent anti oxidant defensive system against elevated lipid peroxidation processes that further exacerbate OS [32]. Our result coincides with Doddigarla Z et al., who found low SOD activity among diabetic patients [33]. On the other hand, Kasznick J et al., reported no change in SOD activity, while Bandeira Sde M et al., demonstrated an increased SOD activity and explained this finding by being a possible adaptive response to the increased production of the superoxide radicals [34,35].
The decreased SOD activity was correlated with increased glycaemic index in accordance with Doddigarla Z et al., [33]. Hyperglycaemia leads to non-enzymatic glycation of proteins with production of inactive glycosylated SOD. Also, glycation inhibit copper and zinc an important co-factor for SOD activity [36]. In addition to zinc deficiency which is commonly found in diabetics due to osmotic diuresis and excess urinary loss induced by chronic hyperglycaemic state [37]. Moreover, hyperglycaemia enhances generation of free radicals thereby, causing the depletion of SOD which quenches them [38]. SOD acts as a first line antioxidant defense which rapidly catalyses the dismutation of superoxide anion. Decrease in SOD levels can result not only in increase of the superoxide-free radical but also an elevation of other ROS that further increases the deleterious effects of free radicals [39]. Additionally, we found a negative correlation between the activity of SOD and TG, LDL-C and LDL-C/HDL-C in accordance with other study [32]. This may be related to the liability of LDL to oxidation as a result of free radical formation with the uncontrolled hyperglycaemia that would increase the incidence of vascular complications [32].
In the same context, OS generated as a result of poor glycaemic control in DM could induce pathological derangement that affects renal state leading to high urea level [40] as detected in this cohort and irreversibly damage major proteins with loss of their function that contributes to hepatocellular injury [41] that appears as elevated liver enzymes ALP and ALT as observed in this study.
The ROC curve was driven to select the best cut-off for detection of OS and the associated complications in the diabetic group. At 113.8 pg/mL, 8-iso-PGF2α had the highest sensitivity and specificity (100%) in our cohort, this cut-off is never encountered in the controlled DM group denoting the direct link of high 8-iso-PGF2α with poor glycaemic control comparably, Nakhjavani M et al., [29]. With regards to the power of SOD in identifying diabetic patients having OS, it has 87.8% sensitivity and 66.7% specificity at a cut-off value 2.37 U/mL that is inferior to 8-iso-PGF2α.
Limitation
Despite the promising results of the study, inclusion of a larger cohort will solidify the results. We did not study the value of 8-iso-PGF2α or SOD in type I DM that is recommended in future studies and comparison of their status with type II DM. Additionally, those patients who had lab features of OS should be retested after antioxidant therapy.
Conclusion
This study highlights the validity of 8-iso-PGF2α as a biomarker of OS in type 2DM with higher accuracy than SOD activity that showed an inferior accuracy, sensitivity and specificity. These results make it worthy to move serum 8-iso-PGF2α detection from research to clinical utility. The significant correlation found in this study between HbA1c and parameters of OS indicate that good glycaemia control can alleviate the long-term complications of diabetes by decreasing OS.
n=number of cases; P: Probability of chance
aControlled DM vs. control group
bUncontrolled DM vs. control group
cUncontrolled DM vs. controlled DM groups
*Significant (p value <0.05); ** Highly significant (p-value<0.001)
^ all investigations were performed on serum sample except HbA1c% that was performed on red cell lysate
□ p-values were calculated by ANOVA test and paired comparisons were conducted using Bonferroni’s test
[1]. Ghoshal K, Bhattacharyya M, Adiponectin: Probe of the molecular paradigm associating diabetes and obesityWorld J Diabetes 2015 6:151-66.10.4239/wjd.v6.i1.15125685286 [Google Scholar] [CrossRef] [PubMed]
[2]. Samanthi RP, Rolf EA, Jelena AJ, Maria A, Paresh CD, Novel conjugates of 1, 3-diacylglycerol and lipoic acid: Synthesis, DPPH assay, and RP-LC-MS-APCI analysisJ Lipids 2011 10:1-10.10.1155/2011/41980921966595 [Google Scholar] [CrossRef] [PubMed]
[3]. Lushchak VI, OS in yeastBio Moscow 2010 75(3):281-96.10.1134/S0006297910030041 [Google Scholar] [CrossRef]
[4]. Wang XF, Wu YH, Jiao J, Guan CP, Yang XG, Wang MS, Diagnostic value of superoxide dismutase in tuberculosis and malignant pleural effusionsAsian. Pac J Cancer Prev 2013 14(2):821-24.10.7314/APJCP.2013.14.2.82123621245 [Google Scholar] [CrossRef] [PubMed]
[5]. Sayed IA, Khan WA, Glycated hemoglobin a marker and predictor of cardiovascular diseaseJPMA 2011 61(7):690-95. [Google Scholar]
[6]. Kaviarasan S, Muniandy S, Qvist R, Ismail IS, F2-isoprostanes as novel biomarkers for type 2 diabetes: a reviewJ. Clin Biochem Nutr 2009 45:1-8.10.3164/jcbn.08-26619590700 [Google Scholar] [CrossRef] [PubMed]
[7]. Szułdrzyński K, Zalewski J, Machnik A, Żmudka K, Elevated levels of 8 iso prostaglandin F2α in acute coronary syndromes are associated with systemic and local platelet activationPol Arch Med Wewn 2010 120(1-2):19-25. [Google Scholar]
[8]. Halvorsen B, Staff A, Henriksen T, Sawamura T, Ranheim T, 8-iso-Prostaglandin F2a Increases Expression of LOX-1 in JAR CellsHypertension 2001 37:1184-90.10.1161/01.HYP.37.4.118411304522 [Google Scholar] [CrossRef] [PubMed]
[9]. Benndorf RA, Schwedhelm E, Gnann A, Taheri R, Kom G, Didié M, Inhibit vascular endothelial growth factor induced endothelial cell migration, tube formation, and cardiac vessel sprouting in vitro, as well as angiogenesis in vivo via activation of the thromboxane A (2) receptor: A potential link between OS and impaired angiogenesisCirc Res 2008 103(9):1037-46.10.1161/CIRCRESAHA.108.18403618802021 [Google Scholar] [CrossRef] [PubMed]
[10]. Konishi M, Iwasa M, Araki J, Kobayashi Y, Katsuki A, Sumida Y, Increased lipid peroxidation in patients with non-alcoholic fatty liver disease and chronic hepatitis C as measured by the plasma level of 8-isoprostaneJ Gastroenterol Hepatol 2006 21(12):1821-25.10.1111/j.1440-1746.2006.04420.x17074020 [Google Scholar] [CrossRef] [PubMed]
[11]. Inonu H, Doruk S, Sahin S, Erkorkmaz U, Celik D, Celikel S, OS levels in exhaled breath condensate associated with COPD and smokingRespir Care 2012 57(3):413-19.10.4187/respcare.0130221968597 [Google Scholar] [CrossRef] [PubMed]
[12]. Il’yasova D, Spasojevic I, Base K, Zhang H, Wang F, Young SP, Urinary F2- isoprostanes as a biomarker of reduced risk of type 2 diabetesDiabetes Care 2012 35(1):173-74.10.2337/dc11-150222100959 [Google Scholar] [CrossRef] [PubMed]
[13]. Van’t Erve TJ, Kadiiska MB, London SJ, Mason RP, Classifying OS by F2-isoprostane levels across human diseases: a meta-analysisRedox Biol 2017 12:582-99.10.1016/j.redox.2017.03.02428391180 [Google Scholar] [CrossRef] [PubMed]
[14]. Milne GL, Classifying OS by F2-Isoprostane levels in human disease: The re-imagining of a biomarkerRedox Biol 2017 12:897-98.10.1016/j.redox.2017.04.02828467952 [Google Scholar] [CrossRef] [PubMed]
[15]. Niki E, Biomarkers of lipid peroxidation in clinical materialBiochim Biophys Acta 2014 1840:809-17.10.1016/j.bbagen.2013.03.02023541987 [Google Scholar] [CrossRef] [PubMed]
[16]. The International Expert CommitteeInternational Expert Committee report on the role of the A1C assay in the diagnosis of diabetesDiabetes Care 2009 32(7):1327-34.10.2337/dc09-903319502545 [Google Scholar] [CrossRef] [PubMed]
[17]. Helsinki. Declaration of Helsinki recommendation guiding doctors in clinical research Adopted by the 18th World Medical Assembly, Helsinki, Finland, June 1964 [Google Scholar]
[18]. Janknegt PJ, Rijstenbil JW, van de Poll WH, Gechev TS, Buma AG, A comparison of quantitative and qualitative superoxide dismutase assays for application to low temperature microalgaeJ Photochem Photobiol B 2007 87(3):218-26.10.1016/j.jphotobiol.2007.04.00217553689 [Google Scholar] [CrossRef] [PubMed]
[19]. Roberts LJ, Morrow JD, Products of the isoprostane pathway: Unique bioactive compounds and markers of lipid peroxidationCell Mol Life Sci 2002 59(5):808-20.10.1007/s00018-002-8469-8 [Google Scholar] [CrossRef]
[20]. Liu JB, Li WJ, Fu FM, Zhang XL, Jiao L, Cao LJ, Inverse correlation between serum adiponectin and 8-iso-prostaglandin F2α in newly diagnosed type 2 diabetes patientsInt J Clin Exp Med 2015 8(4):6085-90. [Google Scholar]
[21]. Calabrese V, Cornelius C, Leso V, Trovato-Salinaro A, Ventimiglia Cavallar M, OS, glutathione status, sirtuin and cellular stress response in type 2 diabetesBiochim Biophys Acta 2012 1822(5):729-36.10.1016/j.bbadis.2011.12.00322186191 [Google Scholar] [CrossRef] [PubMed]
[22]. Tabak O, Gelisgen R, Erman H, Erdenen F, Muderrisoglu C, Aral H, Oxidative lipid, protein, and DNA damage as OS markers in vascular complications of diabetes mellitusClin Invest Med 2011 34(3):163-71.10.25011/cim.v34i3.15189 [Google Scholar] [CrossRef]
[23]. Meikle PJ, Wong G, Barlow CK, Weir JM, Greeve MA, MacIntosh M, Plasma lipid profiling shows similar associations with pre-diabetes and type 2 diabetesPLoS ONE 2013 8(9):7434110.1371/journal.pone.007434124086336 [Google Scholar] [CrossRef] [PubMed]
[24]. Proudfoot JM, Barden AE, Loke WM, Croft KD, Puddey IB, Mori TA, HDL is the major lipoprotein carrier of plasma F2-isoprostanesJ Lipid Res 2009 50(4):716-22.10.1194/jlr.M800607-JLR20019050315 [Google Scholar] [CrossRef] [PubMed]
[25]. Ono M, Takebe N, Oda T, Nakagawa R, Matsui Ono, Sasai T, Association of Coronary Artery Calcification with MDA-LDL-C/LDL-C and Urinary 8-Isoprostane in Japanese Patients with Type 2 DiabetesIntern Med 2014 53:391-96.10.2169/internalmedicine.53.954924583425 [Google Scholar] [CrossRef] [PubMed]
[26]. Mishra N, Singh N, Blood viscosity, lipid profile, and lipid peroxidation in type-1 diabetic patients with good and poor glycaemic controlNorth Am J Med Sci 2013 5(9):562-66.10.4103/1947-2714.11892524251275 [Google Scholar] [CrossRef] [PubMed]
[27]. Pratico D, Iuliano L, Mauriello A, Spagnoli L, Lawson JA, Maclouf J, Localization of distinct F2-isoprostanes in human atherosclerotic lesionsJ Clin Invest 1997 100:2028-34.10.1172/JCI1197359329967 [Google Scholar] [CrossRef] [PubMed]
[28]. Morrow JD, Minton TA, Roberts LJ, The F2-isoprostane, 8-epi-prostaglandin F2 alpha, a potent agonist of the vascular thromboxane/endoperoxide receptor, is a platelet thromboxane/endoperoxide receptor antagonistProstaglandins 1992 44:155-63.10.1016/0090-6980(92)90077-7 [Google Scholar] [CrossRef]
[29]. Nakhjavani M, Ghazizadeh Z, Nargesi AA, Mokhtari A, Asgarani F, Imani M, Prostaglandin F2 alpha plasma concentration predicts glycaemic control and oxidation status in patients with type 2 diabetes mellitusClin Lab 2014 60:2073-80.10.7754/Clin.Lab.2014.14040525651743 [Google Scholar] [CrossRef] [PubMed]
[30]. Giacco F, Brownlee M, OS and diabetes complicationsCirc Res 2010 107:1058e7010.1161/CIRCRESAHA.110.22354521030723 [Google Scholar] [CrossRef] [PubMed]
[31]. Goodarzi MT, Varmaziar L, Navidi AA, Parivar K, Study of OS in type 2 diabetic patients and its relationship with glycated hemoglobinSaudi Med J 2008 29(4):503-06. [Google Scholar]
[32]. Rajprabha Hamid M, Meena RK, Syedyawer H, Study of antioxidant enzyme -superoxide dismutase activity and lipid profile in diabetes mellitus patientsInternational J of Healthcare and Biomedical Research 2014 2(4):22-29. [Google Scholar]
[33]. Doddigarla Z, Parwez I, Ahmad J, Correlation of serum chromium, zinc, magnesium and SOD levels with HbA1c in type 2 diabetes: A cross sectional analysisDiabetes & Metabolic Syndrome: Clinical Research & Reviews 2016 10:126-29.10.1016/j.dsx.2015.10.00826589776 [Google Scholar] [CrossRef] [PubMed]
[34]. Kasznicki J, Kosmalski M, Sliwinska A, Mrowicka M, Stanczyk M, Majsterek I, Evaluation of OS markers in pathogenesis of diabetic neuropathyMol Biol Rep 2012 39(9):8669-78.10.1007/s11033-012-1722-922718504 [Google Scholar] [CrossRef] [PubMed]
[35]. Bandeira Sde M, Guedes Gda S, da Fonseca LJ, Pires AS, Gelain DP, Moreira JC, Characterization of blood OS in type 2 diabetes mellitus patients: increase in lipid peroxidation and SOD activityOxid Med Cell Longev 2012 2012:81931010.1155/2012/81931023259029 [Google Scholar] [CrossRef] [PubMed]
[36]. Hamden K, Carreau S, Jamoussi K, Miladi S, Lajmi S, Aloulou D, 1α, 25 dihydroxyvitamin D3: Therapeutic and preventive effects against OS, hepatic, pancreatic and renal injury in alloxan-induced diabetes in ratsJ Nutr Sci Vitaminol 2009 55(3):215-22.10.3177/jnsv.55.21519602829 [Google Scholar] [CrossRef] [PubMed]
[37]. Simmons D, Joshi S, Shaw J, Hypomagnesaemia is associated with diabetes: not pre-diabetes, obesity or the metabolic syndromeDiabetes Res Clin Pract 2010 87(2):261-66.10.1016/j.diabres.2009.11.00320004036 [Google Scholar] [CrossRef] [PubMed]
[38]. Hisalkar PJ, Patne AB, Fawade MM, Karnik AC, Evaluation of plasma superoxide dismutase and glutathione peroxidase in type 2 diabetic patientsBiology and Medicine 2012 4(2):65-72. [Google Scholar]
[39]. Catanzaroa O, Capponia JA, Michielia J, Labal E, Di Martino I, Sirois P, Bradykinin B1 antagonism inhibits OS and restores Na+ K+ ATPase activity in diabetic rat peripheral nervous systemPeptides 2013 44:100-04.10.1016/j.peptides.2013.01.01923528517 [Google Scholar] [CrossRef] [PubMed]
[40]. Sitar G, Kucuk M, Sitar ME, Yasar O, Aydin S, Yanar K, Crucial roles of systemic and tissue lipid peroxidation levels and anti-oxidant defences following contrast agent applicationIran Red Crescent Med J 2016 18(6):e3733110.5812/ircmj.3733127621939 [Google Scholar] [CrossRef] [PubMed]
[41]. Patche J, Girard D, Catana A, Boyer F, Dobi A, Planesse C, Diabetes-induced hepatic OS: a new pathogenic role for glycated albuminFree Radical Biology and Medicine 2017 102:133-48.10.1016/j.freeradbiomed.2016.11.02627890722 [Google Scholar] [CrossRef] [PubMed]