Introduction
The peak oxygen uptake (VO2peak) is considered a valid indicator of the cardiovascular system function, and when measured on a metabolic cart it is considered the gold standard for cardiorespiratory fitness. Prediction equations have been developed to indirectly determine VO2peak; however, there are no equations specific to Costa Rican older adults.
Aim
To develop a VO2peak prediction equation for Costa Rican adults over 60 years using the distance achieved on the Six minutes Walking Test (6MWT) and anthropometrical measures.
Materials and Methods
Seventy-nine adults (Mean age=68.8±4.79 yr.) read and signed the informed consent, then scanned on DXA for body composition, then measured the HR before and after the 6MWT. Following a 10-minutes recovery period from the 6MWT, they performed a VO2peak treadmill test with breath-to-breath calorimetry gas analysis. The prediction model included body weight, height, Body Mass Index (BMI), body fat mass index, distance on the 6MWT, and change in Heart Rate (HR) following the 6MWT.
Results
The prediction equation was VO2peak=17.59+0.028 {6MWT(m)}–0.256{BMI (kg/m2)}–2.567 (gender: 0 male, 1 female)±3.25 ml•kg-1•min-1 (R2=0.48). A strong correlation (r=0.70, p<0.01) between predicted and measured calorimetry VO2peak values was obtained; yet, a poor concordance based on Lin’s coefficient (r=0.61).
Conclusion
A VO2peak prediction equation with high accuracy and highly correlated to directly-measured VO2peak was developed for urban Costa Rican older adults. Non-specific population equations are not valid to predict VO2peak in urban Costa Rican older adults.
Introduction
The older adult population has dramatically increased worldwide; for most countries, life expectancy is higher than it was 50 years ago. In Japan, more than 30% of the population is older than 65 years while in Costa Rica, the average age is 73.3 years and, in Nicoya, a canton located in the North of the country, 80% of its inhabitants are older than 65 years. This place is considered a Blue Zone, one of the five places in the world where longest-lived people live [1,2].
Aging is a multidimensional process characterised by physical and mental changes that diminish functionalities, and affect independency and quality of life [3,4]. It is recognised that after the age of 30, humans begin an accelerated aging process where physical function declines at a rate of 0.75% to 1% annually; where deleterious physical function changes are more evident after the age of 60 [4]. Functional ability is associated with health and physical performance independent of the age. Physical performance has been related to mortality and muscular function related variables (e.g., walking speed, balance, strength) [4].
The peak oxygen uptake (VO2peak) is defined as the maximum oxygen uptake reached by a subject in a period, and it is usually determined by indirect calorimetry (“gold standard”) during a Gradual maximal Exercise Tests (GXT). The oxygen is transported in the blood and used in the muscle to re-synthesise ATP to convert chemical into mechanical energy during muscular contraction [5,6]. Therefore, VO2peak is an indicative of cardiovascular function or cardiovascular fitness closely associated to quality of life in all populations.
The gold standard used to measure VO2peak provides the most valid and accurate values; however, the technique requires expensive equipment, usually well-trained staff and using a complex treadmill or cycle ergometer protocol for a specific population. Therefore, indirect methods have been used to estimate VO2peak; for instance, the 1-mile walking test, 1.5-mile running test, 600 yards walking/jogging, and the Six Minutes Walking Test (6MWT) [7,8].
The decision of using a maximal or sub-maximal test depends on the materials and/or the equipment at hand, but especially on the participant’s number of risk factors. One of the most recommended indirect technique for estimating VO2peak in older adults is the 6MWT [9]. This protocol is inexpensive, it follows simple instructions, it requires just a few materials and it is safe since during the 6MWT, the majority of older adults reach 80% of their VO2peak [10]. The 6MWT measures the distance an individual is able to walk over a total of six minutes on a hard, flat surface. The participants have to walk as fast as they can, neither jogging nor running [11]. This test was originally designed for patients with heart failure and respiratory diseases [7]. It has been suggested that the distance achieved during the test predicts aerobic capacity and mortality [7,12].
There are equations for the 6MWT developed using predictive variables such as gender, body weight, body height, Heart Rate (HR), and Body Mass Index (BMI=body weight in kg/body height in m2). These equations have been developed in different geographical locations; consequently, these equations should not be used interchangeably as a “one equation fits all”. For example, equations for Koreans [13], Indians [14,15], and Brazilians [16] have been developed but these should not be used around the world. We face the same inconvenience with predictive equations to determine VO2peak using the distance in the 6MWT as a predictive variable [Table/Fig-1].
Selected oxygen uptake prediction equations. Predicted values are mL·kg-1·min-1.
| Reference | Equation | Characteristics |
|---|
| [17] | VO2max=0.03×6MWT(m)+3.98±3.32 | r=0.64r2=0.42p<0.001SEE=3.32 mL·kg-1·min-1.Sample: 45 people with cardiac risk factors.Location: MassachusettsMean age: 49±8 yr. |
| [18] | VO2max=0.01426×6MWT(m)+7.222±2.48 | r=0.54r2=0.29p<0.001SEE=2.48 mL·kg-1·min-1.Sample: 97 men and women with cardiac risks.Age: older than 65 yr. |
| [19] | VO2peak=0.0105×6MWT(m)+0.0238×age (yr.)×0.03085×weight(kg)+5.598 | r=0.65r2=0.42p<0.01Sample: 65 cardiac risk Nigerian peopleAge: not reported |
| [20] | VO2max=26.9+0.014×6MWT(m)–0.38×BMI(kg/m2) | 6MWT and VO2max (r=0.22, p=0.02)BMI and VO2max (r=–0.382, p<0.001)Sample: 97 French obese youthAge: 7-17.8 yr. |
These equations were developed on participants from the United States [17,18], Nigeria [19], and France [20]. Some of these equations were developed using heart failure participants. Presently, no VO2peak equations have been developed on healthy Latin American older adults. Therefore, the purpose of this study was to develop an equation to predict the VO2peak in Costa Rican older adults using the 6MWT and selected anthropometrical predictor variables. A secondary aim was to compare the new equation to previously published equations.
Materials and Methods
Design and Participants
A cross-sectional correlational design was used [21]. The sample consisted of 79 urban Costa Rican older adults (26 men and 53 women). Participants underwent a comprehensive medical assessment prior to engaging in the testing. Medical records indicated that participants did not have injuries, disabilities or gait problems that prevented them from walking, or any significant cardiovascular or metabolic problems.
Measurement Instruments
Anthropometric equipment included a freestanding stadiometer (Novel Products Inc., model DES 290-337, Rockton, IL, USA) with a precision of 0.5 cm used to measure body height (cm). Body weight (kg) was measured using a Camry electronic balance (model EB 9021, City Industry, CA, USA), with a precision of 100 g. The BMI was calculated using the two previous measures. Fat mass (%) was measured using Dual-energy X-ray absorptiometry (DXA), on General Electric Lunar Prodigy Advance equipment (General Electric, Madison, WI, USA).
The VO2peak (ml·kg-1·min-1) was measured using a Jaeger CPX metabolic cart (CareFusion Corporation, San Diego, CA, USA), and 12-lead ECG. The GXT was performed on a HP Cosmos treadmill (model LE 300 CE, Germany) using the modified Balke protocol. This protocol consists of one-minute warm-up and 11 stages of 2 minute activity. In every stage the elevation and/or the speed were increased. A two-minute recovery stage was given at the end of the test.
The 6MWT consisted of walking on a flat surface, as fast as the subject could for 6 minutes [22]. This test has a high test re-test reliability (r=0.90-0.96) and a convergent validity with a treadmill VO2 test (r=0.71-0.81) [23]. To measure the distance, a Komelon odometer (Korea) was used. The HR percentage change was calculated as HR (Δ%)={(HRafter-HRbefore)/HRbefore}×100, using a FaceLake fingertip pulse oximeter model CM550DL (FaceLake, Lake Bluff, IL, USA) measuring the HR before and after performing the 6MWT.
Procedures
To conduct the study the Helsinki Declaration of 1975 (revised in 2000) was followed and the Scientific Ethics Committee of the University of Costa Rica approved the protocol.
The participants were given appointments to the Human Movement Sciences Research Centre (CIMOHU) for all testing. Upon arrival, each participant read and signed the informed consent. Secondly, they were weighted and measured for height. Third, they were asked to lie down on the DXA bed and they were scanned to analyse the percentages of lean mass and fat mass. Then, the pulse oximeter was placed in the index finger for 10 seconds to measure HR before the 6MWT. After this, the participants performed the 6MWT. All the participants were instructed to walk in a self-pace, without running. Once the time was over, a mark was placed to identify exactly where everyone finished and to measure the distance with the odometer. Immediately, a post-6MWT HR was measured.
Following a 10-minute recovery period from the 6MWT, participants were prepared to perform the VO2peak treadmill test. Laying down and relaxed, 12 electrodes were placed on the subject’s chest, so a physician could monitor the heart’s electrical activity during the test. Participants wore an exhaled air collection mask properly attached to the metabolic cart. Everyone was instructed about the modified Balke protocol, and the test was finished when at least two of the following criteria were met: 1) the participant’s request to stop the test; 2) the VO2 was unchanged in spite of an increase in workload; 3) the respiratory exchange ratio was higher than or equal to 1.1; 4) the HR was higher than 100% of the participant’s age-predicted maximal HR [19].
Statistical Analysis
The statistical packages used to analyse data were the IBM-SPSS version 23 (IBM Corporation, Armonk, NY) and the MedCalc, version 16.8 (Ostend, Belgium). The statistical significance was established a priori in p<0.05. Descriptive statistics mean and standard deviation (M±DE) are reported for all variables. With continuous data, a prediction model of aerobic power using a multiple linear regression analysis was made in which the criteria variable or dependent (Ŷ) was VO2peak. The model studied was Ŷ=a+b1(X1)+b2(X2)+bn(Xn)±standard error of the estimate, in which Ŷ is the dependent variable and X represents every predictive variable that enters in the model. The predictor or independent variables (Xn) were: 1) body height; 2) body weight; 3) ΔHR; 4) body fat%; 5) lean body mass; and 6) BMI. Predictive variables were continuous and they were included in the regression model using the “stepwise” method. The regression assumptions of normality, homoscedasticity, and linearity were also studied [24].
Comparisons were made between current data and previous aerobic power equations [Table/Fig-1]. To study associations, differences and concordance, the Pearson correlation coefficient, a repeated measures t-test, and Lin’s concordance correlation coefficient [25] were computed, respectively. Indeed, differences were obtained between VO2peak values from calorimetry and predicted values using the equations presented in [Table/Fig-1]. Concordance was defined as poor (<0.90), moderate (0.90-0.95), substantial (0.95-0.99) or almost perfect agreement >0.99) based on Lin’s coefficient [25]. The concordance was visually analysed using a Bland-Altman plot [26].
Results
The descriptive statistics for the 79 Costa Rican older adults is presented in [Table/Fig-2]. The age, the BMI, and the % HR changes are similar between men and women. There were differences in body weight, body height, VO2peak, 6MWT, body fat percentage, and the percentage of lean mass between men and women, in which women showed higher fat percentage and men showed higher values in the remaining variables.
Descriptive statistics for Costa Rican older adults (n=79).
| Variables | Males (n=26) | Females (n=53) | p ≤ |
|---|
| M | SD | M | SD |
|---|
| Age (yr.) | 68.9 | 4.5 | 68.8 | 5.0 | 0.96 |
| BMI (kg/m2) | 27.1 | 3.9 | 27.7 | 5.4 | 0.72 |
| Weight (kg) | 75.8 | 14.3 | 65.9 | 11.9 | 0.01 |
| Height (cm) | 166.8 | 7.3 | 154.8 | 5.7 | 0.01 |
| VO2peak (ml·kg-1·min-1) | 25.9 | 4.3 | 21.5 | 3.8 | 0.01 |
| 6MWT (m) | 541.6 | 59.3 | 478.6 | 59.0 | 0.01 |
| HR (Δ%) | 65.6 | 30.3 | 67.0 | 24.5 | 0.83 |
| Body fat mass (%) | 30.6 | 7.4 | 42.4 | 6.4 | 0.01 |
| Lean mass (%) | 66.8 | 7.0 | 55.8 | 6.1 | 0.01 |
BMI: Body mass index; 6MWT: Six-minutes walking test; HR: Heart rate percentage change
The multiple linear regression model analysed included only the predictor variables 6MWT, BMI, and gender (R2=0.48). The equation is as follows: VO2peak (mL·kg-1·min-1)=17.59+0.028{6MWT (m)}–0.256{BMI (kg/m2)}–2.567 (Gender)±3.25 mL·kg-1·min-1, where gender is defined as 0=men and 1=women.
The equations shown in [Table/Fig-1] predicted values, in mL·kg-1·min-1 of 19.0±1.9 [17], 14.3±0.9 [18], 14.3±0.9 [19], 23.5±2.3 [20] compared to 23.3±3.1 (current study). All values were compared with the obtained gold standard (22.9±4.4) [Table/Fig-3].
Correlation, difference and concordance between the VO2peak obtained from the prediction equations and the VO2peak obtained from the gold standard in the current study.
| Reference | [17] | [18] | [20] | [19] | Current Study |
|---|
| Pearson’s correlations | 0.61 | 0.61 | 0.54 | 0.39 | 0.70 |
| t-test differences | p<0.01 | p<0.01 | p>0.05 | p<0.01 | p>0.05 |
| Lin’s concordance | 0.27 | 0.05 | 0.43 | 0.03 | 0.61 |
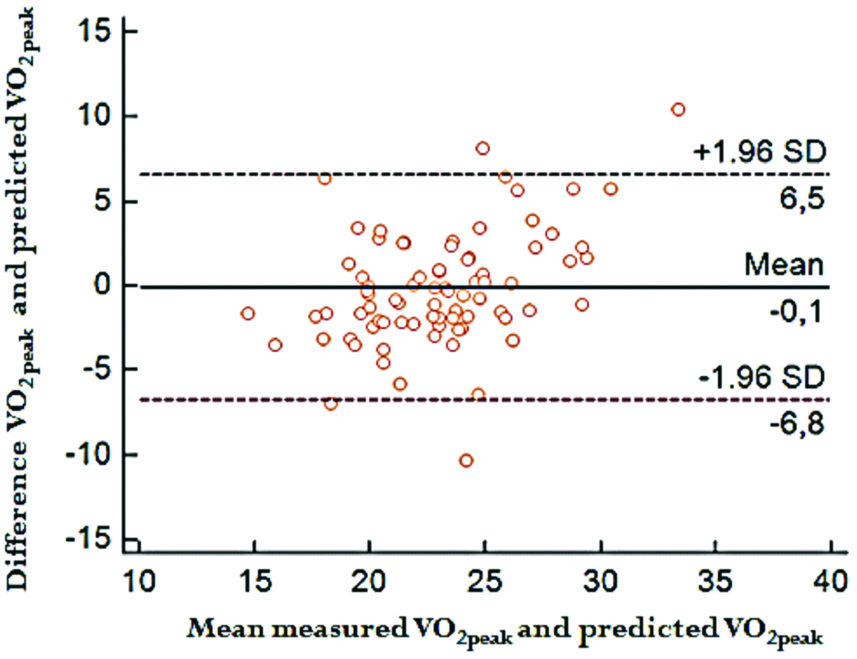
All the associations were significant; however, the highest correlation was the obtained with the new equation derived from the current study (r=0.70, p<0.05). In regards to the differences, the VO2peak obtained with the equations by Cahalin LP et al., [17], Maldonado-Martin S et al., [18], and Adedoyin R et al., [19] were different (p<0.01) to the directly-measured VO2peak. The values obtained with Vanhelst J et al., and the equation obtained in the current study did not differ with the directly-measured VO2peak [20]. In relation to the concordance, all the predicted values had a poor concordance (r<0.61) when compared to directly-measured VO2peak values. Concordance is shown in the Bland-Altman graphic [Table/Fig-4].
Bland-Altman graph with VO2peak predicted values and the VO2peak measured with the gold standard.
Discussion
The aim of this study was to develop a VO2peak prediction equation for urban Costa Rican adults over 60 years. The main finding of this study was that the new equation was accurate (±3.25 ml·kg-1·min-1) and highly correlated to directly-measured VO2peak. The predicted values based on this new equation have a positive and significant correlation with the true measured VO2peak; however, the consistency between these two values is poor based on Lin’s standards [25]. The equations previously published do not accurately predict VO2peak in Costa Rican older adults since these were developed for American (mainly US), Nigerian, and French populations who have different anthropometric and physical characteristics compared to Latin Americans. The geographical difference does not only exist with equations to predict VO2peak but also for other equations. Casanova C et al., conducted a study aimed at developing an equation for predicting distance in the 6MWT [27]. In the study, data on 444 participants from seven countries were analysed. The authors reported differences in the distance covered and developed a prediction equation; however, cautioned about using the equation in different populations. Therefore, it seems mandatory to develop new equations with samples with similar features [27].
In Singapore, a study confirmed this geographical difference. The researchers tried to validate an equation to predict the distance in the 6MWT; however, the equation was developed for Caucasians. Significant differences were found between the measured distance and the estimated one, with higher predicted than the measured distance (mean difference=75 m) [28]. The study by Carpio-Rivera E et al., in a Costa Rican sample supports the contention that geographical difference exists when predicting physiological variables [29]. The study was designed to determine if an equation-predicted body adiposity index was valid to estimate body fat mass (%) in Costa Rican university students. One hundred ninety-nine students were evaluated, using DXA as the “gold standard” and it was found that the body adiposity index predicted values were different from true measures [29].
In addition, there are also geographical differences within every country when estimating physical variables from prediction equations. For instance, a prediction equation for the distance people could walk in the 6MWT was developed in India with subjects from the southern and the northern regions of the country. When the equation developed for people from the West India was applied, the authors found that the equation significantly overestimated the true distance measured [14]. The opposite occurred in Brazil, where researchers analysed an equation to predict the distance in the 6MWT. Three regions were studied, southeast (n=194), south (n=271), and northeast (n=152). No differences between-regions were found in the predicted and the measured distances in the 6MWT [16].
Limitation
This study has some limitations. First, the study only included urban older adults physically-able to perform laboratory and field tests; therefore, institutionalised older adults, who had different locomotion, cognitive and cardiovascular characteristics were not included. That group of elderly requires further examination. Secondly, the regression model might have included more predictive variables to increase the statistical power of the estimates. Therefore, new VO2peak predictive models are needed when studying older adults.
Conclusion
A VO2peak prediction equation for urban Costa Rican adults over 60 years was developed with an accuracy of ±3.25 mL·kg-1·min-1 and highly correlated to directly-measured VO2peak. It was also concluded that non-specific population equations are not valid to predict VO2peak in urban Costa Rican older adults. The new equation developed in this study explains almost 50% of the variance and has a small predictive error. It is recommended to use a predictive equation that has been developed based on subjects with similar geographical characteristics and to include more independent variables in order to explain a wide range of variance of VO2peak in older adults.
BMI: Body mass index; 6MWT: Six-minutes walking test; HR: Heart rate percentage change
[1]. Rosero-Bixby L, Dow WH, Rehkopf DH, The Nicoya region of Costa Rica: a high longevity island for elderly malesVienna Yearbook of Population Research 2013 11:109-36.Epub 2013/01/0110.1553/populationyearbook2013s109 [Google Scholar] [CrossRef]
[2]. World Health Organization. World record on aging and health. Geneve, Switzerland: World Health Organization; 2015 [Google Scholar]
[3]. Hassel E, Stensvold D, Halvorsen T, Wisloff U, Langhammer A, Steinshamn S, Association between pulmonary function and peak oxygen uptake in elderly: the Generation 100 studyRespiratory Research 2015 16:156Epub 2015/12/3110.1186/s12931-015-0317-026715058 [Google Scholar] [CrossRef] [PubMed]
[4]. Yoon B-K, Kim C-H, Lim H-J, Kim Y-S, Im J-A, Paik I-Y, Association of physical performance and health-related factors among elderly Korean subjectsInternational Sport Med Journal 2009 10(4):205-15. [Google Scholar]
[5]. McArdle WD, Katch FI, Katch VL, Exercise physiology: nutrition, energy, and human performance 2015 Baltimore, MDLippincott Williams & Wilkins [Google Scholar]
[6]. Opasich C, Pinna GD, Bobbio M, Sisti M, Demichelis B, Febo O, Peak exercise oxygen consumption in chronic heart failure: toward efficient use in the individual patientJournal of the American College of Cardiology 1998 31(4):766-75.Epub 1998/04/0310.1016/S0735-1097(98)00002-3 [Google Scholar] [CrossRef]
[7]. Guerra-Balic M, Oviedo GR, Javierre C, Fortuno J, Barnet-Lopez S, Nino O, Reliability and validity of the 6-min walk test in adults and seniors with intellectual disabilitiesResearch in developmental disabilities 2015 47:144-53.Epub 2015/10/0210.1016/j.ridd.2015.09.01126426514 [Google Scholar] [CrossRef] [PubMed]
[8]. Teramoto S, Ohga E, Ishii T, Yamaguchi Y, Yamamoto H, Mastsuse T, Reference value of six-minute walking distance in healthy middle-aged and older subjectsThe European Respiratory Journal 2000 15(6):1132-33.Epub 2000/07/0810.1034/j.1399-3003.2000.01525.x10885436 [Google Scholar] [CrossRef] [PubMed]
[9]. American College of Sports MedicineACSM’s Guidelines for Exercise Testing and Prescription 2018 10th edPhiladelphia, PAWolters Kluwer, Lippincott Williams & Wilkins [Google Scholar]
[10]. Kervio G, Carre F, Ville NS, Reliability and intensity of the six-minute walk test in healthy elderly subjectsMedicine and Science in Sports and Exercise 2003 35(1):169-74.Epub 2003/01/2510.1097/00005768-200301000-0002512544651 [Google Scholar] [CrossRef] [PubMed]
[11]. da Cunha-Filho IT, Pereira DAG, de Carvalho AMB, Campedeli L, Soares M, de Sousa Freitas J, The reliability of walking tests in people with claudicationAmerican Journal of Physical Medicine & Rehabilitation 2007 86(7):574-82.10.1097/PHM.0b013e31806de72117581292 [Google Scholar] [CrossRef] [PubMed]
[12]. Golpe R, Perez-de-Llano LA, Mendez-Marote L, Veres-Racamonde A, Prognostic value of walk distance, work, oxygen saturation, and dyspnea during 6-minute walk test in COPD patientsRespiratory Care 2013 58(8):1329-34.Epub 2013/01/1710.4187/respcare.0229023322886 [Google Scholar] [CrossRef] [PubMed]
[13]. Kim JW, Jeon YJ, Baek DH, Kim TN, Chang JS, Percentage of the population at high risk of osteoporotic fracture in South Korea: analysis of the 2010 Fifth Korean National Health and Nutrition Examination survey dataOsteoporosis international: a journal established as result of cooperation between the European Foundation for Osteoporosis and the National Osteoporosis Foundation of the USA 2014 25(4):1313-19.Epub 2013/12/1910.1007/s00198-013-2595-z24345885 [Google Scholar] [CrossRef] [PubMed]
[14]. Fernandes L, Mesquita AM, Vadala R, Dias A, Reference Equation for Six Minute Walk Test in Healthy Western India PopulationJournal of Clinical and Diagnostic Research: JCDR 2016 10(5):CC01-04.Epub 2016/07/21 [Google Scholar]
[15]. Vaish H, Ahmed F, Singla R, Shukla DK, Reference equation for the 6-minute walk test in healthy North Indian adult malesThe international Journal of Tuberculosis and Lung Disease: The Official Journal of the International Union against Tuberculosis and Lung Disease 2013 17(5):698-703.Epub 2013/04/1210.5588/ijtld.12.047423575339 [Google Scholar] [CrossRef] [PubMed]
[16]. Britto RR, Probst VS, de Andrade AF, Samora GA, Hernandes NA, Marinho PE, Reference equations for the six-minute walk distance based on a Brazilian multicenter studyBrazilian Journal of Physical Therapy 2013 17(6):556-63.Epub 2013/11/2610.1590/S1413-3555201200500012224271092 [Google Scholar] [CrossRef] [PubMed]
[17]. Cahalin LP, Mathier MA, Semigran MJ, Dec GW, DiSalvo TG, The six-minute walk test predicts peak oxygen uptake and survival in patients with advanced heart failureChest 1996 110(2):325-32.Epub 1996/08/0110.1378/chest.110.2.3258697828 [Google Scholar] [CrossRef] [PubMed]
[18]. Maldonado-Martin S, Brubaker PH, Kaminsky LA, Moore JB, Stewart KP, Kitzman DW, The relationship of a 6-min walk to VO(2 peak) and VT in older heart failure patientsMedicine and science in sports and exercise 2006 38(6):1047-53.Epub 2006/06/1610.1249/01.mss.0000222830.41735.1416775543 [Google Scholar] [CrossRef] [PubMed]
[19]. Adedoyin R, Adeyanju S, Balogun M, Adebayo R, Akintomide A, Akinwusi P, Prediction of functional capacity during six–minute walk among patients with chronic heart failureNigerian Journal of Clinical Practice 2010 13(4):379-81. [Google Scholar]
[20]. Vanhelst J, Fardy PS, Salleron J, Beghin L, The six-minute walk test in obese youth: reproducibility, validity, and prediction equation to assess aerobic powerDisability and Rehabilitation 2013 35(6):479-82.Epub 2012/07/1210.3109/09638288.2012.69958122779759 [Google Scholar] [CrossRef] [PubMed]
[21]. Campbell DT, Stanley JC, Experimental and quasi-experimental designs for researchHandbook of research on teaching 1963 Chicago, ILRand McNally [Google Scholar]
[22]. American Toracic SocietyATS statement: guidelines for the six-minute walk testAmerican Journal of Respiratory and Critical Care Medicine 2002 166(1):111-17.Epub 2002/07/0210.1164/ajrccm.166.1.at110212091180 [Google Scholar] [CrossRef] [PubMed]
[23]. Rikli RE, Jones CJ, Senior fitness test manual 2013 2nd edChampaign, ILHuman Kinetics [Google Scholar]
[24]. Pedhazur EJ, Pedhazur Schmelkin L, Measurement, design and analysis: An integrated approach 1991 New York, NYTaylor & Francis [Google Scholar]
[25]. Lin KL, A concordance correlation coefficient to evaluate reproducibilityBiometrics 1989 45(1):255-68.10.2307/2532051 [Google Scholar] [CrossRef]
[26]. Bland JM, Altman DG, Statistical methods for assessing agreement between two methods of clinical measurementThe Lancet 1986 327(8476):307-10.10.1016/S0140-6736(86)90837-8 [Google Scholar] [CrossRef]
[27]. Casanova C, Celli BR, Barria P, Casas A, Cote C, de Torres JP, The 6-min walk distance in healthy subjects: reference standards from seven countriesThe European Respiratory Journal 2011 37(1):150-56.Epub 2010/06/0810.1183/09031936.0019490920525717 [Google Scholar] [CrossRef] [PubMed]
[28]. Poh H, Eastwood PR, Cecins NM, Ho KT, Jenkins SC, Six-minute walk distance in healthy Singaporean adults cannot be predicted using reference equations derived from Caucasian populationsRespirology (Carlton, Vic) 2006 11(2):211-16.Epub 2006/03/2210.1111/j.1440-1843.2006.00820.x16548908 [Google Scholar] [CrossRef] [PubMed]
[29]. Carpio-Rivera E, Hernández-Elizondo J, Salicetti-Fonseca A, Solera-Herrera A, Moncada-Jiménez J, Predictive validity of the body adiposity index in Costa Rican studentsAmerican Journal of Human Biology 2016 28(3):394-97.10.1002/ajhb.2280026503822 [Google Scholar] [CrossRef] [PubMed]