Hypertensive diseases of pregnancy, particularly preeclampsia/eclampsia, remain one of the leading causes of maternal morbidity and mortality worldwide [1]. Preeclampsia is a systemic disease involving multiple organ dysfunctions that occurs exclusively during pregnancy. Preeclampsia is affecting 1.3-6.7% of all human pregnancies [2]. It is a significant contributor to the estimated 15 million preterm births annually worldwide [3].
Maternal systemic inflammation has been implicated as a key determinant in the pathogenesis of preeclampsia. In placental circulation, pro-inflammatory cytokines such as interleukins are thought to be potentially leading to the increased vascular resistance and pregnancy failure and/or preeclampsia [4-6].
Betatrophin is a secreted protein expressed in liver and fat. It causes a specific increase in pancreatic beta cell replication. This increase in beta cell mass improves glycaemic control [7]. Induced insulin resistance is a known potent stimulator of betatrophin expression in liver and fat tissue. This plays a key role in pathogenesis of diabetes [8].
Betatrophin is shown to be a novel adipokine in pathophysiology of metabolic disorders. It plays a role in glucose and lipid metabolism and is associated with diabetes mellitus, obesity and metabolic syndrome [9]. Pregnant diabetic women have an increased risk of developing obstetric complications such as pre-eclampsia and preterm delivery and perinatal complications such as miscarriages and fetal malformations [10]. Yet, the function of betatrophin is still unclear in preeclampsia and hypertensive disorders in pregnancy. In this study, the aim was to investigate the relationship between betatrophin levels and the occurrence/severity of preeclampsia.
Materials and Methods
This prospective cross-sectional study was conducted at the Obstetrics and Gynecology clinic of Kartal Dr. Lutfi Kirdar Education and Research Hospital during July-December 2015. The study design was approved by the Hospital’s Ethics Committee (89513307/1009/522), and informed consent was obtained from all participants.
The study group was composed of 73 women diagnosed with preeclampsia and 76 healthy pregnant controls matched for age, Body Mass Index (BMI) and gestational age.
The objective in sample selection was to capture all the preeclampsia patients visiting the clinic during the 6-month study period and matching them one on one with a healthy pregnant patient to form the control group. Initially, the preeclampsia group consisted of 78 women who were deemed to be suitable for the study, in approximately more than 100 patients with this diagnosis. Control group was formed by matching each preeclampsia patient with a healthy pregnant woman who visited the clinic on the same day or shortly thereafter using the characteristics mentioned above. Five patients in the preeclampsia group and two patients in the control group were removed from the sample as they decided to receive follow-up care in other hospitals.
Women with chronic diseases such as diabetes mellitus, thyroid disorder, chronic renal or hepatic disorder, connective tissue disorder or pregnancies with multiple gestations, congenital fetal anomaly, premature rupture of membranes, polyhydramnios, infective disorders, usage of anticoagulant, antihypertensive, antihyperlipidemic drugs were excluded from the study. Preeclampsia was diagnosed according to the criteria of American College of Obstetrics and Gynecology (ACOG), 2013 [11]. The criteria were as follows: the presence of hypertension after the 20th week of gestation (systolic blood pressure ≥140 mmHg or diastolic blood pressure ≥90 mmHg on two occasions at least 4-hour apart), proteinuria (≥300 mg/24 h or ≥1+ by dipstick), thrombocytopenia (less than 100,000/μL), renal insufficiency, impaired liver function, visual or cerebral symptoms, pulmonary oedema. Women with preeclampsia were divided into two groups in terms of severity of the disease. Severe preeclampsia was defined if one or more of the following: systolic blood pressure≥160 mmHg or diastolic blood pressure ≥110 mmHg on two measurements 4-hour or more apart, thrombocytopenia (less than 100,000/μL), impaired liver function, visual or cerebral disturbance, progressive renal insufficiency or pulmonary oedema [11]. Those who were diagnosed with preeclampsia but did not meet any of these criteria were placed into the mild preeclampsia group.
For each participant, demographic data was collected. BMI (kg/m2) was calculated as weight before gestation/height squared. Venous blood samples were drawn and centrifuged at 3,500 rpm for 10 minutes. The sera were separated and kept frozen at -80°C until assayed. Determination of serum glucose, insulin, Aspartate Aminotransferase (AST), Alanine Aminotransferase (ALT), uric acid, creatinine levels were performed by standard laboratory methods. HOMA-IR was calculated using the following formula: HOMA-IR=(fasting glucose (mg/dL) * fasting insulin (μU/mL))/405. A 24-hour urinary protein excretion levels were analysed for only preeclamptic patients. Measurement of serum betatrophin concentrations were performed by enzyme-linked immunosorbent assay (Aviscera Bioscience, Santa Clara, CA, USA), according to the manufacturer’s instructions. Intraassay and interassay coefficients of variations were <4-6% and <8-10%.
Statistical Analysis
All data were analysed using the Statistical Package for the Social Sciences (SPSS) version 17 program (SPSS Inc., Chicago, IL, USA). Distribution of data was evaluated with Kolmogorov-Smirnov test. Results were presented as medians (interquartile range) except for normally parameters that are presented as mean±SD. The data with normal distribution were analysed with one-way ANOVA test whereas data without normal distribution were evaluated with Kruskal-Wallis test. Correlations between betatrophin and biochemical markers were assessed using Spearman’s correlation test. Results were evaluated with 95% confidence intervals and the level of significance was indicated as p<0.05.
Results
The baseline characteristics of the study participants are summarized in [Table/Fig-1]. The mean age for severe preeclampsia, mild preeclampsia, and control groups were 29.2, 30.0, and 28.8 years respectively. There were no significant differences between the groups with respect to age, gestational age and BMI levels. Systolic blood pressure, diastolic blood pressure and ALT levels were significantly different between all pairs of groups. Betatrophin levels were 2.2±0.6 in severe preeclampsia group, 2.0±0.5 in mild preeclampsia group, and 1.3±0.6 in control group. These results imply significant differences between severe preeclampsia and control groups (p<0.001) and mild preeclampsia and control groups (p<0.001). On the other hand, no significant difference was found between severe and mild preeclampsia groups [Table/Fig-1].
Baseline characteristics of study participants.
| SP(n=30) | MP(n=43) | C(n=76) | p-value SP vs. MP | p-value SP vs. C | p-value MP vs. C |
|---|
| Betatrophin (ng/ml) | 2.2±0.6 | 2.0±0.5 | 1.3±0.6 | 0.441 | <0.001 | <0.001 |
| Age (years) | 29.2±4.3 | 30.0±4.9 | 28.8±4.0 | 0.710 | 0.934 | 0.353 |
| BMI(kg/m2) | 25.8±2.9 | 25.7±3.8 | 24.7±2.4 | 1.000 | 0.251 | 0.348 |
| Gest. age (days) | 217.5 (195.2-237) | 217 (197-236) | 223.5 (203-239.7) | 0.650 | 0.110 | 0.222 |
| SBP (mmHg) | 180 (168.7-190) | 145 (140-150) | 100 (90-120) | <0.001 | <0.001 | <0.001 |
| DBP (mmHg) | 105 (100-111) | 90 (85-95) | 65 (60-70) | <0.001 | <0.001 | <0.001 |
| 24-hour urine (mg/24 h) | 3135 (1528-4196) | 1580 (956-2789) | Na | 0.004 | na | na |
| HOMA-IR | 1.7 (1.2-2.6) | 1.6 (1.3-2.4) | 1.3 (1.0-1.4) | 0.946 | <0.001 | <0.001 |
| AST (U/L) | 19 (12-35.5) | 11 (8-13) | 9 (7.25-12) | <0.001 | <0.001 | 0.056 |
| ALT (U/L) | 17 (13.7-35.2) | 12 (9-14) | 9 (8-11) | <0.001 | <0.001 | <0.001 |
| Platelet count (103 /μL) | 112.8±50.1 | 215.2±56.5 | 236.1±47.4 | <0.001 | <0.001 | 0.083 |
| Uric acid (mg/dL) | 5.4±1.6 | 4.5±1.6 | 3.5±0.8 | 0.103 | <0.001 | 0.002 |
| Creatinine (mg/dL) | 0.6 (0.5-0.8) | 0.4 (0.4-0.5) | 0.4 (0.4-0.5) | <0.001 | <0.001 | 0.356 |
Baseline characteristics of severe preeclampsia (SP), mild preeclampsia (MP) and control (C) groups. Data are reported as medians (interquartile range) except for normally parameters that are presented as mean±SD.
BMI: Body mass index; Gest. Age: Gestational age; SBP: Systolic blood pressure; DBP: Diastolic blood pressure; HOMA-IR: Homeostasis model assessment of insulin resistance; AST: Aspartate aminotransferase; ALT: Alanine aminotransferase
In all preeclampsia groups, betatrophin concentrations were correlated with diastolic blood pressure and HOMA-IR [Table/Fig-2]. Correlation between serum betatrophin and HOMA-IR was 0.564 in the severe preeclampsia group (p=0.001). This correlation decreased to 0.482 when mild preeclampsia group was added but still remained significant (p<0.001). A similar pattern is observed for correlation between betatrophin and DBP.
Univariate correlations between betatrophin and participant characteristics in the study population.
| SP | MP | SP+MP | SP+MP+C |
|---|
| Age | -0.013/0.945 | 0.088/0.576 | 0.034/0.777 | 0.066/0.420 |
| BMI | 0.321/0.084 | 0.082/0.603 | 0.167/0.157 | 0.171/0.037 |
| Gest. age | 0.286/0.126 | 0.109/0.487 | 0.173/0.142 | -0.003/0.976 |
| SBP | 0.349/0.059 | 0.046/0.770 | 0.213/0.070 | 0.551/<0.001 |
| DBP | 0.538/0.002 | 0.511/<0.001 | 0.481/<0.001 | 0.558/<0.001 |
| 24-hour urine | 0.089/0.641 | 0.224/0.148 | 0.201/0.089 | na |
| HOMA-IR | 0.564/0.001 | 0.468/0.002 | 0.482/<0.001 | 0.480/<0.001 |
| AST | 0.327/0.078 | 0.112/0.474 | 0.049/0.683 | 0.141/0.087 |
| ALT | 0.330/0.075 | 0.244/0.116 | 0.106/0.374 | 0.156/0.058 |
| Platelet count | 0.317/0.088 | 0.241/0.120 | 0.066/0.578 | -0.152/0.064 |
| Uric acid | 0.039/0.837 | -0.228/0.142 | -0.070/0.554 | 0.153/0.062 |
| Creatinine | 0.158/0.405 | 0.210/0.176 | 0.203/0.085 | 0.115/0.161 |
Univariate correlations between betatrophin and participant characteristics in severe preeclampsia (SP), mild preeclampsia (MP) and control (C) groups. The figures after the slashes are the p-values.
BMI: Body mass index; Gest. Age: Gestational age; SBP: Systolic blood pressure; DBP: Diastolic blood pressure; HOMA-IR: Homeostasis model assessment of insulin resistance; AST: Aspartate aminotransferase; ALT: Alanine aminotransferase
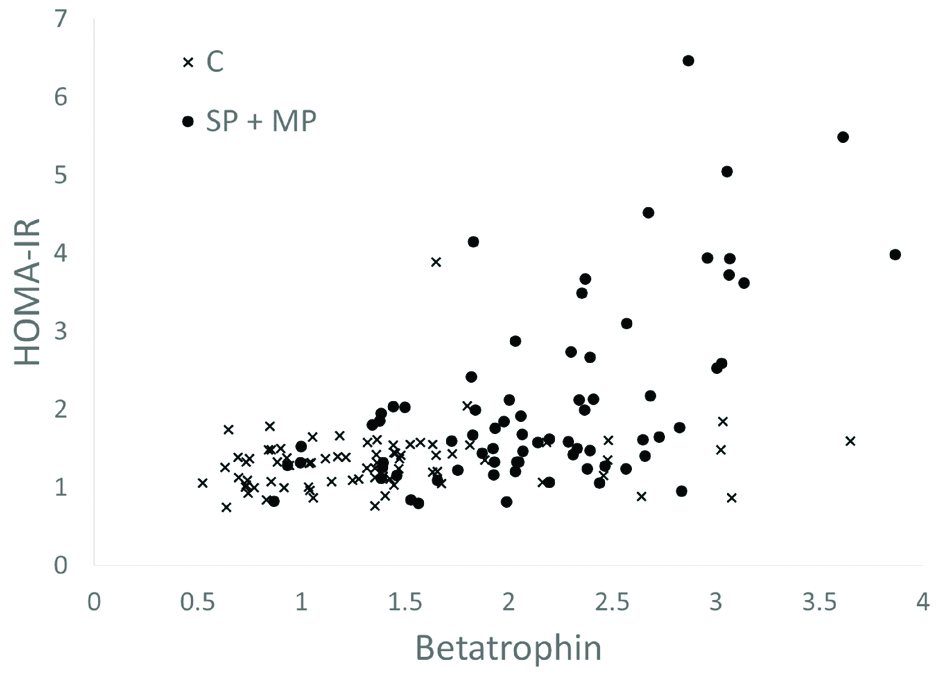
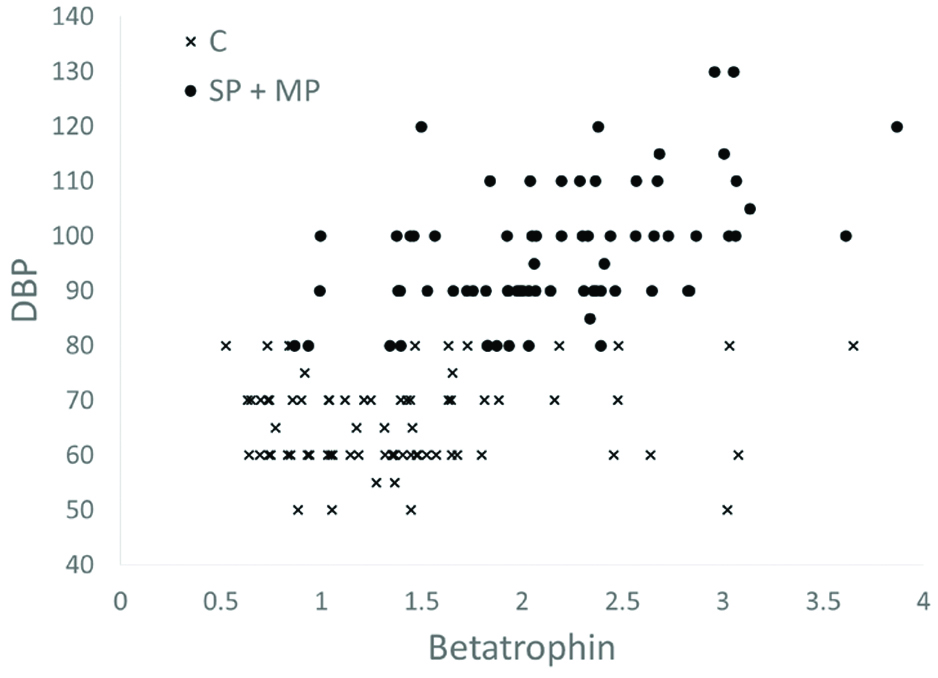
When the control group is also added to investigate the correlations among all study participants (last column of [Table/Fig-2]), contradictory results are obtained that appear to weaken the role of betatrophin as a predictor of preeclampsia (p<0.001). To understand the difference between the preeclampsia and control groups better scatter plots of betatrophin levels are drawn against HOMA-IR [Table/Fig-3] and DBP [Table/Fig-4].
Relationship between HOMA-IR values and betatrophin levels in Severe Preeclampsia (SP), Mild Preeclampsia (MP) and Control (C) Groups (Scatter Plot).
Relationship between Diastolic Blood Pressure (DBP) values and betatrophin levels in severe preeclampsia (SP), mild preeclampsia (MP) and control (C) groups (Scatter plot).
Discussion
In this study, the relationship between betatrophin and preeclampsia was investigated. Both severe and mild preeclampsia groups was analysed separately against the control group. It was concluded that both preeclampsia groups are significantly different from the control group with respect to betatrophin, systolic blood pressure, diastolic blood pressure, HOMA-IR, ALT and uric acid. More specifically, preeclampsia groups showed significantly higher levels of betatrophin compared to the control group.
In recent years, betatrophin’s relationship with diabetes, obesity, and metabolic syndrome has been frequently analysed and found significant. Ren G et al., gave betatrophin the name RIFL (refeeding induced in fat and liver) as they were induced during the adipogenesis [12]. In a study that investigated the relationship between lipid metabolism and preeclampsia, serum levels of a pro-adipogenic agent called growth arrest protein 6 (GAP6) have been shown to be significantly elevated in preeclampsia [13]. Similarly, the effects of betatrophin on glucose and lipid metabolism were determined in previous studies and various aspects are still under investigation [14-16].
Betatrophin is shown to be associated with diabetes mellitus, obesity and metabolic syndrome. In these situations, a significant increase in blood serum level is detected [17-20].
HOMA-IR values are found to be elevated in hypertension, diabetes, dislipidemia, and cardiovascular diseases. Several studies have shown a significant relationship between HOMA-IR and betatrophin levels. Especially in patients with gestational diabetes, the correlation between HOMA-IR and betatrophin was found to be positively correlated [21-23].
In this study, it was found that HOMA-IR values are not only significantly higher in preeclampsia groups, but also positively correlated with betatrophin levels. More remarkably, as shown in [Table/Fig-3], this positive correlation is predominantly driven by the presence of preeclampsia.
Adult metabolic syndrome is defined by a combination of elevated blood glucose, central obesity, elevated blood pressure, high triglycerides and low-high density lipoproteins cholesterol. Insulin resistance, an underlying pathology of the metabolic syndrome, also is a known risk factor for development of pregnancy complications such as Hypertensive Disorders of Pregnancy (HDP) comprising of gestational hypertension, preeclampsia/eclampsia and preeclampsia superimposed on chronic hypertension and Gestational Diabetes Mellitus (GDM). Indicating possible common pathophysiology, women with gestational diabetes mellitus are also at increased risk for preeclampsia [24,25].
Metabolic syndrome and its components: insulin resistance, diabetes, dislipidemia, and obesity were all shown to be significantly associated with betatrophin in several studies [14-21,23,26-28]. However, to the best of our knowledge, there has not been a single study that directly investigates the relationship between betatrophin and preeclampsia.
Conclusion
In this study, it was determined that betatrophin, which has been shown to be a significant adipokine in diabetes, obesity, and metabolic syndrome is also significantly elevated in the presence of preeclampsia. This is true for both severe and mild versions of this disease.
As this study was limited to a single hospital over a certain period of time, its findings may not readily be generalized for practical use. More specifically, its application in clinical practice should be determined only after further randomized trials.
As a result, betatrophin can be regarded as a predictive biomarker for early diagnosis and management of preeclampsia in high-risk pregnancies. Furthermore, in developing countries, maternal and fetal death rates can be reduced by implementing studies that focus on the evolution of this relationship over the pregnancy weeks.
Baseline characteristics of severe preeclampsia (SP), mild preeclampsia (MP) and control (C) groups. Data are reported as medians (interquartile range) except for normally parameters that are presented as mean±SD.
BMI: Body mass index; Gest. Age: Gestational age; SBP: Systolic blood pressure; DBP: Diastolic blood pressure; HOMA-IR: Homeostasis model assessment of insulin resistance; AST: Aspartate aminotransferase; ALT: Alanine aminotransferase
Univariate correlations between betatrophin and participant characteristics in severe preeclampsia (SP), mild preeclampsia (MP) and control (C) groups. The figures after the slashes are the p-values.
BMI: Body mass index; Gest. Age: Gestational age; SBP: Systolic blood pressure; DBP: Diastolic blood pressure; HOMA-IR: Homeostasis model assessment of insulin resistance; AST: Aspartate aminotransferase; ALT: Alanine aminotransferase