It is an established fact that there exists a relationship between cranial capacity and volume of the brain and this, in turn, can reflect an individual’s intelligence. This is proved by the fact that lower mammals have small head size compared to highly evolved human cranium. It was first reported in 1888 that, there is a quantitative relationship between human cranial capacity and mental ability [1]. Previous studies have found a positive association between human head size and intelligence and this has been associated with the rapid evolution of brain size in humanoids during the last 1-2 million years [2,3]. These studies also show that there was an association between an increase in BMI and reduction of brain volume. A significant reduction was found in the grey matter volume of obese subjects when compared to lean individuals. Previous studies also showed that IQ of obese children was lower than normal weight children. Obesity and IQ among school going children were inversely proportional and IQ level was significantly lower in severely obese children than the normal weight children. Further, there was no consensus on a relation between IQ and obesity as findings of the published studies were inconsistent [4]. Although, many studies have been done on estimating cranial capacity, no literature is available with respect to the comparison of cranial capacity with that of BMI and academic performance. Hence, the present study was conducted with the aim to assess the relationship of cranial capacity with BMI and with the academic performance of 100 first year medical students.
Materials and Methods
The present cross-sectional pilot study was conducted on 100 first year medical students of age group between 17 and 19 years studying in Sree Balaji Medical College and Hospital, Chennai, India. Being a pilot study, the sample size was not calculated and all students studying in first-year MBBS were included in the study and there were no exclusion criteria. After the approval of the Ethical Committee of Sree Balaji Medical College and Hospital (Ethical number: 1350), informed consent was taken from the students above 18 years and consent from parents/guardian for students below 18 years.
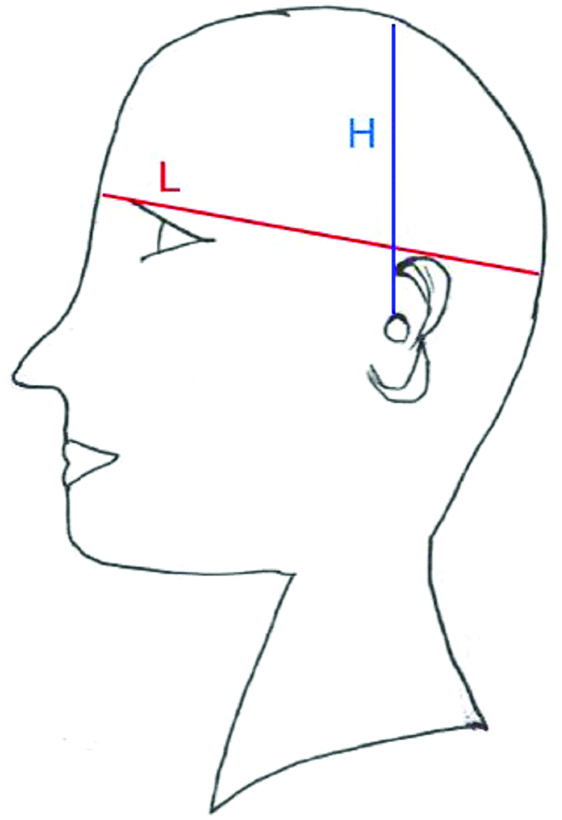
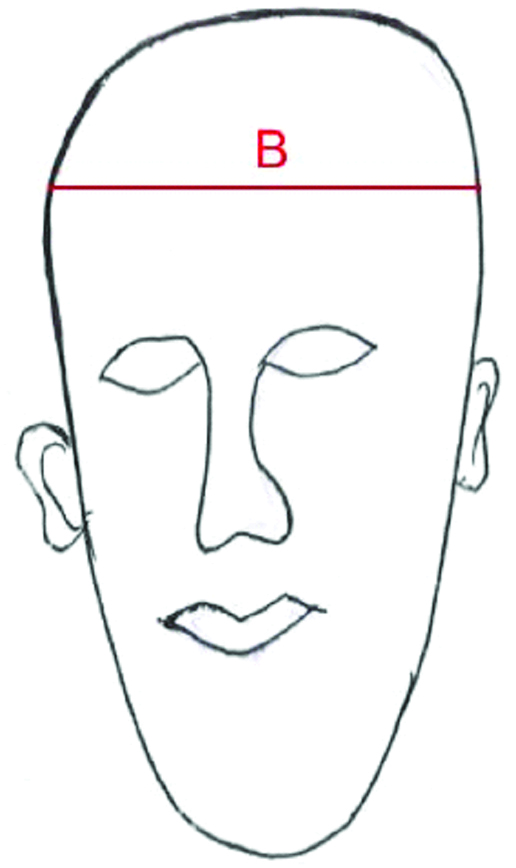
To estimate cranial capacity, linear measurements were taken using digital vernier calipers (Aerospace, India), and steel measuring tape. Length (L) was calculated from glabella to inion. Height (H) was calculated from auricular height measured from upper margin of external auditory meatus to vertex as in [Table/Fig-1]. Breadth (B) was determined by taking the distance between the two parietal eminences as depicted in [Table/Fig-2]. Using the above parameters, cranial capacity was calculated by the Lee-Pearson’s formula [5]. For Females, it is 0.000400 (L-11) (B-11) (H-11)+206.60 and for males, it is 0.000337 (L-11) (B-11) (H-11)+406.01 [5] and expressed as cm3. Weight was recorded using a digital weighing scale (Equinox, India) in kilograms. The height of the students was recorded in metres in an erect posture, cranium in Frankfurt’s horizontal plane, from the highest point on a vertex to the heel. BMI was calculated using the formula, Weight (kg)/Height2 (m2) and expressed in kg/m2.
Schematic diagram showing measurement of length (L) and height (H) of the cranium.
Schematic diagram showing measurement of breadth (B) of the cranium.
Academic performance during the first year MBBS was taken as a measure of intelligence of the students. The average of the total marks secured in internal assessments of all three subjects in first academic year namely Anatomy, Physiology and Biochemistry were recorded.
Statistical Analysis
All the above data were collected, tabulated and expressed as mean±standard deviation. The data were statistically analysed for correlation using the SPSS software, version-21.0. Two-tailed Pearson’s correlation test was used and r-value and p-value were obtained. Paired Student t-test was used for determining the significance between sexes.
Results
In the present study, of 100 students, mean cranial capacity was 1374.68±156.63 cm3 and was ranging from 1045.24 cm3 to 1658.19 cm3. Mean BMI was 22.2798±3.37 kg/m2 and was ranging from 12.95 kg/m2 to 33.08 kg/m2. Mean of marks was 44.7500±10.53 and was ranging from 17 to 68.
The Pearson’s correlation test was done to correlate cranial capacity with BMI and marks/academic performance. The correlation was also done between BMI and marks/academic performance [Table/Fig-3].
Pearson correlation test to correlate between cranial capacity, BMI and marks.
| Parameters | Cranial capacity | Body mass index | Marks |
|---|
| r | p-value | r | p-value | r | p-value |
|---|
| Cranial capacity | - | - | 0.296(**) | 0.003 | -0.036 | 0.722 |
| Body mass index | 0.296(**) | 0.003 | - | - | -0.200(*) | 0.046 |
| Marks | -0.036 | 0.722 | -0.200(*) | 0.046 | - | - |
r=Pearson’s correlation coefficient, p=significance value; *Correlation is significant at the 0.05 level (2-tailed); **Correlation is significant at the 0.01 level (2-tailed)
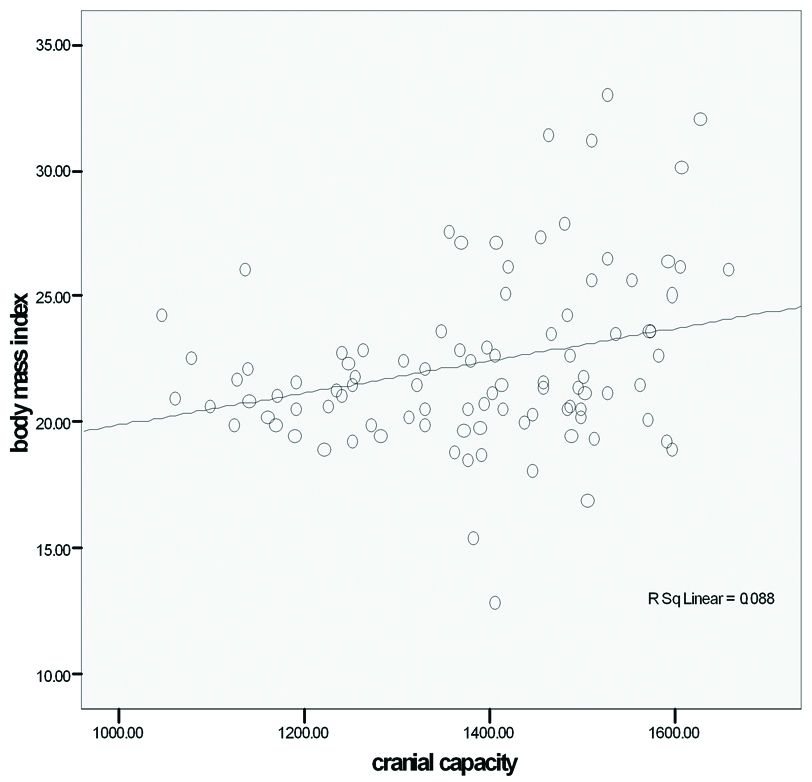
A positive correlation (r=0.296) was found between cranial capacity and BMI and it was statistically significant (p<0.01). An increase in BMI value showed an increase in cranial capacity value [Table/Fig-3,4].
Scatter plot showing relation between cranial capacity and BMI.
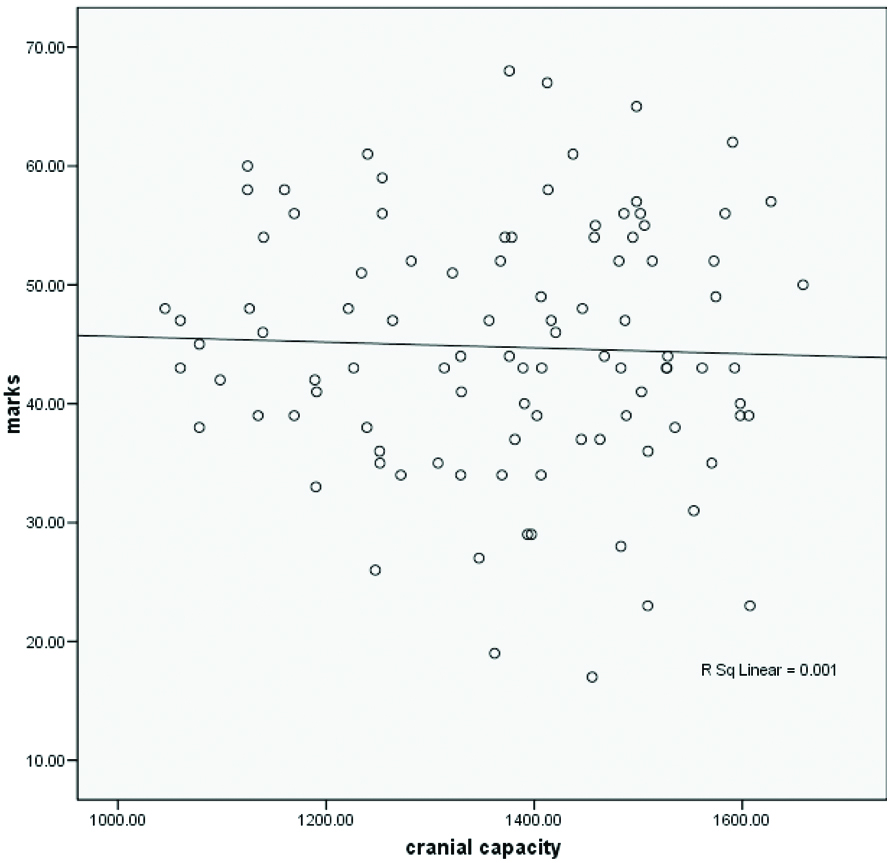
A negative correlation (r=-0.036) was found between cranial capacity and marks. However, the observed correlation was statistically not significant [Table/Fig-3,5].
Scatter plot showing relation between cranial capacity and marks.
A negative correlation (r=-0.200) was found between BMI and marks, which indicates that there is an inverse relation between BMI and marks, so, increase in BMI value will result in decrease in marks value /academic performance. The observed correlation was found to be statistically significant (p<0.05) [Table/Fig-3].
In this study, the cranial capacity of 56 male students ranged between 1444 cm3-1589 cm3 with a mean of 1483.22 cm3 and the cranial capacity of 44 female students ranged between 1238 cm3-1415 cm3 with a mean of 1236.54 cm3. A significant difference was observed in the cranial capacity between males and females. The observed difference was statistically significant (t=12.57; p<0.001) [Table/Fig-6].
Comparison of cranial capacity, BMI and marks with gender.
| Gender | n | Mean±SD | t | p-value |
|---|
| Cranial capacity | Male | 56 | 1483.22±82.91 | 12.572 | <0.001 |
| Female | 44 | 1236.55±113.25 |
| BMI | Male | 56 | 23±4.11 | 2.472 | 0.015 |
| Female | 44 | 21.36±1.74 |
| Marks | Male | 56 | 43.86±11.31 | -0.956 | 0.341 |
| Female | 44 | 45.89±9.45 |
t=test statistical value; p=significance value
Discussion
It is evident from past studies that there is a close relationship between cranial capacity and the size of the brain and hence, one of the areas commonly studied in physical anthropology [6,7]. Various studies have determined the capacity of the cranium, by which volume of the brain can be estimated. There are many methods by which capacity of cranium can be estimated on dry skulls [8-12]. Size of the brain and thus, the volume of the brain can be estimated indirectly by various methods available in the literature by using linear dimensions, packing methods, or radiological methods [9,10,13,14].
Many studies showed that the cranial capacity increases with age from birth throughout childhood. Most growth is achieved in the first five years [15,16]. At the age of 16-20 years, the cranial capacity reaches its peak size and thereafter there is no change in its size for the rest of the life [17,18].
The cranial capacity of skulls belonging to different races has been determined by a few authors [9-12]. Mazonakis M et al., stated that the techniques of stereology and planimetry provided a mean intracranial cavity volume of 1323.0±180.7 cm3 and 1329.1±168.5 cm3 in males and females respectively [19].
Only a few studies have been made on living subjects [12]. These studies help us in estimating the cranial capacity and comparing with other dimensions of cranium which can help in studying the development of primates. It also helps us in tracing the growth and development and can help in identifying the various available skulls [8]. An attempt has been made in the present study to estimate the cranial capacity of living subjects using the linear dimensions of the cranium in 17-19-year-old healthy first year MBBS students and to compare it with BMI and academic performance.
Hwang Y et al., stated in their study that, the cranial volume in males and females was 1470±107 cm3 in male and 1317±117 cm3, respectively [11]. Cranial capacity was 1420.60±85 cm3 in males and 1227.2±120 cm3 in females in Turkman group and 1369.4±142 cm3 in males and 1215.8±125 cm3 in females in natives of Fars group in males, as reported by Golalipour MJ et al., [12]. Cranial volume was 1548 cm3 in males and 1425 cm3 in females as stated in studies of Dekaban AS [13]. For a group of normal subjects, 1472 cm3 was the mean cranial volume and 1413 cm3, and 1551 cm3 in females and males respectively as reported by Mori E et al., [20].
In the present study on 100 students, the cranial capacity of 56 male students ranged between 1444 cm3-1589 cm3 with a mean of 1483.22 cm3 and the cranial capacity of 44 female students ranged between 1238 cm3-1415 cm3 with a mean of 1236.54 cm3. A significant difference was observed in the cranial capacity between males and females. The observed difference was statistically significant (t=12.57; p<0.001). The findings of this research, support the observation of Hwang Y et al., and Golalipour MJ et al., where Hwang Y et al., reported the cranial capacity was 1470±107 cm3 in males and in females, it was 1317±117 cm3. Golalipour MJ et al., also stated that in males and in females, the cranial volume was 1420±85 cm3 and 12270±120 cm3 respectively [11,12]. Gustafon D et al., by using a linear regression analysis examined the effect of age and BMI on normalised brain volume to determine whether there is atrophy of the temporal lobe in elderly females [21].
Effects of age, BMI and gender on the volume of the brain were studied by Ward MA et al., by using a linear regression analysis [22]. Their results showed that age and BMI together were the best predictors of normalised brain volume. In addition, BMI affects brain volume at a relatively young age and may result in brain atrophy in following years. Ward A et al., also stated that both age and BMI were associated with decreased brain volume in 40-66-year-old (54.2±6.6 cm3) [22].
In the present study, a significant correlation was observed between cranial capacity and BMI. Students with increased BMI had a greater cranial capacity. The most likely explanation was given by Ho KC et al., in 1980 was that the head size of humans, and consequently the intracranial volume, increases with age and those changes mask the long-term trend that affects the population as a whole [23].
In present study, the BMI showed an inverse relation to academic performance. This in accordance with findings reported by Yu ZB et al., that IQ of obese children were lower than that of normal weight children in contrast to a study by Riaz H et al., where the good academic performers had higher BMI values [4,24].
Galton F, the first to quantify the relation between brain size and general mental ability in living people [25]. Haug H, showed a significant correlation between a number of cortical neurons (based on a partial count of representative areas of the brain) and brain size [26]. According to Rushton JP and Ankney CD the preponderance of evidence demonstrates that brain size is correlated positively with intelligence and that both brain size and general mental ability are correlated with age, socioeconomic position, sex, and population group differences [27]. In the present study; however, no significant correlation was observed between cranial capacity and academic performance.
The present study showed a larger cranial capacity was related with increased BMI and hence may be helpful in the medico-legal and anthropological examination to find the relations between cranial capacity and age, height, body weight and BMI.
Limitation
However, unlike earlier studies, authors were not able to correlate the academic abilities with the cranial capacity. This may be due to the fact that authors have considered only a small component of intelligence of an individual i.e., academic performance. Further studies by using standardised holistic intelligence assessment like Binet’s or Weschlers protocols may provide a more accurate correlation with regard to the cranial capacity and intelligence of an individual.
Being a cross-sectional pilot study, authors were unable to include the final university examination marks in computing the academic performance of students and only a hundred first-year medical students were included in the study. Factors like hormonal status, food habits, physical activity influencing the BMI which would have given a better explanation, were not taken into consideration.
Conclusion
An increase of cranial capacity is related to an increase in body height, body weight and BMI. In the present study, there is a satisfactory correlation between age, BMI, and cranial capacity. Larger brain size and cranial volume might be due to the greater working capacity needed for larger body size. The technique of estimating cranial volume needs to be refined and modified as it may be of potential application in brain atrophy and reconstruction of the cranium in anthropologic studies.
r=Pearson’s correlation coefficient, p=significance value; *Correlation is significant at the 0.05 level (2-tailed); **Correlation is significant at the 0.01 level (2-tailed)
t=test statistical value; p=significance value