Diabetes mellitus Type 2 is a multifactorial metabolic disease with several complications warranting high concern for effective prevention and control measures [1,2].
Diabetes is currently achieving the status of potential epidemic in India with more than 62 million individuals diagnosed with the disease. The prevalence of diabetes is estimated to double throughout world from 171 million in 2000 to 366 million in 2030 with India showing the maximum increase according to Wild S et al. It is estimated that 79.4 million Indians might get afflicted with diabetes By 2030 [3,4].
Dermatoglyphics is the study of the ridges present on fingers, palms and soles and is inherited by polygenic system with individual gene attributing to a small additive effect [5]. Gene expression which gets determined in the early prenatal environment is measured by means of dermatoglyphics which acts as an identification marker for diseases like diabetes with hereditary basis [6].
Micronuclei arising from whole intact chromosomes or chromosomal fragments are small nuclei that lag behind in the anaphase stage of cell division. They reflect structural or numerical chromosomal aberration arising during the step of mitosis. They act as biomarker for assessing genotoxicity or impaired DNA repair occurring in diabetes [7].
Due to the broad genetic immunologic basis in both diabetes mellitus type 2 and blood groups, few studies have supported the hypothesis that both are inter-related [8-11]. ABO blood group system, a major classification, is determined by the presence or absence of antigens A and B present on the surface of red blood cells. Susceptibility to various diseases has been interrelated to a person’s ABO phenotype. There have been conflicting results available on the data showing the association between the distribution of the ABO blood types and diseases, with some studies reporting positive and others showing no association [9,12].
Many studies have been carried out previously using single biomarkers for detection of risk of diabetes. Need of the hour is a panel of biomarkers which are simple, economical, rapid and would help in screening a larger community level population.
Therefore, aim of the present study was to evaluate the role of dermatoglyphics, oral micronuclei and ABO blood grouping in determining Type 2 diabetes.
Materials and Methods
This was a case-control study involving 44 type 2 diabetic patients, who were under anti-diabetic medication and 45 age (range) matched healthy controls. The study was carried out in a population of Davangere, Karnataka from June to December 2014. The written consent for the study was obtained after the necessary instructions. Ethical approval certificate was obtained from Institutional Review Board.
Patients with cardiac, renal, chronic liver diseases and cancer, who received radiation treatment and with habits such as smoking, alcohol, pan chewing, were excluded from the current study.
All the individuals of the present study were in the age range of 25-75 years involving 44 diabetics (15 Females, 29 Males) and 45 Controls (20 Females, 25 Males).
Palmar prints, oral cytosmears and blood samples for ABO blood grouping were obtained from both the groups.
Out of the diabetic population of 44, blood samples of 39 and oral smears of 40 patients were available. Out of 45 non diabetic people, 41 blood samples for grouping were available and oral smears were obtained from 43 whereas palmar prints of entire both groups were available.
Palmar Print Collection
Materials used: Duplicating ink, roller, glass slab, cotton puffs, white sheets, ink stamp pad, magnifying hand lens for analysis, scale, pencil, pen, protractor for measuring ATD angle.
Patients were initially asked to wash the palms and fingers with soap and water to remove the sweat and any kind of dirt. The duplicating ink was spread with the help of roller on glass slab so that a thin layer of ink is formed on the slab surface. Ink was also spread on the palm evenly with the help of roller. Care was taken to fill the hollow of palm and flexor creases of wrist uniformly. If the uniformity was not achieved in inking, cotton puffs were used for applying ink in the hollow. Palmar prints were obtained on white sheets separately for each hand. Fingerprints were obtained separately using a stamp pad; a thin layer of stamp pad ink was applied to fingers. An imprint of five fingertips was obtained on a bond sheet for one hand and procedure was repeated for the other hand on separate sheet. The printed sheets were labelled for name, age, gender for diabetic and control groups.
After obtaining palmar and fingerprints, patients were asked to wash the hands with soap and water to get rid of the ink.
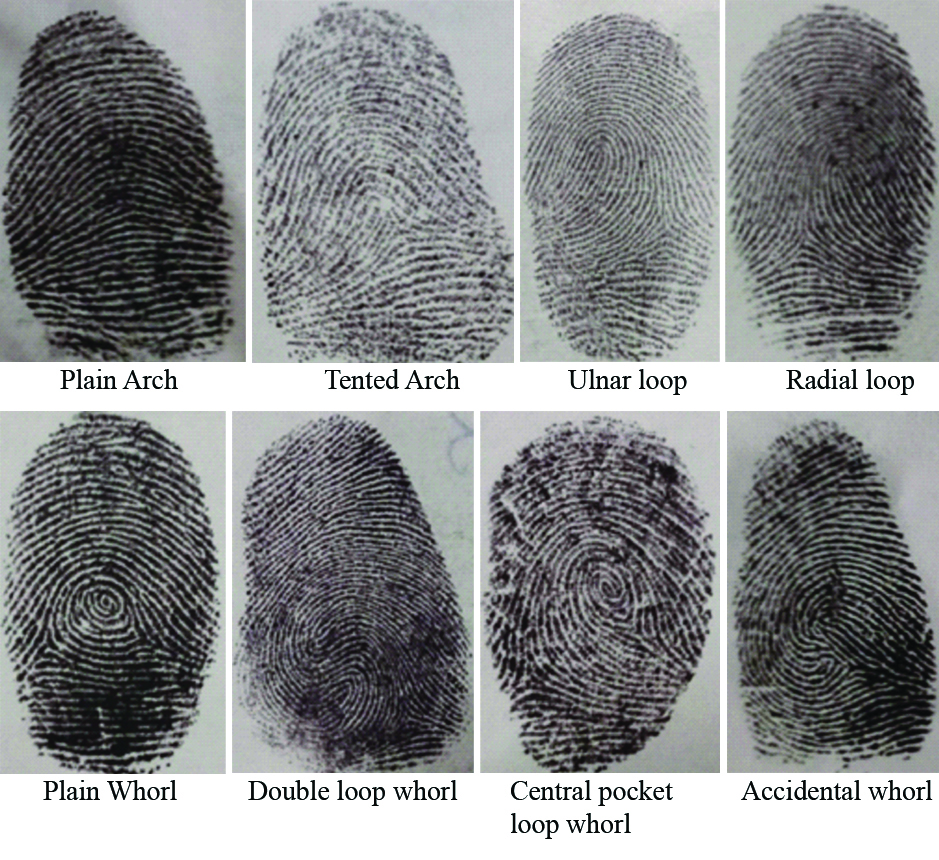
The ridges present on fingertip were analysed from core to delta for each finger and examined for arch, loop and whorl type of patterns according to Henry’s classification system [13]. These patterns were further sub-classified as plain arch, tented arch, left loop, right loop and whorl. Whorls were further classified as plain whorl, central pocket whorl, double loop whorl and accidental whorl [Table/Fig-1] [14].
Various types of fingerprints patterns recorded in the study, classified as arches, loops and whorls, according to Henry’s system of classification.
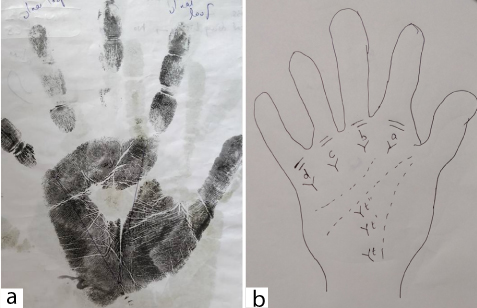
The triradius present below medial four fingers were named a, b, c and d starting from index finger to little finger whereas the triradius present between thenar and hypothenar eminence was named as t. An ATD angle is formed by straight lines drawn from digital triradius ’a’ to axial triradius ‘t’ and to digital triradius ‘d’ as represented in [Table/Fig-2]. This angle gives an indication of degree of distal displacement of axial triradius. Cummins and Midlo suggested that the axial triradius be designated as- t when it is located at the proximal border- t’’ when located at the centre of the palm and t’ when in intermediate position.
a) Palmar print showing ATD angle; b) Depiction of triradii t, t’ and t’’.
An ATD angle related to axial triradius ‘t’ position migrates during the early stage of gestation from centre to the lower proximal region of palm. The distally deviating ‘t’ position might indicate either prematurely halted ‘t’ migrations or delayed development outcomes. Increased ATD angle in Type 2 diabetes mellitus might indicate mild distortions of development during early phase of gestational development [15]. Increased ATD angle in Type 2 diabetes mellitus has been reported by many studies [16-18]. Altered dermatoglyphic patterns including ATD angle have been observed in diseases like schizophrenia, leukaemia, diabetes, hypertension, heart diseases, cancer and other diseases with chromosomal abnormalities [19].
An ATD angle gets affected by amount of spreading of fingers while obtaining the print and even pressure exerted when the print is made can influence the ATD angle. An ATD angle tends to decrease with age as the as palm grows more in length than breadth [20].
Fingerprint pattern and ATD angle were determined for each individual.
Oral Smear Collection
Materials used: Wooden spatula, slides, fixative, papanicolaou kit and light microscope are required for micronuclei determination.
Oral cytosmears were obtained from the buccal mucosa of both cases and controls using a wooden spatula after mouth rinsing. Smears fixed with microanatomy fixative were stained using the Papanicolaou stain. Under a light microscope at 40X magnification, number of micronuclei present per 100 cells in every slide was counted.
Blood Sample Collection
Materials used: Syringes, Anti-A, Anti-B and Anti-D antisera are required for blood grouping.
About 1 mL of blood sample collected by venepuncture from both the groups was subjected to ABO blood grouping. For ABO blood groups standard serological procedures were followed using anti-A, anti-B and anti-D antisera.
Statistical Analysis
SPSS version 20.0 was used for the analysis. Dermatoglyphic findings were expressed as mean±SD. Comparison of ATD angle between both groups was achieved using independent sample t-test. Oral micronuclei frequency in both groups was compared using Independent sample t-test and further its correlation to antidiabetic medication was achieved using spearman’s correlation coefficient. Chi-square test was applied for testing the association of blood groups to diabetes. A p-value <0.05 was considered significant for entire analysis. Logistic regression analysis was performed to understand the role of these parameters in determining diabetes.
Results
Fingerprint distribution in both groups is expressed as mean and standard deviation [Table/Fig-3]. Overall arches, radial loops, ulnar loops and total loops were found to be more common in diabetic population than controls. Whorls on other hand were found to be less common in diabetics.
Comparison of diabetic and non diabetic groups with respect to mean number of arch, loops, whorl and ATD angle.
| Side of hand | Fingerprints | Diabetic | Non diabetic | t-value | p-value |
|---|
| Mean | SD | Mean | SD |
|---|
| Left hand | Arches | 0.25 | 0.72 | 0.20 | 0.81 | 0.3067 | 0.7598 |
| Radial loop | 0.11 | 0.32 | 0.04 | 0.21 | 1.2087 | 0.2301 |
| Ulnar loop | 2.93 | 1.53 | 2.60 | 1.68 | 0.9719 | 0.3338 |
| Total loop | 3.05 | 1.55 | 2.64 | 1.69 | 1.1627 | 0.2481 |
| Whorls | 1.61 | 1.43 | 2.16 | 1.72 | -1.6135 | 0.1103 |
| ATD angle | 44.16 | 3.86 | 38.53 | 3.27 | 7.4251 | 0.0001* |
| Right hand | Arches | 0.27 | 0.69 | 0.11 | 0.49 | 1.2735 | 0.2062 |
| Radial loop | 0.02 | 0.15 | 0.07 | 0.33 | -0.8042 | 0.4234 |
| Ulnar loop | 2.98 | 1.65 | 2.67 | 1.67 | 0.8840 | 0.3792 |
| Total loop | 3.00 | 1.66 | 2.73 | 1.66 | 0.7592 | 0.4498 |
| Whorls | 1.59 | 1.60 | 2.13 | 1.69 | -1.5539 | 0.1238 |
| ATD angle | 43.45 | 3.88 | 38.29 | 3.22 | 6.8392 | 0.0001* |
| Total | Arches | 0.52 | 1.28 | 0.31 | 1.28 | 0.7796 | 0.4378 |
| Radial loop | 0.14 | 0.35 | 0.11 | 0.44 | 0.3010 | 0.7642 |
| Ulnar loop | 5.91 | 2.73 | 5.27 | 3.07 | 1.0415 | 0.3005 |
| Total loop | 6.05 | 2.79 | 5.38 | 3.09 | 1.0680 | 0.2885 |
| Whorls | 3.20 | 2.76 | 4.29 | 3.15 | -1.7255 | 0.0880 |
| ATD angle | 43.81 | 3.80 | 38.41 | 3.11 | 7.3441 | 0.0001* |
Independent t-test; *p<0.05
In male diabetics, ulnar and total loops were found more in number while in female diabetics arches, ulnar, total loops were higher. Whorls were reduced in both male and female diabetics compared to controls. These findings were not significant, while ATD angle measurements were significantly higher in male and female diabetics [Table/Fig-4,5].
Comparison of diabetic and non diabetic groups with respect to mean number of arch, loops, whorl and ATD angle in males.
| Side of hand | Fingerprints | Diabetic male | Non diabetic male | t-value | p-value |
|---|
| Mean | SD | Mean | SD |
|---|
| Left Hand | Arches | 0.28 | 0.80 | 0.32 | 1.07 | -0.1734 | 0.8630 |
| Radial loop | 0.10 | 0.31 | 0.04 | 0.20 | 0.8775 | 0.3842 |
| Ulnar loop | 2.72 | 1.58 | 2.36 | 1.68 | 0.8204 | 0.4158 |
| Total loop | 2.83 | 1.58 | 2.40 | 1.71 | 0.9544 | 0.3443 |
| Whorls | 1.76 | 1.55 | 2.28 | 1.77 | -1.1546 | 0.2535 |
| ATD angle | 43.83 | 3.95 | 38.00 | 3.34 | 5.8027 | 0.0001* |
| Right Hand | Arches | 0.21 | 0.62 | 0.16 | 0.62 | 0.2763 | 0.7834 |
| Radial loop | 0.03 | 0.19 | 0.12 | 0.44 | -0.9544 | 0.3443 |
| Ulnar loop | 2.86 | 1.68 | 2.20 | 1.63 | 1.4606 | 0.1501 |
| Total loop | 2.90 | 1.70 | 2.32 | 1.65 | 1.2602 | 0.2132 |
| Whorls | 1.86 | 1.66 | 2.48 | 1.76 | -1.3257 | 0.1907 |
| ATD angle | 43.17 | 3.40 | 37.48 | 2.99 | 6.4823 | 0.0001* |
| Total | Arches | 0.48 | 1.38 | 0.48 | 1.69 | 0.0066 | 0.9947 |
| Radial loop | 0.14 | 0.35 | 0.16 | 0.55 | -0.1774 | 0.8599 |
| Ulnar loop | 5.59 | 2.85 | 4.56 | 3.14 | 1.2599 | 0.2133 |
| Total loop | 5.72 | 2.91 | 4.72 | 3.18 | 1.2100 | 0.2318 |
| Whorls | 3.62 | 2.93 | 4.76 | 3.38 | -1.3260 | 0.1906 |
| ATD angle | 43.50 | 3.61 | 37.74 | 3.02 | 6.2975 | 0.0001* |
Independent t-test; *p<0.05
Comparison of diabetic and non diabetic groups with respect to mean number of arch, loops, whorl and ATD angle in females.
| Side of hand | Fingerprints | Diabetic female | Non diabetic female | t-value | p-value |
|---|
| Mean | SD | Mean | SD |
|---|
| Left Hand | Arches | 0.20 | 0.56 | 0.05 | 0.22 | 1.0907 | 0.2833 |
| Radial loop | 0.13 | 0.35 | 0.05 | 0.22 | 0.8556 | 0.3984 |
| Ulnar loop | 3.33 | 1.40 | 2.90 | 1.68 | 0.8091 | 0.4242 |
| Total loop | 3.47 | 1.46 | 2.95 | 1.67 | 0.9556 | 0.3462 |
| Whorls | 1.33 | 1.18 | 2.00 | 1.69 | -1.3093 | 0.1995 |
| ATD angle | 44.80 | 3.75 | 39.20 | 3.12 | 4.8213 | 0.0001* |
| Right Hand | Arches | 0.40 | 0.83 | 0.05 | 0.22 | 1.8123 | 0.0791 |
| Radial loop | 0.00 | 0.00 | 0.00 | 0.00 | -- | -- |
| Ulnar loop | 3.20 | 1.61 | 3.25 | 1.55 | -0.0928 | 0.9266 |
| Total loop | 3.20 | 1.61 | 3.25 | 1.55 | -0.0928 | 0.9266 |
| Whorls | 1.07 | 1.39 | 1.70 | 1.53 | -1.2629 | 0.2155 |
| ATD angle | 44.00 | 4.75 | 39.30 | 3.29 | 3.4591 | 0.0015* |
| Total | Arches | 0.60 | 1.12 | 0.10 | 0.31 | 1.9092 | 0.0650 |
| Radial loop | 0.13 | 0.35 | 0.05 | 0.22 | 0.8556 | 0.3984 |
| Ulnar loop | 6.53 | 2.47 | 6.15 | 2.81 | 0.4194 | 0.6776 |
| Total loop | 6.67 | 2.53 | 6.20 | 2.84 | 0.5040 | 0.6176 |
| Whorls | 2.40 | 2.26 | 3.70 | 2.81 | -1.4681 | 0.1516 |
| ATD angle | 44.40 | 4.21 | 39.25 | 3.08 | 4.1899 | 0.0002* |
Independent t-test; *p<0.05
Frequency of micronuclei in oral smears was found to be significantly higher in diabetic population than controls. Females exhibited higher mean levels of micronuclei compared to males in both diabetics and controls [Table/Fig-6a]. No correlation was found between frequency of micronuclei and duration of anti-diabetic medication. The patients in the study were under anti-diabetic medication for more than six months duration [Table/Fig-6b].
Comparison of diabetic and non diabetic groups with respect to mean number of MN cells.
| Gender | Group | Mean | SD | SE | t-value | p-value |
|---|
| Male | Diabetic | 24.20 | 13.16 | 2.63 | 1.9072 | 0.0625 |
| Non diabetic | 18.36 | 7.82 | 1.56 |
| Female | Diabetic | 27.13 | 11.36 | 2.93 | 2.0711 | 0.0471* |
| Non diabetic | 19.65 | 9.07 | 2.20 |
| Total | Diabetic | 25.30 | 12.45 | 1.97 | 2.7629 | 0.0071* |
| Non diabetic | 18.88 | 8.26 | 1.28 |
Independent t-test; *p<0.05; MN: Micronuclei
Correlation of MN cells to the duration of antidiabetic medication.
| Correlation of micronuclei cells | Drug history in years/duration |
|---|
| MN Cells (out of 100) | Spearman’s rho Correlation Coefficient | 0.069 |
| p-value | 0.702; NS |
| Number | 33 |
MN: Micronuclei
ABO blood groups did not show any association with diabetes. It was noticed that O blood group had the highest frequency of distribution in both the groups [Table/Fig-7]. Among the diabetic population of 44, only 39 patients gave blood sample for blood grouping. Similarly among 45 control group, only 41 gave their blood sample for blood grouping.
Association of diabetes with blood groups.
| Blood Group | Group | p-value |
|---|
| Diabetic | Nondiabetic |
|---|
| n | % | n | % |
|---|
| O | 18 | 46.2% | 22 | 53.7% | 0.924; NS |
| A | 11 | 28.2% | 10 | 24.4% | |
| B | 7 | 17.9% | 6 | 14.6% | |
| AB | 3 | 7.7% | 3 | 7.3% | |
chi-square test
Among the diabetic population of 44, 39 samples were available for blood grouping. Similarly among 45 control group, only 41 blood samples were available for blood grouping.
Logistic regression analysis was done to find out the role of the parameters in predicting the risk of diabetes. Stepwise Logistic Regression Analysis (LRA) showed left whorls, ATD angle, and micronuclei as most suited regressor for diabetic determination. The accuracy rate in classification of diabetics and non diabetics was 81.30% [Table/Fig-8].
Step wise logistic regression analysis of diabetes by different variables.
| Variables | Coefficient | SE | Wald chi-square test | p-value | -2 Log likelihood | Chi-square for model fit | p-value | % of overall corrected classification |
|---|
| Whorls | -0.2770 | 0.1330 | 4.3240 | 0.0380* | 54.2600 | 49.3790 | 0.0001* | 81.30 |
| ATD angle | 0.5290 | 0.1310 | 16.3960 | 0.0001* | | | | |
| MN Cells | 0.0690 | 0.0340 | 4.1490 | 0.0420* | | | | |
| Constant | -22.4000 | 5.3790 | 17.3450 | 0.0001* | | | | |
*p<0.05; SE: Standard Error
Stepwise Logistic Regression Analysis (LRA) with the equation is shown in above Table. As the accuracy value obtained is of average level we subjected all variables again for regression analysis. Allocation accuracy rates did not improve when multiple dimensions were incorporated into the LRA. The inclusion of above variables is done using the formula y=a+b1x1+b2x2+b3x3, where x1 is Whorls, x2 is ATD angle, x3 is MN Cells. Even then the predictive value did not improve; the value obtained is 81.30%. The probability is calculated from the logit value (P) from the preceding expression by the following equation: P=elogit/(1+elogit). The results show that there is 19% wrong classifications and is more favorable for the prediction of diabetic based on chance with 50% probability of error.
Discussion
Throughout world the prevalence of diabetes among all age groups have been rising from an estimated 2.8% in 2000 to 4.4% in 2030 [4]. Various studies are being done to identify potential biomarkers so that diabetes can be predicted earlier and necessary preventive measures can be taken.
Maturity onset diabetes mellitus with a strong hereditary background exhibits certain dermatoglyphic variations. Dermatoglyphic fingerprint patterns as recognised by Henrys classification include: arch, whorl and loop. Arch is divided into plain and tented. Whorl is divided into four types-plain, double loop, central pocket loop and accidental. Loop involves two types, radial and ulnar [13,14].
In the present study, overall loop was the most common fingerprint in diabetic group. Arches were slightly more in frequency in diabetic group compared to controls. Arches were increased in diabetic females and right hand of diabetic males. The findings were not statistically significant. An increase in frequency of arches in female diabetics was observed by Sant SM et al., and Verbov JL [16,21]. Burute P et al., and Ravindranath R and Thomas IH found the same in female and male diabetics while Sengupta S and Borush J, observed in male diabetics [5,22,23]. Though not statistically significant, the results exhibited a trend towards increase in the frequency of ulnar loops in male diabetics and left hand of female diabetics. Increased ulnar loops in diabetics were observed by Burute P et al., Ravindranath R and Thomas IH [5,22]. Contrast to the findings of present study, a decrease in ulnar loops was observed by Sant SM et al., [16].
In the present study, radial loops frequency was found low for statistical analysis. Sant SM et al., and Ravindranath R and Thomas IH found reduced radial loops in diabetics [16,22].
Whorls were found to be less in diabetics than controls in both males and females. Similar findings were obtained by Burute P et al., in both genders and Verbhov JL in diabetic females [5,21]. Contrast to this Sant SM et al., and Sengupta S and Borush J, observed an increase in whorls in diabetics [16,23].
Measuring ATD angle is the mot commonly used method for interpreting the position of axial triradius in the palm [24]. The ATD angle in the present study was significantly higher in diabetic population than in controls in both males and females and on both sides of hand. Distally shifted axial triradius ‘t’ in diabetes gives rise to higher values of ATD angle. The chromosomal abnormalities occurring during gestation period in diabetes contribute to the unusual dermatoglyphics.
Contrast to the present study, ATD angle was lower in diabetic patients as mentioned by Yanhua L et al., [25]. In accordance with the present study values of ATD angle were significantly higher in diabetic population than controls as compared to previous studies by Rajnigandha V et al., and Trivedi PN et al., [17,18].
There was increase in ATD angle of both diabetics and non diabetics in left hand than right hand. Similar results were observed by Rajnigandha V et al., and Padmini MP et al., in their studies [17,26].
Statistically non significant results of the fingerprint analysis in present study could be attributed to the smaller sample size.
Cells from the buccal mucosa are good indicators of chromosomal damage and other nuclear abnormalities. Buccal micronucleus test is preferred over cytokinesis block or human capillary blood lymphocyte micronucleus test as it is less invasive, less time taking procedure requiring no cell culture or metaphase preparation [27].
Statistically significant increase in frequency of micronuclei has been observed in oral smears of diabetic group compared to controls. This was in accordance with various previous studies [2,27-29]. No correlation was found between frequency of micronuclei and duration of use of anti-diabetic medication.
Factors such as dose and type of drug could have contributed to the negative correlation in the study along with smaller sample size. According to a study the average number of micronuclei was more in patients with more than 10 years of duration of diabetes, but when less than five years micronuclei frequency merely reduced due to drug effect [28]. According to Shaik NA et al., micronuclei frequency is more in diabetics using pioglitazone and glimepiride medication for more than 5 years [2]. Micronuclei frequency gets influenced by multiple factors which stimulate reactive oxygen species production causing DNA damage. According to few studies oxidative stress, glutathione levels and gene polymorphisms of antioxidant and DNA repairing genes have a role in influencing micronuclei frequency [30,31]. Micronuclei cause DNA damage indicating genomic instability which can further predispose to cancer. Other factors such as gender, occupation, lifestyle and age have influence on the micronucleus frequency.
No association was found between ABO blood grouping and Type 2 Diabetes mellitus.
Similar results were obtained by Sahi MD et al., whereas positive association was found in some other studies [10,12].
Stepwise logistic regression analysis carried out in the study revealed that left whorls, ATD angle and micronuclei are most suited regressor for determining diabetes. The accuracy rate for classification of diabetics and Non diabetics was found to be 81.3%.
Aetiology of diabetes mellitus Type 2 includes both genetic and environmental factors. Environmental factors like sedentary lifestyle and high fat diet can be controlled in preventing diabetes which is not possible with genetic factors. As the dermatoglyphic palmar patterns once formed prenatally remain unchanged for life they can be used as markers for hereditary diseases.
Micronuclei which are considered to be structural chromosomal aberrations arising during mitosis help in assessing impaired DNA repair and genotoxicity occurring in diabetes. They can be regarded as promising biomarkers for evaluating genetic instability in diabetes mellitus.
Antigens of blood groups are hereditary determined and have an important role in disease susceptibility. The presence or absence of blood group antigens has been linked to various diseases. Identifying a positive relationship between diabetes and blood groups reflect increase in the susceptibility and negative association might show protection against diabetes [11].
Limitation
Smaller sample size is one of the limitations of the study resulting in non significant results in dermatoglyphic pattern analysis. ATD angle gets affected by age and even pressure exerted when the print is made can influence the ATD angle. Measurement of ATD angle using software programme can yield better results. Further, the study has not considered other aspects of dermatoglyphics like total finger ridge count and a-b ridge count. Micronucleus frequency examined in the study gets influenced by other factors such as gender, occupation, age and lifestyle. Smaller sample size could be one of the drawbacks in not finding the association of blood groups with diabetes in the present study.
Conclusion
Diabetes being more common in India, a panel of biomarkers is helpful in detecting it earlier. In the present study ATD angle and micronuclei exhibited significant results and may constitute possible components of the panel.
Micronuclei being a biomarker for DNA damage and cancer risk should be used as a potential target for therapeutic intervention. Further studies should be carried out in understanding the association between antidiabetic medication and genotoxicity in diabetes as it helps in optimisation of drug therapy.
Though various studies have been done to evaluate the role of dermatoglyphics in determining diabetes the results were contradictory. This could be due to the vast difference in ridge patterns in different ethnic populations and inadequate sample size.
To validate the association of blood groups to diabetes further studies are required over larger populations.
Need of the hour is use of sensitive, simple and rapid biomarkers as a panel for improved screening surveillance of diabetes in larger populations and as an additional diagnostic tool.
Independent t-test; *p<0.05
Independent t-test; *p<0.05
Independent t-test; *p<0.05
Independent t-test; *p<0.05; MN: Micronuclei
MN: Micronuclei
chi-square test
Among the diabetic population of 44, 39 samples were available for blood grouping. Similarly among 45 control group, only 41 blood samples were available for blood grouping.
*p<0.05; SE: Standard Error
Stepwise Logistic Regression Analysis (LRA) with the equation is shown in above Table. As the accuracy value obtained is of average level we subjected all variables again for regression analysis. Allocation accuracy rates did not improve when multiple dimensions were incorporated into the LRA. The inclusion of above variables is done using the formula y=a+b1x1+b2x2+b3x3, where x1 is Whorls, x2 is ATD angle, x3 is MN Cells. Even then the predictive value did not improve; the value obtained is 81.30%. The probability is calculated from the logit value (P) from the preceding expression by the following equation: P=elogit/(1+elogit). The results show that there is 19% wrong classifications and is more favorable for the prediction of diabetic based on chance with 50% probability of error.