Pain has various physiological and psychological disturbances such as increased myocardial oxygen demand, poor ventilatory function, high sympathetic tone, anxiety, sleep disturbances, altered behaviour and psychosis. Poorly controlled acute pain can lead to chronic pain syndrome which is very distressing to the patient; therefore, control of pain is an important element in the perioperative period and requires good effort from the attending anaesthesiologist. Renal surgeries are usually associated with significant postoperative pain [1].
Patients undergoing renal surgeries are usually having impaired renal function and because of impaired renal function, these patients need the judicious use of systemic analgesics [2]. Thus, the regional nerve block can be a good alternative in such patients.
Intra venous (IV) Patient Controlled Analgesia (PCA), using opioids are widely used method but the severe postoperative pain is difficult to manage by a single approach only. In such cases, multimodal approach is helpful, and a perioperative nerve block is a good choice [3,4].
Para Vertebral Block (PVB) techniques are used to provide anaesthesia and analgesia in thoracic and abdominal surgeries and this technique may be considered as appropriate alternative to the standard methods of providing analgesia (e.g., epidural analgesia, intravenous opioids) [5,6]. A Local anaesthetic is injected in a space immediately lateral to where the spinal nerves emerge from the intervertebral foramina in PVB [7].
The study compared between Thoracic Para Vertebral Block (TPVB) and IV PCA (fentanyl) with IV PCA (fentanyl) alone for postoperative analgesia and postoperative haemodynamic changes and side effects in patients of both the groups undergoing open nephrectomy.
Materials and Methods
After approval from the Institutional Ethical Committee (Ethical Committee number-79th ECM II B-Thesis/P16.) and written informed consent, a prospective randomised (computer generated randomisation) controlled observer-blinded trial was carried out among the admitted in-patients of Gandhi memorial and associated Hospitals KG Medical University, Lucknow; from September 2014 to August 2016.
On the basis of literature available [8], the difference between the two combinations was estimated to be nearly four hours for the duration of first postoperative analgesic demand, with a pooled standard deviation of five hours. We also intended to see a similar difference in onset time. The sample size was calculated by using the formula proposed by Snedecor GW and Cochran WG [9]. Thus, the calculated sample size was 21 in each group. After adding for contingency of 20%, the targeted sample size was 25. However, the sample size of 30 was kept in each group in accordance with the central limit theorem. The sample size was calculated at 95% confidence and 80% power.
Study Participants: The inclusion criteria were; patients aged 18-60 years of either sex, belonging to American Society of Anaesthesiologists (ASA) physical Status I and II and within 25% of ideal weight and height, posted for elective nephrectomy. The exclusion criteria were; patient refusal, spinal or chest wall deformity, active infection at the local site, coagulopathy or any known allergy to test drugs.
Intervention: All patients were given premedication on the night before surgery, with tab. alprazolam 0.25 mg orally. Group A patients were informed regarding the procedure of giving a paravertebral block. After monitor attachment (NIBP, ECG and SpO2) in the operating room, Group A patients were given TPVB only. All patients were preloaded with 10-15 mL/kg of Ringer Lactate. PVB was given in a lateral position at the level of T10-T11 vertebra. Paravertebral space was scanned by ultrasonography with a linear probe after confirming the T10 or T11 transverse process. Under aseptic precautions, at 2.5 cm lateral to the cephalad edge of the T10 spinous process, skin, subcutaneous tissue and periosteum of the transverse process of T10 vertebra was infiltrated with 3 mL of 2% lignocaine. A 25G insulated needle was introduced at 90° to the skin, at the site of local anaesthetic infiltration. The needle was advanced till it touched the transverse process of the vertebra, noting the depth. The needle was withdrawn and then advanced slightly caudal to walk off the transverse process for a distance of 1.0 to 1.5 cm. The study drug (20 mL 0.25% bupivacaine), was injected in small aliquots of 5 mL with repeated aspiration in between.
All the patients were induced with i.v fentanyl 2 microgm/kg and titrated doses of i.v. propofol. After adequate manual ventilation, i.v. vecuronium 0.1mg/kg was administered to facilitate endotracheal intubation. Inj. vecuronium was given intermittently as required for muscle relaxation.
Ventilation was started with oxygen+N2O+ 0.5% Isoflurane. The depth of anaesthesia was controlled with Isoflurane and i.v. fentanyl in both groups. The ventilator settings were adjusted to maintain normocapnia (end-tidal carbon dioxide=30-40 mm Hg).
At the end of surgery, residual neuromuscular blockade was reversed with 50 μg/kg neostigmine+10 μg/kg glycopyrrolate and patient was extubated on spontaneous respiration and the return of consciousness.
The PCA device was connected 30 minute before the end of surgery and PCA was started at a basal infusion rate of 20 ug/hour. PCA demand dose was 12 ug and Lockout interval time was 20 minutes. In addition, rescue analgesia with inj tramadol 50-100 mg i.v. was given if VAS score >3.
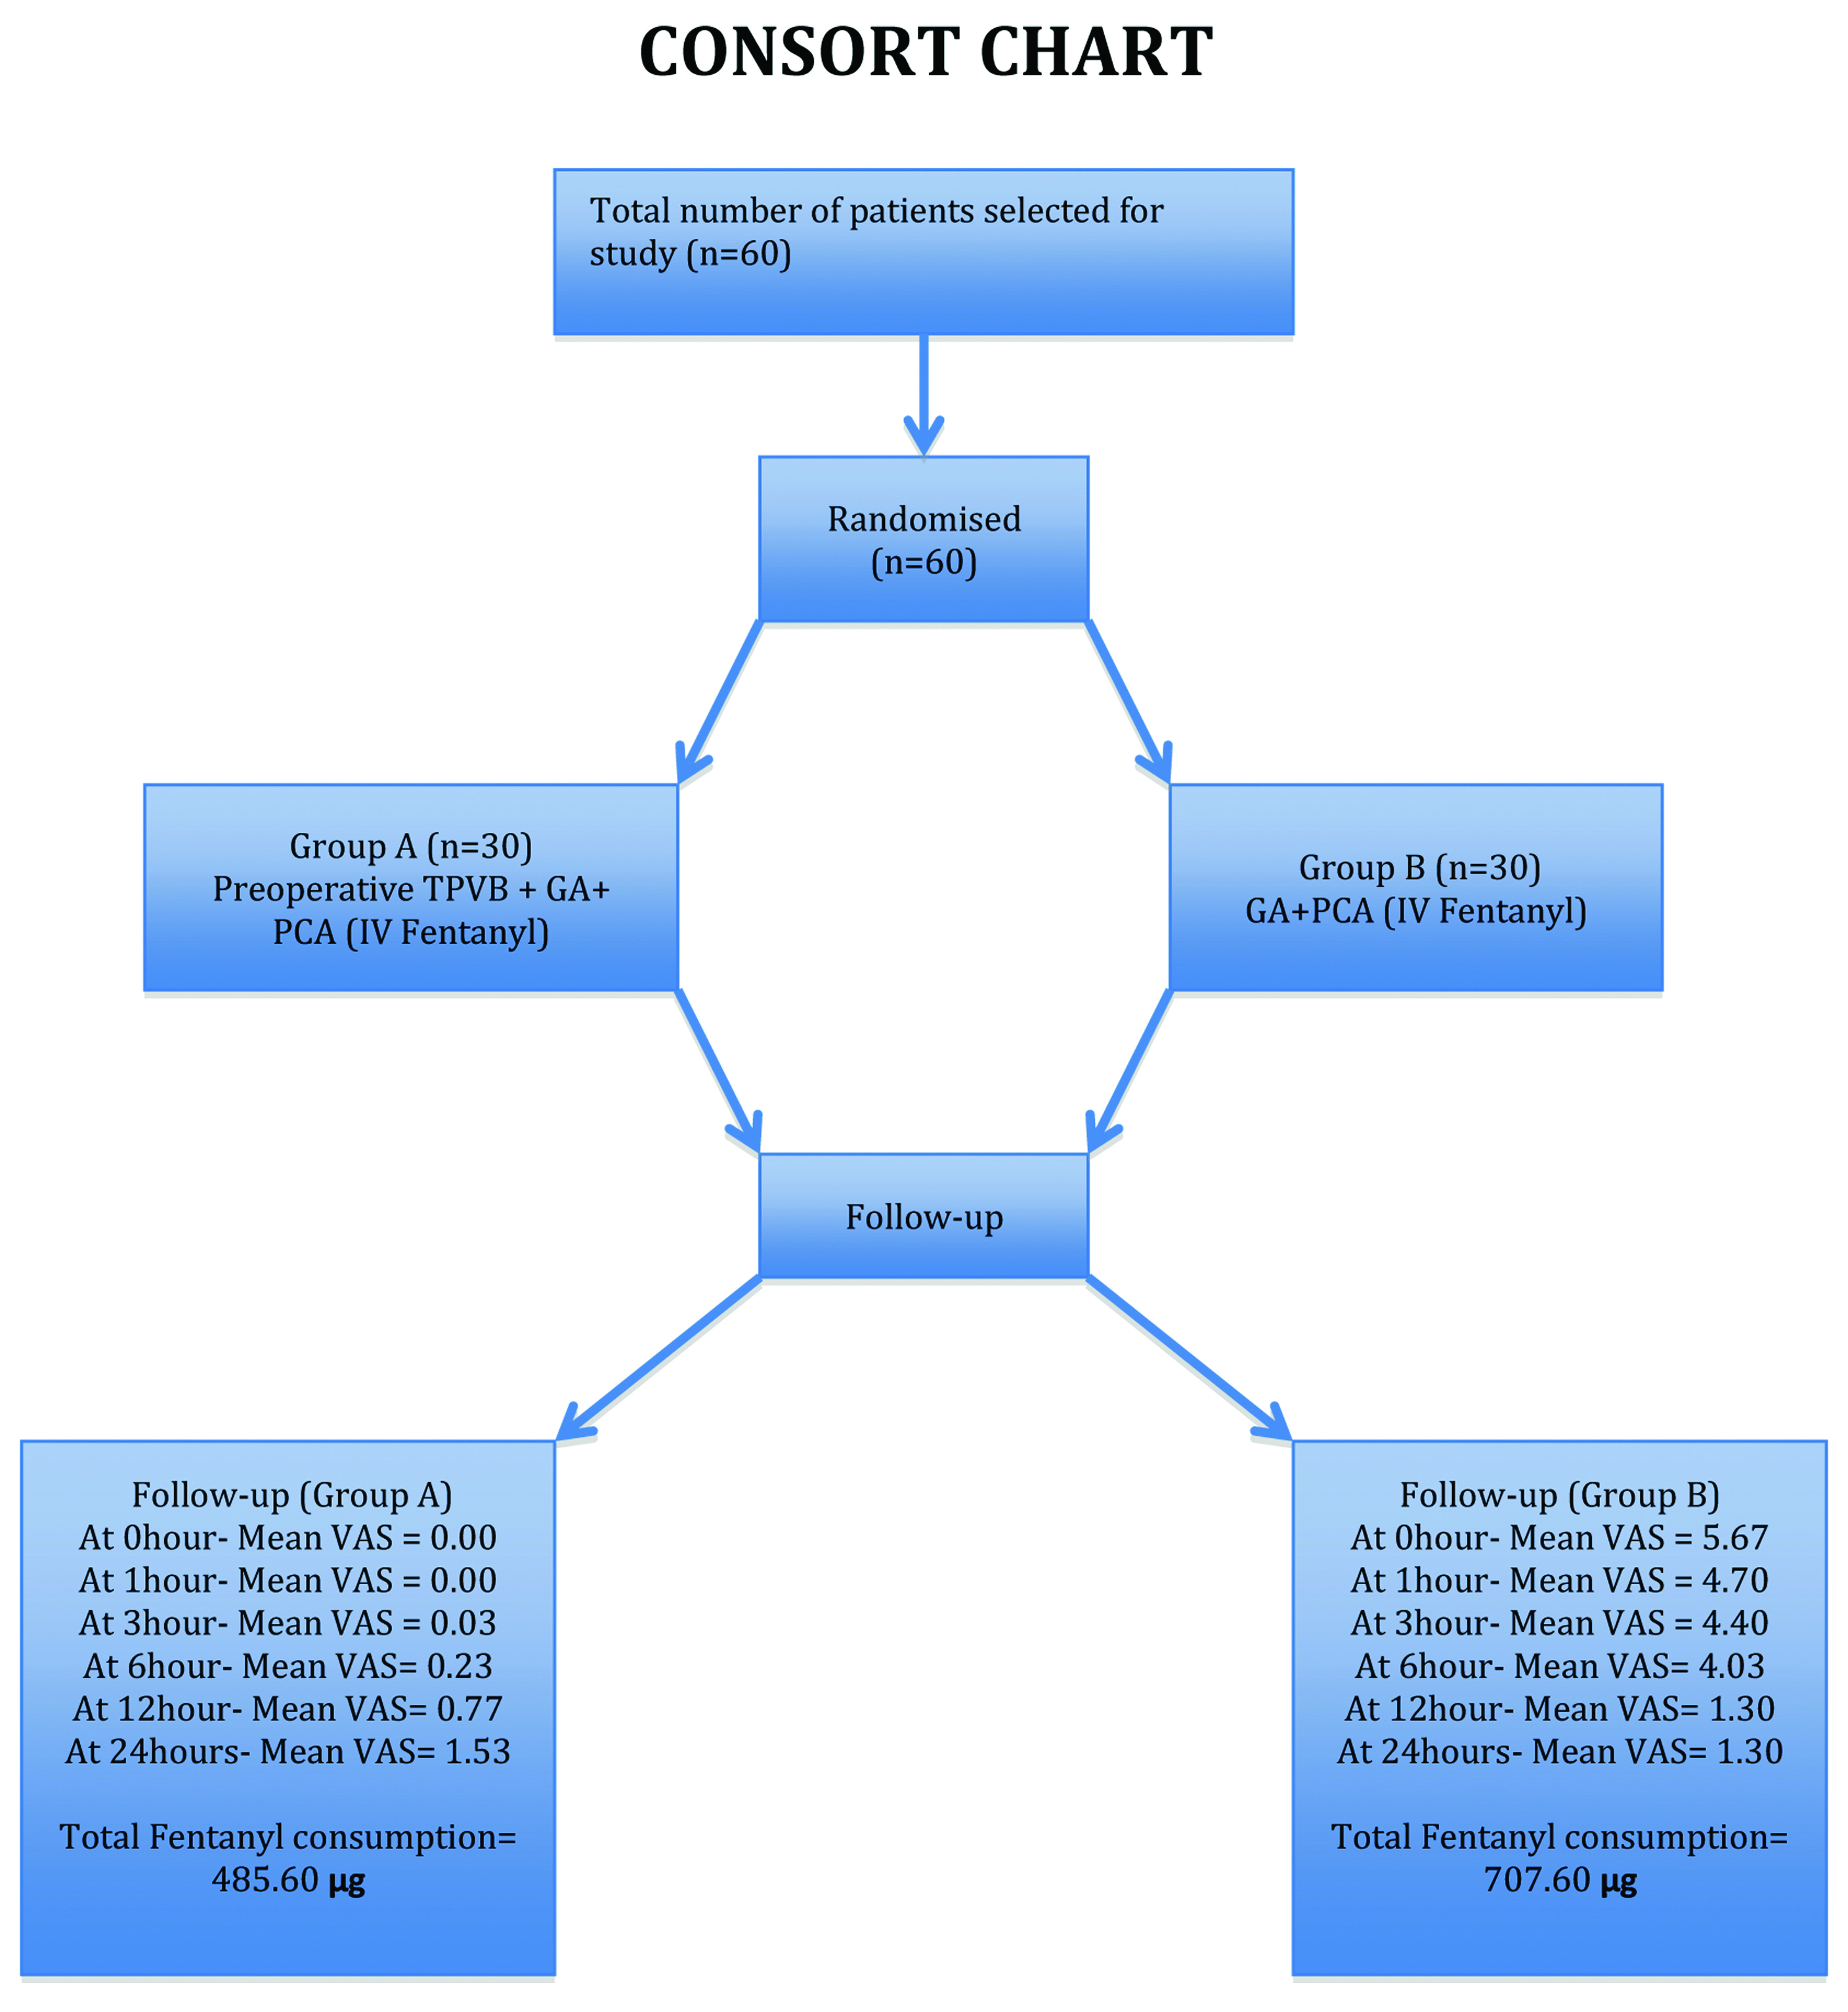
Outcome: The primary outcome measure was the postoperative pain score up to 24 hours after surgery; 0 indicated no pain, while 10 was worst imaginable pain. The secondary outcome measures were amount of fentanyl consumption, number of demand dose, haemodynamic stability and side effects at 1,3,6,12,24 hours after surgery; as shown in CONSORT flow chart [Table/Fig-1].
Statistical Analysis
Statistical analysis was performed using SPSS version 15.0. The Mann-Whitney u-test was used to compare continuous variables, while the chi-square test was used to analyse categorical variables. All data are expressed as means (standard deviation) or numbers. p<0.05 was considered significant.
Results
A total of 60 adult patients of either gender fulfilling the inclusion criteria and posted for nephrectomy in the institute, were enrolled in the study.
The difference in age between Group A and Group B was not found to be statistically significant (p=0.325). Despite proportional between group differences in the gender of subjects, this difference was not found to be statistically significant (p=0.194) [Table/Fig-2].
Between group comparison of demographic variables.
| Variables | Total | Group A (n=30) | Group B (n=30) |
|---|
| Number (%) | Number (%) |
|---|
| Age Group (years) |
| 21-30 | 11 | 8 (26.67)% | 3 (10.00)% |
| 31-40 | 16 | 8 (26.67)% | 8 (26.67)% |
| 41-50 | 19 | 9 (30.00)% | 10 (33.33)% |
| 51-60 | 14 | 5 (16.67)% | 9 (30.00)% |
| Chai-square value; p-value | χ2=3.468 (df=3); p=0.325 |
| Mean±SD(Range) | 42.80±11.22(21-60) | 40.70±11.33(21-60) | 44.93±10.81(22-60) |
| Gender |
| Female | 27 | 16 (53.33)% | 11 (36.67)% |
| Male | 33 | 14 (46.67)% | 19 (63.33)% |
| Chai-square value; p-value | χ2=1.684(df=1); p=0.194 |
The difference in diagnosis between the two groups was not found to be statistically significant (p=0.716). Patient’s physical status in both the groups was found to be similar (p=1.000). Duration of surgery in overall population as well as among Group A and Group B was not found to be statistically significant [Table/Fig-3].
Between group comparison of clinical diagnosis and patient’s physical status.
| Variables | Total | Group A (n=30) | Group B (n=30) |
|---|
| Number (%) | Number (%) |
|---|
| Diagnosis |
| Lt. renal mass | 17 | 10 (33.33)% | 7 (23.33)% |
| Lt. Non Functioning Kidney | 15 | 7 (23.33)% | 8 (26.67)% |
| Rt. renal mass | 13 | 5 (16.67)% | 8 (26.67)% |
| Rt. Non Functioning Kidney | 15 | 8 (26.67)% | 7 (23.33)% |
| Chai-square value; p-value | χ2=1.355 (df=3); p=0.716 |
| Patient’s Physical Status |
| ASA – I | 48 | 24 (80.00)% | 24 (80.00)% |
| ASA – II | 12 | 6 (20.00)% | 6 (20.00)% |
| Chai-square value; p-value | χ2=0.000 (df=1); p=1.000 |
| Duration of Surgery |
| 2 hrs | 10 | 6 (20.00)% | 4 (13.33)% |
| 2:30 hrs | 14 | 8 (26.67)% | 6 (20.00)% |
| 3:00 hrs | 36 | 16 (53.33)% | 20 (66.67)% |
| Chai-square value; p-value | χ2=1.130 (df=2); p=0.568 |
| Mean±SD(Range) | 2.72±0.38(2-3) | 2.67±0.40(2-3) | 2.77±0.37(2-3) |
At baseline i.e., 0 minute heart rate of Group A (77.53±10.08 beats/minute) was found to be higher than that of Group B (76.13±5.38 beats/minute) while systolic blood pressure of patients of Group B (128.87±9.15 mmHg) were found to be higher than that of Group A (127.67±11.39) however, between group differences for none of the above variables were found to be statistically significant at baseline (p>0.05) [Table/Fig-4].
Between group comparison of haemodynamic variables at baseline (0 minute).
| Variables | Group A (n=30) | Group B (n=30) | Statistical significance |
|---|
| Mean | SD | Mean | SD | ‘t’ | ‘p’ |
|---|
| Heart rate (beats/minute) | 77.53 | 10.08 | 76.13 | 5.38 | 0.671 | 0.505 |
| Systolic blood pressure (mmHg) | 127.67 | 11.39 | 128.87 | 9.15 | -0.450 | 0.654 |
The difference in heart rate of patients of Group A and that of Group B was found to be statistically significant at all time intervals of observation [Table/Fig-5].
Between group comparison of heart rate (beats/minute) at different time intervals.
| Variables | Group A(n=30) | Group B(n=30) | Statistical significance |
|---|
| Mean | SD | Mean | SD | ‘t’ | ‘p’ |
|---|
| 0 hour p.o. | 76.67 | 6.63 | 104.40 | 6.84 | -15.951 | <0.001 |
| 1 hour p.o. | 77.87 | 7.12 | 105.00 | 6.10 | -15.850 | <0.001 |
| 3 hour p.o. | 78.43 | 7.12 | 102.40 | 5.31 | -14.771 | <0.001 |
| 6 hour p.o. | 78.73 | 9.03 | 99.73 | 6.03 | -10.595 | <0.001 |
| 12 hour p.o. | 81.00 | 7.50 | 96.80 | 5.45 | -9.338 | <0.001 |
| 24 hour p.o. | 79.33 | 7.65 | 96.13 | 5.80 | -9.582 | <0.001 |
p.o.: Postoperative
At all time intervals of observation, systolic blood pressure of patients of Group B was found to be higher than that of Group A but the differences in systolic blood pressure between the two groups were found to be statistically significant only for 12 hours postoperatively [Table/Fig-6].
Between group comparison of systolic blood pressure (mmHg) at different time intervals.
| Variables | Group A(n=30) | Group B(n=30) | Statistical significance |
|---|
| Mean | SD | Mean | SD | ‘t’ | ‘p’ |
|---|
| 0 hour p.o. | 122.27 | 7.14 | 137.73 | 6.60 | -8.716 | <0.001 |
| 1 hour p.o. | 124.53 | 8.87 | 137.87 | 7.06 | -6.442 | <0.001 |
| 3 hour p.o. | 126.20 | 10.46 | 136.67 | 7.56 | -4.442 | <0.001 |
| 6 hour p.o. | 126.53 | 7.81 | 134.00 | 7.79 | -3.708 | <0.001 |
| 12 hour p.o. | 127.73 | 9.29 | 132.33 | 7.47 | -2.114 | 0.039 |
| 24 hour p.o. | 127.80 | 9.16 | 128.07 | 5.74 | -0.135 | 0.893 |
p.o.: Postoperative
At all the time periods of observation except at 24 hour postoperative grade of pain in Group B was found to be higher than that of Group A and the difference in grade of pain at these intervals was found to be statistically significant (p<0.001 each). At 24 hours postoperative grade of pain in Group A was found to be higher than that of Group B but the difference in grade of pain of Group A and Group B was not found to be statistically significant (p=0.470) [Table/Fig-7].
Between group comparison of postoperative pain (vas score) at different time intervals.
| Time interval (p.o.) | Group | Min. | Max. | Median | Mean | SD | Z* | ‘p’ |
|---|
| 0 hour | Group A | 0 | 0 | 0 | 0.00 | 0.00 | 7.207 | <0.001 |
| Group B | 5 | 7 | 6 | 5.67 | 0.66 |
| 1 hour | Group A | 0 | 0 | 0 | 0.00 | 0.00 | 7.264 | <0.001 |
| Group B | 4 | 6 | 5 | 4.70 | 0.53 |
| 3 hour | Group A | 0 | 1 | 0 | 0.03 | 0.18 | 7.206 | <0.001 |
| Group B | 4 | 5 | 4 | 4.40 | 0.50 |
| 6 hour | Group A | 0 | 2 | 0 | 0.23 | 0.50 | 7.068 | <0.001 |
| Group B | 3 | 6 | 4 | 4.03 | 0.61 |
| 12 hour | Group A | 0 | 2 | 1 | 0.77 | 0.82 | 0.756 | 0.580 |
| Group B | 0 | 3 | 1.5 | 1.30 | 1.09 |
| 24 hour | Group A | 0 | 4 | 1.5 | 1.53 | 1.04 | 0.723 | 0.470 |
| Group B | 0 | 3 | 1.5 | 1.30 | 1.09 |
*: used Man-Whitney U-test
The number of demand dose in Group A ranged from 0 to 3 doses with a mean of 0.43±0.86 doses while that in Group B ranged from 8 to 15 doses and a mean of 10.63±1.89 doses. Difference in mean requirement of demand dose between Group A and Group B was found to be statistically highly significant (p<0.001) [Table/Fig-8].
Between group comparison of number of demand dose.
| Group | Minimun | Maximum | Median | Mean | SD | ‘t’ | ‘p’ |
|---|
| Group A | 0 | 3 | 0 | 0.43 | 0.86 | 26.981 | <0.001 |
| Group B | 8 | 15 | 10.00 | 10.63 | 1.89 |
Amount of fentanyl consumption in Group A ranged from 480 to 516 μg with a mean of 485.60±10.80 μg while that in Group B ranged from 676 to 760 μg and a mean of 707.60±22.61 μg. The difference in mean consumption of fentanyl between Group A and Group B was found to be statistically highly significant (p<0.001) [Table/Fig-9].
Between group comparison of amount of fentanyl consumption after 24 hours of operation.
| Group | Min.(μg) | Max.(μg) | Median | Mean | SD | ‘t’ | ‘p’ |
|---|
| Group A | 480 | 516 | 480 | 485.60 | 10.80 | 48.529 | <0.001 |
| Group B | 676 | 760 | 700 | 707.60 | 22.61 |
No intraoperative or postoperative complication, except hypotension, was observed in any of the patients included in the study. Though the incidence of hypotension was higher in Group A (23.33%) as compared to Group B (6.67%) however, this difference was not found to be statistically significant (p=0.071).
Primary outcome: The primary outcome was to assess the pain by VAS score and it was seen that VAS score was less in patients who received TPVB and IV PCA both (Group A) than the patients who received IV PCA alone (Group B).
Secondary outcomes: The cumulative fentanyl consumption and demand dose were significantly lower in Group A than in Group B at all time points. The haemodynamic variables were comparable between the groups before skin incision; however, heart rate and mean arterial pressure were significantly higher in Group B than Group A after skin incision. No complications were seen except hypotension which was not statistically significant and corrected by volume replacement and vasopressors.
Discussion
In the present study, TPVB with IV PCA and IV PCA alone groups were compared with regard to postoperative pain score, amount of demand dose, amount of fentanyl consumption, haemodynamic parameters and complications. It was found that better analgesia was demonstrated in patients who received preoperative TPVB with iv PCA. The present study showed similar results as done by few other authors [10-13]. However, the present study was different from above these studies as here, one group received preoperative single shot TPVB along with i.v. PCA (fentanyl) infusion for 24 hours with an intermittent bolus dose of fentanyl when the patient required. Above mentioned studies used either TPVB or i.v. PCA with opioid or if used in combination then with different opioid concentrations for postoperative analgesia. There were significantly less fentanyl consumption and less demand dose in the group which received preoperative TPVB, after 24 hour postoperative period. Baik JS et al., Butkovic D et al., and Agarwal A et al., showed similar results [8,14,15].
Preoperative or intraoperative application of PVB decreases acute postoperative as well as chronic pain after surgery in the variety of patient’s populations. PVB is being used for postoperative analgesia management and provides effective analgesia, opioid sparing effect and pre-emptive analgesic effect in many surgical procedures [16-18].
For evaluating the haemodynamic status, changes in heart rate, and systolic blood pressure were observed. At baseline, none of the above variables was found to be statistically significant (p>0.05) in both the groups, changes in heart rate and systolic blood pressure from baseline (0 hour i.o.) till 24 hours postoperatively were observed. Both the variables were comparable in the preoperative period. Baseline values were noted, as the actual changes in haemodynamic may be due to intraoperative blood loss or anaesthetic management. That’s why heart rate and systolic blood pressure were compared with baseline values rather than preoperative values while assessing the effect of block on haemodynamic changes. Better haemodynamic stability (heart rate and systolic blood pressure) during the intraoperative period and postoperative period was seen in the group which received PVB before incision and was statistically significant (p<0.001). This finding was most probably due to the pre-emptive analgesic effect of PVB.
Though in the present study incidence of hypotension occurred in six patients, five from the group that received TPVB with i.v. PCA (Group A) and one from the control group that received i.v. PCA alone (Group B) however, in all six patients, it was observed that hypotension occurred at approximately the middle of surgery and was related to surgical complication (due to blood loss). Hypotension was corrected by i.v. fluids and i.v. mephentermine. No other complications were found in the study.
Limitation
Limitations of the study included that patients in Group B did not receive a TPVB, hence the study was only observer blinded and patients were observed for only 24 hours postoperatively, so long term beneficial effects of TPVB could not be seen.
Conclusion
Thoracic para vertebral block provides excellent and prolonged postoperative analgesia, significantly reduced consumption of fentanyl and rescue analgesia and less demand dose in the postoperative period, good opioid sparing and excellent pre-emptive effect in patients undergoing nephrectomy. Different doses of fentany with TPVB can be tried for adequate analgesia with minimal side-effects.
p.o.: Postoperative
p.o.: Postoperative
*: used Man-Whitney U-test