Introduction
A capnogram shows the concentration of Carbon Dioxide (CO2) in the respiratory gases of human lungs. An accurate capnogram measurement and features can provide valuable information about cardiorespiratory disorders, e.g., Chronic Obstructive Pulmonary Disease (COPD), asthma, pneumonia, and Congestive Heart Failure (CHF) [1-3]. Of these, asthma has the second highest incidence among respiratory disorders and is considered the fourteenth most common illness in the world [4]. Over the last few decades, asthma has become a serious threat to human life and has attracted significant research interest in its early diagnosis. A total of 334 million people are affected by asthma, of which 14% are children and 8.6% young adults [4]. Asthma is no longer considered a disease of well-developed countries because it equally affects the population of developing and under-developed countries, and its prevalence is increasing at an alarming rate [4].
In Malaysia, asthma affects around 10-13% of the total population, as per the national health and morbidity survey, with Malays, Indians, and Chinese constituting 67%, 12.9%, and 7.3%, respectively [5]. On the other hand, a survey conducted by the Asthma Council of Malaysia indicated that 66% of asthmatics have never undergone a lung-function test, owing to a shortage of diagnostic devices [5]. Additionally, existing diagnostic devices are patient dependent, require patient co-operation, and cannot be used with children under five-year-old. Hence, a significant need exists for an effort-independent method, e.g., capnography, to assess the respiratory function of these patients.
The major challenges for developing such an effort-independent device include identifying the best monitoring technology and optimal parameters with sufficient sensitivity and specificity to assess the respiratory function and its changes. We believe that capnography and the parameters derived from a capnogram can meet this challenge. Hence, a rigorous and extensive search was carried out from July 2017 to January 2018 by employing standard english language (UK style) with Google Scholar, the Web of Science, PubMed, and Scopus using different keywords (CO2 sensor, infrared sensor, respiratory CO2 monitoring device, asthma monitoring device, capnograph, capnogram) to identify appropriate CO2 sensors, technology, and capnogram features. Based on our literature review, we propose a hand-held capnograph device that can be used as an asthma-monitoring device in the home environment and assist in following the progression and management of asthma.
To date, several studies have made great strides towards identifying and quantifying cardio-respiratory conditions, specifically, asthma, using a capnograph [1-3,6-21]. However, commercially available time-based capnographs are bulky, costly, inadequate for estimating the lung’s Ventilation-Perfusion (V/Q) status, and incapable of estimating physiological dead-space components. In addition, the starts of the expiration and inspiration phases are not reliably distinguished in a capnogram because of the presence of dead space and rebreathing, respectively [22,23].
During the last decade, only a few studies [24-32] have been conducted to overcome the limitations of existing capnography and developing capnography using mainstream and sidestream techniques in line with cardiorespiratory analysis. Santoso and Dalu Setiaji developed a sidestream Infrared (IR) capnograph and successfully tested it during a laparoscopic surgery [24]. However, the chosen microcontroller had limited data memory, program memory, and a Universal Asynchronous Receiver-Transmitter (UART) serial-communication device that restricted the program and communication mode. In addition, the device used two displays, which increased the system complexity and the device computation cost. Moreover, a different CO2 sensor would be necessary to avoid false readings because the current sensor is not internally calibrated with respect to changes in atmospheric pressure and temperature [24].
Bautista C et al., designed and tested a microcontroller-based wireless capnograph using a Sprint IR sensor and LED display, which was found to be poorly correlated with the cardiorespiratory condition [25]. Other researchers reported the development of capnography using the MG811, Sprint IR, and CDM4160-H00 modules [25-32]. However, sufficient verification is needed to confirm the precision of the device. Further, in terms of technology, we prefer to use a sidestream technique since it is simpler, more convenient, and has no sterilization problems compared with the mainstream airway adapter. It can be used when a patient is in an unusual position and is the predominant form of monitoring in hospital settings [1,22,24]. Hence, we propose a handheld capnography device based on sidestream technology that incorporates software to calculate the capnogram features, which can be used to assess cardiopulmonary conditions, specifically asthma, in home environments.
When developing a capnograph, choosing an appropriate CO2 sensor plays a vital role and remains challenging in line with the application, monetary value, accuracy, sensitivity, and specificity [33]. Several CO2 sensor technologies are available to measure CO2 during respiration. Among them, a low-cost yet sensitive technique is Non-Dispersive Infrared (NDIR) spectroscopy [34]. Therefore, we reviewed a wide range of low-cost NDIR CO2 sensor modules with their corresponding specifications [Table/Fig-1] [35-47].
Different types of non-dispersive infrared CO2 sensors and their specifications.
| CO2 Sensor | Operating Voltage (Volt) | Range (in % CO2) | Operating Temperature (°C) | Sensitivity/Accuracy (%) | Weight/Size (Approx. in grams) | Approx. Cost (in $) | Warm-up time (s) | Response time (s) | Application | References |
|---|
| COMET-I, II | 5 | 0-13.8 | 5 to 55 | ±0.42% | <7.0 | 400 | 2-15 | 0.028 | CO2 partial pressure, respiration rate, end-tidal CO2, inspired CO2, inspiration and expiration times | [27,35] |
| CAPM | 5 | 0-21 | 0 to 40 | ±0.28% | >10 | 500 | 2-10 | <20 | CO2 Measurement and respiration rate | [36] |
| MG 811 | 6 | 0.035-1 | -20-50 | Highly Sensitive, | 60 | 43.55 | 300 | <60 | Air Quality Control Ferment Process Control Room Temperature CO2 concentration Detection | [32,37] |
| MH410 | 3.5-5.5 | 0-100 | -20-50 | 0.05% | 20 | 80 | 90 | <30 | Widely Used for CO2 Detection | [38] |
| MISIR | 3.5-5.5 | 0-0.5 | 0 to 50 | ±0.005%; ±3% of reading | 10 | 115 | 120 | <20 | CO2 Detection | [39] |
| OGS-410 | 5-6 | 0-0.2 (Standard) 0-0.5 | 0 to 50 | 85 V/W | 5 | 125 | <1120 | 30 | Indoor air quality monitoring, Obstructive Sleep Apnea monitoring, Industrial control, Climate Control for Automobiles, Combustion Control for Furnace Greenhouse | [40] |
| TGS4161 | 5.0 | 0.035-1 | -10 to 50 | approx. ±20% at 0.1% CO2 | 50 | 50.01 | 43200 | 90 | Indoor air quality control, CO2 monitors | [41] |
| Sprint IR | 3.3 V-5 V | 0 to 100 | 0 to 50 | ±0.007%; +/- 5% of reading | 8 | 230 | <60 | 0.05 | Measurement of CO2 concentrations, Metabolic Assessment and Analytical Instrumentation. | [6, 25] |
| IR Prime 2 | 3 to 5 | 0-0.5 | -30 to 60 | ±3% of range up to 50% of range | 1[27, 28]8.0 | 266 | <60 | <30 | To be used to read CO2 gas | [42] |
| K30 | 5.5-14 | 0-1 | 0 to 50 | ±0.003% at ±3% of measured value | 7 | 85 | <60 | 20 | Air handling units; Alarm sensor housings; Fresh air ventilators; Air conditioning in cars; Kitchen appliances, fans Automatic window openers; Combustion controls | [43] |
| K33 | 6-14 | 0-1 | -40 to 60 | ±0.003%; ±3% of measured value | 6 | 249 | <180 | 60 | Measure up to 10,000 ppm (1%) carbon dioxide, temperature, and relative humidity in remote locations. | [44] |
| COZIR-WR | 3.2 to 3.4 | 0-5, 0-20, 0-65 | 0 to 50 | ±0.007%; ±5% of reading | 20 | 109 | <10 | 4-120 | CO2 detection | [45] |
| CO2 Sensor 27929 | 6.5-12 | 0.035-1 | 0 to 70 | High Sensitivity | 4 | 43.55 | >20 | >10 | Gas level over-limit alarm; Stand-alone/background sensing device; Environmental monitoring equipment | [46] |
| Digital CO2 Sensor EE893 | 4.75-7.5 | 0-0.2/0.5/1 | -40- to 60 | 0-0.2%: < ±(0.005% at ±2% of measuring value) | 10 | 299 | 15 | 105 | Data loggers; Handhelds; Wireless transmitters; Building management; Demand controlled ventilation | [47] |
This paper is structured as follows. Section 2 compares the specifications of the different infrared CO2 sensors. Section 3 presents capnogram features that correlate with cardiopulmonary diseases. Section 4 elucidates the preliminary findings of the pressure and temperature study. The proposed capnograph for asthma assessment is described in Section 5. Conclusions are presented in Section 6.
COMPARATIVE STUDY OF CO2 SENSORS ALONG WITH THEIR SPECIFICATIONS
A comparative study has been carried out on the specifications of infrared CO2 sensors to identify the optimum CO2 sensor. These specifications include the operating voltage, output range in percentage, operating temperature, sensitivity, weight, approximate cost, applications, and warm-up and response times. These specifications were selected to identify the best CO2 sensor as per the application, and to develop an accurate and low-cost capnograph that can be used to assess cardiorespiratory diseases. The most commonly used infrared CO2 sensors, along with their specifications, available in the market is listed in [Table/Fig-1].
The power requirements play a significant role when developing a hand-held capnograph, since greater power consumption may require the use of power-supply circuits that make the device bulky, expensive, non-portable, and complex. In addition, the maximum power supply reflects on the device’s expected use, including the environment, available resources, and device-failure impact.
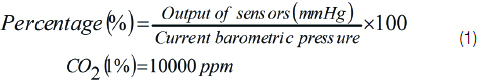
where the current barometric pressure is considered 760 mmHg.
Moreover, since the output of human respiratory CO2 measurements falls between 35,000 and 50,000 parts per million (ppm) (3.5%-5%) at sea level [48] and conversion takes place using Equation (1), only limited sensors can be used to detect human respiratory CO2. In addition, the sensor’s output measurement units should be mmHg and percentage, since they are preferred and more appropriate than ppm for this application. The sensor weight has a great impact on the bulkiness of the device; hence, it should be as light as possible to develop a more compact device.
The warm-up and response times of the sensor play a key role in developing an accurate and rapid device. Hence, their values should be as small as possible to minimize the changes to the capnogram waveform shape. Furthermore, the cost and intended application of each sensor listed in [Table/Fig-1] reveals that, although the CAPM, COMET, and Sprint IR sensors are more expensive than the other sensors, they are more capable of detecting human respiratory CO2.
After critically analysing the specifications of the listed sensors, we suggest using COMET, CAPM, MH410, Sprint IR, or COZIR-WR for measuring human respiratory CO2. The warm-up and response times of the MH410, COZIR-WR, and Sprint IR sensors are greater than the COMET and CAPM.
Thus, we consider the COMET and CAPM CO2 sensors to be more appropriate, reliable, and precise for developing a capnograph. Further, we have discussed significant capnogram features that may possibly use for monitoring asthmatic conditions.
Capnogram Features
Several features, e.g., such as end-tidal carbon-dioxide partial pressure (PetCO2), Respiratory Rate (RR), time spent at PetCO2, duration for which the CO2 partial pressure remains at its maximum value, exhalation duration, Hjorth parameters (activity, mobility, and complexity), end exhalation slope (α angle), Slope Ratio (SR), and Area Ratio (AR), have been proposed as indicators for cardiopulmonary diseases by several researchers [1-3,6-21]. In addition, the PetCO2 and RR features have been proposed as predictors of extubation post-laparoscopic surgery [24]. The capnogram features as observed with oesophageal intubation, Obstructive Diseases (OD), Restrictive Diseases (RD), and normal health are presented in [Table/Fig-2].
Capnogram features associated with cardiopulmonary diseases.
| Capnogram features | Cardio pulmonary diseases | Authors |
|---|
| Slope of Phase II and III, and α angle | Asthma | Howe, et al. (2011) |
| Exhalation Duration, PetCO2, time spent at PetCO2 and exhalation slope | COPD, CHF | Mieloszyk, et al. (2014) |
| A1 and A2 (area), Area ratio (AR), S1 and S2 (Slope), SR (slope ratio), AR (area ratio), α angle, HP1 and HP2 (activity), HP1 and HP2 (mobility) | Asthma | Kean et al., (2010) |
| PetCO2 | Asthma | Bridgette et al., (2007) |
| Te, Ti, Ttot, S1, S2, SR, AA, DA | Extubation outcomes during mechanical ventilation | Rasera et al., (2015) |
| Power spectral density (PSD) | Asthma Severity | Kazemi et al., (2013) |
| PetCO2 and RR | Laparoscopic Surgery | Santoso and Dalu Setiaji (2014) |
HP: Hjorth’s parameter; Te: Expiratory time; Ti: Inspiratory time; Ttot: Respiratory cycle total time; S1: Initial slope; S2: Slope of phase III; SR: Slope ratio; AA: Ascending angle; DA: Descending angle; PetCO2: Maximum CO2 values; COPD: Chronic obstructive pulmonary disease; Congestive heart failure (CHF).
[Table/Fig-2] illustrates the capnogram and features associated with cardiopulmonary diseases. Howe TA et al., evaluated three parameters (slopes of phase II and III, α angle) as measures of an asthmatic condition and found that the slope of phase III and the α angle were highly correlated with an asthmatic condition than the slope of phase II [19]. Mieloszyk RJ et al., reported four features (exhalation duration, PetCO2, time spent at PetCO2, and exhalation slope) that can differentiate COPD normal and COPD/CHF and advocated that these features might be useful for screening other cardiorespiratory disorders [1]. Kean TT et al., presented 13 features associated with capnograms, e.g., A1 and A2 (area), S1 and S2 (slope), SR (slope ratio), AR (area ratio), α angle, HP1 and HP2 (activity), and HP1 and HP2 (mobility) [18]. Of these, AR, SR, and HP1 (activity) were more highly correlated than the other features for differentiating asthmatic and non-asthmatic conditions.
Guthrie BD et al., reported a strong correlation between PetCO2 and an asthmatic condition. However, further investigation is required on large samples to generalize their findings [15]. In addition, Kazemi M et al., claimed that the capnogram frequency components can reflect the asthmatic condition [9]. They found that non-asthmatic capnograms have one component in their power-spectral density (PSD) estimation, in contrast to asthmatic capnograms, which have two components. They also reported that the frequency component for the asthmatic patient has a larger amplitude than normal, which increases with the asthma severity level. However, implementation of their finding in real time remains challenging.
The capnogram features also have a strong correlation with other physiological conditions (extubation outcomes and laparoscopic surgery) as presented by Rasera CC et al., and Santoso D et al. [21,24]. Hence, we propose a user-operable and handheld capnography device incorporated with a capnogram feature for assessing the asthmatic condition, which can be used in a home environment. Hence, extracting features from the capnogram while developing a capnography device is significant, as this can provide valuable information about the cardiorespiratory status.
Effect of Pressure and Temperature on a CO2 Sensor
A simulation study was performed to understand the effect of pressure and temperature changes on the CO2 output using Proteus software. Equation 1 was used to analyse the effect of the pressure and temperature on the CO2, as presented in Equation (2) [49].
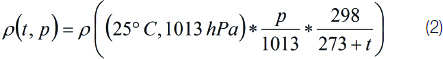
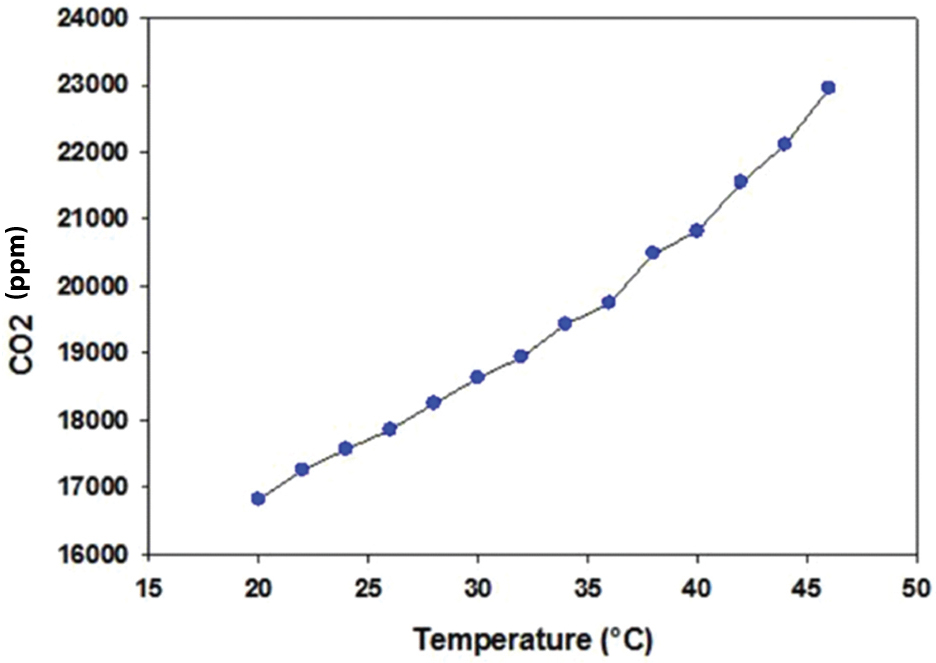
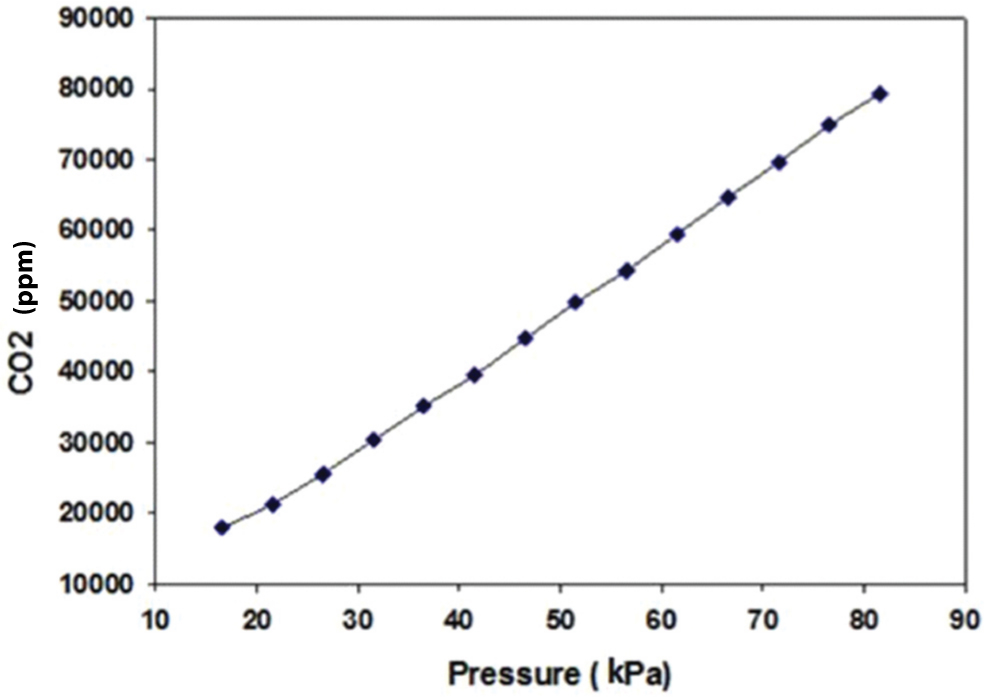
To calibrate the pressure and temperature effects, we first changed the temperature while keeping the pressure constant (16.53 kPa). It was observed that the CO2 output changed corresponding to the change in temperature from 20 to 46°C, as illustrated in [Table/Fig-3]. In contrast to the temperature, when we varied the pressure from 16.53 kPa to 81.53 kPa while keeping the temperature constant (25°C), the CO2 output changed drastically from 17,853.19 ppm to 86,321.29 ppm, as illustrated in [Table/Fig-4]. The results confirmed that both pressure and temperature have a significant effect on the CO2 output. Hence, they should be considered when developing a respiratory CO2 measurement device and should be set internally when designing a CO2 sensor by incorporating barometric pressure and temperature sensors. These sensors assist in compensating the CO2 reading, based on the current temperature and barometric pressure, to avoid false readings or alterations in the capnogram shape after a certain time interval. Furthermore, capnogram features should be incorporated into the capnograph device to correlate with the asthmatic condition, as discussed in the next section.
Temperature vs. CO2 output.
Proposed Capnograph for Asthma Assessment
Upon critical review, we propose a user-friendly, inexpensive, and handheld capnography device based on sidestream technology for assessment of cardiorespiratory conditions, as presented in [Table/Fig-5] [50]. A minimal set of parameters to assess cardiopulmonary was reported by the proposed device, including end-tidal carbon dioxide (PetCO2), Respiratory Rate (RR), inspired carbon dioxide (ICO2), and Hjorth’s parameter (activity) as these features have the potential to differentiate pulmonary conditions, reported by Kean TT et al., Brown LH et al., Lamba S et al., Guthrie BD et al., and Kesten S et al., [2,7,8,15,51]. Each part of this has been explained in a subsequent section.
Block diagram of proposed asthmatic device.
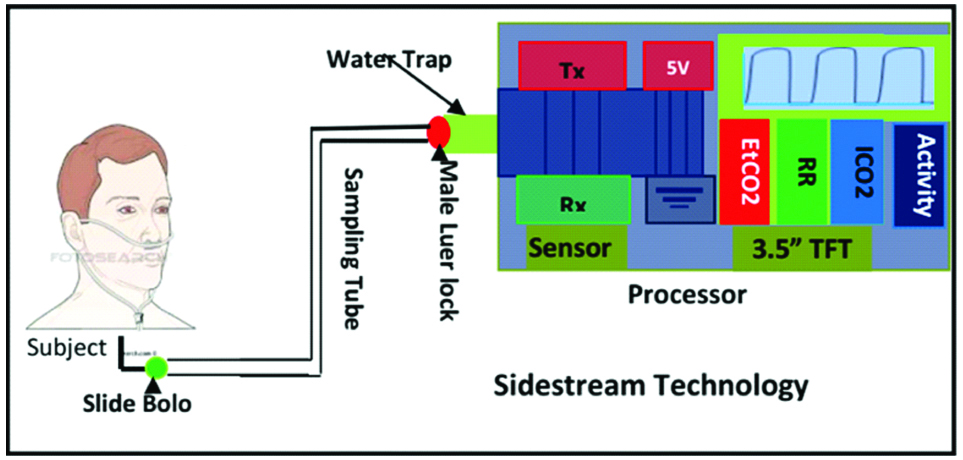
CO2 Acquisition Unit
The CO2 acquisition unit comprises five major components: a nasal cannula, water trap, pump, motor, and CO2 sensor. The nasal cannula (7 feet long) was placed between the water trap and the subject’s nose to transport the CO2 samples. The water trap was used to trap the moisture and the subject’s secretions while maintaining the shape of the CO2 waveform. In addition, hydrophobic (0.2 μ hydrophobic porous) and particulate (200 microns) filters were integrated with the water trap to eliminate the remaining water vapour from the gas sample while maintaining a laminar flow, which minimizes the distortion of the CO2 waveform.
Thereafter, CO2 samples were drawn from the cannula to the CO2 sensor at the speed of 50 mL/min using a pump and Direct-Current (DC) motor, so the proposed device can be used at a higher respiratory rate (150 bpm). Furthermore, an NDIR CO2 sensor was used to continuously measure the amount of CO2 during expiration and inspiration [52]. The sensor has three-pin UART communication at the Transistor-Transistor Logic (TTL) level for transmitting and receiving the CO2 data from the sensor to the processor and vice-versa.
Significance of CO2 sensor: The COMET CO2 sensor equivalent sensor was used for acquiring the CO2 signal from the subject through a medical face mask or nasal cannula, as per the recommendation of Acker J et al., [27]. The sensor is highly selective and sensitive to CO2 gas [53,54]. This sensor is selected for its unique specifications (weight, response time, warm-up time, output range, sampling rate (100 Hz), and operating voltage range). Furthermore, signal pre-processing was performed to limit the bandwidth of the CO2 signal.
Pre-processing: The CO2 sensor output was amplified using an amplifier (AD 8553) and then passed through a low-pass filter at fL=10 Hz with two poles in agreement with earlier study [55], and a high-pass filter at fH=0.1 Hz with two poles to limit the bandwidth and increase the sharpness of the CO2 signal.
Processor
The Arduino Mega 2560, an open-source microcontroller board, was used to process the CO2 samples for computation and transmission purposes [56-59]. It receives expired CO2 data from the CO2 sensor and transmits those values via the computer’s serial port, which is not possible with the Arduino Uno [60], for a higher baud rate (19200, 115200). The Arduino Integrated Development Environment (IDE) was used to develop the program for the acquisition, filtering, feature extraction, and display of the CO2 signal [61,62]. The technical detail and implemented algorithm can be found elsewhere [50]. Furthermore, a post-processing was performed which includes Finite Impulse Response (FIR) band-pass filter of two poles with bandwidth (0.1-10 Hz) to limit the bandwidth and the moving average filter (span, 8) for capnogram signal smoothing were employed [50].
Display Unit
A high resolution 3.5”; display {Adafruit Thin-Film-Transistor (TFT)} was used to display the capnogram and other features. It can be driven by a minimal power supply (3 V). Moreover, it has a built-in controller with RAM buffering, which reduces the processor’s computation time [63]. The data is transferred to the display unit via a Serial Peripheral Interface (SPI). The SPI mode requires only five pins (SPI data in, data out, clock, select, and DC). The implementation is simple, fairly flexible, and easy to port to various microcontrollers. It also allows the use of a micro Secure Digital (SD) card on the same SPI bus, which is not supported by other organic LED displays. Hence, this display module (TFT-3.5”;) was used to develop a small, handheld and user-operable capnography device.
Signal Post-Processing
The acquired CO2 signal will be transferred to the Labview® system-design software via serial communication in order to extract more precise and significant feature to classify the asthma severity level [64,65]. Here, we will extract the time-frequency component of each breath using a wavelet transform because it provides time-localized spectral information for the signal as a distribution function in terms of time and frequency. These distributions are useful for displaying the time-frequency content of the capnogram during severe asthma conditions. Here, a Haar wavelet transform will be applied to extract the detail and approximate coefficients for the slope of phase III for each breath signal; the transform can reduce the detail coefficients of the first decomposition level by 40% [66]. This helps to improve the feature-selection performance and the classification steps of the decision-support system. Finally, a support vector machine classifier model will be applied to classify the asthma severity level based on the features.
Conclusion and Remarks
This study investigated and compared previous research work on non-dispersive infrared CO2 sensors. A wide range of sensors were identified, and their corresponding specifications were extensively reviewed. These specifications included operating voltage, operating temperature, weight, approximate cost, response time, warm-up time, output range, and applications. Through this study, it was found that both the COMET and CAPM CO2 sensors could be more appropriate and reliable for developing a home-based asthma-monitoring device, because of their output range which falls between 0-99 mmHg and 0-150 mmHg, respectively weight, and warm-up and response times. Additionally, they measured the respiration rate, end-tidal CO2, inspired CO2, and inspiration and expiration times. Therefore, by using the COMET equivalent CO2 sensors, a small, hand-held, precise, and quantitative capnography device has been developed. On the other hand, adding an amalgamation of capnogram features, e.g. the slope of phase II, α angle, slope ratio, area ratio, and frequency components, while developing the device will provide a breakthrough in understanding respiratory distress, specifically asthma. Moreover, Kazemi M et al., You B et al., Yaron M et al., Howe TA et al., Kean TT et al., conducted correlation studies on 30, 20, 128, 30, 16, and 73 asthmatic patients, respectively, in offline mode, and concluded that measuring the slope, α angle, slope ratio, and frequency components from the expiration phase of the capnogram signal could provide significant information about the asthmatic condition [9-11,16,18]. Hence, the viability of the claimed features while developing a capnograph device should be verified in future work.
HP: Hjorth’s parameter; T
e: Expiratory time; T
i: Inspiratory time; T
tot: Respiratory cycle total time; S1: Initial slope; S2: Slope of phase III; SR: Slope ratio; A
A: Ascending angle; D
A: Descending angle; PetCO2: Maximum CO2 values; COPD: Chronic obstructive pulmonary disease; Congestive heart failure (CHF).
[1]. Mieloszyk RJ, Verghese GC, Deitch K, Cooney B, Khalid A, Mirre-González MA, Automated quantitative analysis of capnogram shape for COPD–Normal and COPD-CHF classificationIEEE Trans Biomed Eng 2014 61(12):2882-90.10.1109/TBME.2014.233295424967981 [Google Scholar] [CrossRef] [PubMed]
[2]. Kean TT, Malarvili MB, Analysis of Capnograph for Asthmatic PatientIn Signal and Image Processing Applications (ICSIPA), 2009 IEEE International Conference 2009 :464-467. [Google Scholar]
[3]. Krauss B, Advances in the use of capnograph for non-intubated patientsIsraeli J Emerg Med 2008 8:3-15. [Google Scholar]
[4]. Marks G, Strachan D, Asher I, The Global Asthma Report 2014Available from: http://www.globalasthmareport.org/burden/burden.php. [Access: 14 December 2015] [Google Scholar]
[5]. Institute for Public Health. The Third National Health and Morbidity Survey (NHMS III) 2006, vol 1. Ministry of Health, Malaysia, 2008 [Google Scholar]
[6]. Malik SA, Singh OP, Nurifhan A, Malarvili MB, Portable Respiratory CO2 Monitoring Device for Early Screening of AsthmaProc. ACEC 2016 :90-94. [Google Scholar]
[7]. Brown LH, Gough JE, Seim RH, Can Quantitative Capnometry Differentiate Between Cardiac and Obstructive Causes of Respiratory Distress?Chest 1998 113(2):323-326.10.1378/chest.113.2.3239498946 [Google Scholar] [CrossRef] [PubMed]
[8]. Lamba S, Gluckman W, Nagurka R, Rosania A, Bechmann S, Langley DJ, Initial Out-of-Hospital End-Tidal Carbon Dioxide Measurements in Adult Asthmatic PatientsAnn. Emerg. Med 2009 54(3):S5110.1016/j.annemergmed.2009.06.193 [Google Scholar] [CrossRef]
[9]. Kazemi M, Krishnan MB, Howe TA, Frequency analysis of capnogram signals to differentiate asthmatic and non-asthmatic conditions using radial basis function neural networksIran J Allergy Asthma Immunol 2013 12(3):236-46. [Google Scholar]
[10]. You B, Peslin R, Duvivier C, Vu VD, Grilliat JP, Expiratory capnography in asthma: Evaluation of various shape indicesEur Respir J 1994 7(2):318-23.10.1183/09031936.94.070203188162985 [Google Scholar] [CrossRef] [PubMed]
[11]. Yaron M, Padyk P, Hutsinpiller M, Cairns CB, Utility of the expiratory capnogram in the assessment of bronchospasmAnn Emerg Med 1996 28(4):403-07.10.1016/S0196-0644(96)70005-7 [Google Scholar] [CrossRef]
[12]. Egleston CV, Ben Aslam H, Lambert MA, Capnography for monitoring non-intubated spontaneously breathing patients in an emergency room settingJ Accid Emerg Med 1997 14(4):222-24.10.1136/emj.14.4.2229248908 [Google Scholar] [CrossRef] [PubMed]
[13]. Krauss B, Deykin A, Lam A, Ryoo JJ, Hampton DR, Schmitt PW, Capnogram shape in obstructive lung diseaseAnesthesia & Analgesia 2005 100(3):884-92.10.1213/01.ANE.0000146520.90393.9115728084 [Google Scholar] [CrossRef] [PubMed]
[14]. Corbo J, Bijur P, Lahn M, Gallagher EJ, Concordance between capnography and arterial blood gas measurements of carbon dioxide in acute asthmaAnn Emerg Med 2005 46(4):323-27.10.1016/j.annemergmed.2004.12.00516187465 [Google Scholar] [CrossRef] [PubMed]
[15]. Guthrie BD, Adler MD, Powell EC, End-tidal carbon dioxide measurements in children with acute asthmaAcad Emerg Med 2007 14(12):1135-40.10.1197/j.aem.2007.08.00718045887 [Google Scholar] [CrossRef] [PubMed]
[16]. Howe TA, Jaalam K, Ahmad R, Sheng CK, Nik Ab Rahman NH, The use of end-tidal capnography to monitor nonintubated patients presenting with acute exacerbation of asthma in the emergency departmentJ Emerg Med 2009 41(6):581-89.10.1016/j.jemermed.2008.10.01719272745 [Google Scholar] [CrossRef] [PubMed]
[17]. Hisamuddin NN, Rashidi A, Chew KS, Kamaruddin J, Idzwan Z, Teo AH, Correlations between capnographic waveforms and peak flow meter measurement in emergency department management of asthmaInt J Emerg Med 2009 2(2):83-89.10.1007/s12245-009-0088-920157449 [Google Scholar] [CrossRef] [PubMed]
[18]. Kean TT, Howe TA, Malarvili MB, Feature Extraction Of Capnogram For Asthmatic PatientIn Computer Engineering and Applications (ICCEA), 2010 Second International Conference 2010 :251-155.10.1109/ICCEA.2010.286 [Google Scholar] [CrossRef]
[19]. Howe TA, Jaalam K, Ahmad R, Sheng CK, Ab Rahman NH, The use of end-tidal capnography to monitor non-intubated patients presenting with acute exacerbation of asthma in the emergency departmentJ Emerg Med 2011 41(6):581-589.10.1016/j.jemermed.2008.10.01719272745 [Google Scholar] [CrossRef] [PubMed]
[20]. Balakrishnan M, Kazemi M, Howe TA, A review of capnography in asthma: A new approach on assessment of capnogramInvited Review, Biotechnol. Bioinf. Bioeng 2012 2:555-566. [Google Scholar]
[21]. Rasera CC, Gewehr PM, Domingues AM, PETCO2 measurement and feature extraction of Capnogram signals for extubation outcomes from mechanical ventilationPhysiol Meas 2015 36(2):231-42.10.1088/0967-3334/36/2/23125582400 [Google Scholar] [CrossRef] [PubMed]
[22]. Kumar AY, Bhavani-Shankar K, Moseley HS, Delph Y, Inspiratory valve malfunction in a circle system: pitfalls in capnographyCan J Anaesth 1992 39(9):997-99.10.1007/BF030083531451230 [Google Scholar] [CrossRef] [PubMed]
[23]. Shin JH, Lee JS, Choi SH, Lee DK, Nam H, Cha GS, A planar pCO2 sensor with enhanced electrochemical propertiesAnal Chem 2000 72(18):4468-73.10.1021/ac000427o11008785 [Google Scholar] [CrossRef] [PubMed]
[24]. Santoso D, Setiaji FD, Design and implementation of capnograph for laparoscopic surgeryInternational Journal of Information and Electronics Engineering 2013 3(5):523-28.10.7763/IJIEE.2013.V3.370 [Google Scholar] [CrossRef]
[25]. Bautista C, Patel B, Shah M, Connie L, Seifer B, Facas G, Portable capnographyAvailable from: http://portablecapnography.weebly.com/uploads/8/0/5/5/8055239/nebec_portable_capnography.Pdf [Accessed: 5 October 2017] [Google Scholar]
[26]. Abderrahim H, Berrebia M, Hamou A, Kherief H, Zanoun Y, Zenata K, Measure of carbon dioxide using a gas sensor of a semiconductor type based on tin dioxide (SnO2)J Mater Environ Sci 2011 2:94-103. [Google Scholar]
[27]. Acker J, Christensen D, Falligant JC, Insko MA, Klaus J, Montgomery FJ, End-tidal gas monitoring apparatusUnited States patent application US 14/129,760 2015 [Google Scholar]
[28]. Cameron JN, Carbon dioxide measurement systemUnited States patent US 4,321,545 1982 [Google Scholar]
[29]. Cao H, Hsu LC, Ativanichayaphong T, Sin J, Stephanou HE, Chiao JC, An Infant Monitoring System Using CO/sub 2/Sensors. In RFID, 2007IEEE International Conference 2007 :134-140.10.1109/RFID.2007.34616117368104 [Google Scholar] [CrossRef] [PubMed]
[30]. Folke M, Hök B, A new capnograph based on an electro acoustic sensorMed Biol Eng Comput 2008 46(1):55-59.10.1007/s11517-007-0228-417846809 [Google Scholar] [CrossRef] [PubMed]
[31]. Weil MH, Tang W, Bisera J, inventors; Institute of Critical Care Medicine, assignee. Patient CO2 measurement. United States patent US 6,055,447.2000 [Google Scholar]
[32]. Binti Zaharudin SZ, Kazemi M, Malarvili MB, Designing a respiratory CO2 measurement device for home monitoring of asthma severityInBiomedical Engineering and Sciences (IECBES), 2014 IEEE Conference 2014 :230-34.10.1109/IECBES.2014.7047492 [Google Scholar] [CrossRef]
[33]. Kwon J, Ahn G, Kim G, Kim JC, Kim H, A study on NDIR-based CO2 sensor to apply remote air quality monitoring systemInICCAS-SICE 2009 :1683-87. [Google Scholar]
[34]. Swickrath M, Anderson M, McMillin S, Broerman C, Application of Commercial Non-Dispersive Infrared Spectroscopy Sensors for Sub-ambient Carbon Dioxide DetectionIn 42nd International Conference on Environmental Systems 2011 :345410.2514/6.2012-3454 [Google Scholar] [CrossRef]
[35]. Ricciardelli RH, COMET CO2 Sensors DatasheetTechnical ReportAvailable from: http://www.treymed.com/capno/sensor/sensor.htm. [Access: 14 December 2015] [Google Scholar]
[36]. Yin MW, CAPM-M CO2 gas sensor datasheetAvailable from: http://www.chinautech.com/. [Accessed 13 November 2015] [Google Scholar]
[37]. Bhide AA, Nalbalwar SL, Measurement of atmospheric Carbon Dioxide using multi sensor approachInternational Journal of Scientific & Engineering Research 2013 4(8):231-35. [Google Scholar]
[38]. Zhengzhou Winsen Electronics Technology Co., L. CO2 gas sensor module (MH410) datasheet. Technical Report. Available from: http://www.winsen-sensor.com/. [Accessed: 6 October 2017] [Google Scholar]
[39]. Hicks, R.I. CO2 gas sensor module (MISIR) datasheet. Technical Report. Available from: http://www.CO2meter.com/products/misir-5000ppmCO2-sensor. [Accessed: 15 September 2015] [Google Scholar]
[40]. OST. CO2 gas sensor module (OG410) datasheet. Technical Report. Available from: http://www.orisystech.com/product_detail-lang-en-cid-10-sid-29-id-15.html. [Accessed: 20 November 2015] [Google Scholar]
[41]. Lee TJ, Lee O, Kim J, Shterengas L, CO2 sensor with data logger system. InSystems, Applications and Technology Conference (LISAT), 2012 IEEE Long Island 2012 :1-7.10.1109/LISAT.2012.6223210 [Google Scholar] [CrossRef]
[42]. Clairair. CO2 gas sensor module (Prime IR sensor) datasheet. Techincal Report. Available from: http://www.clairair.co.uk/products/prime-irsensors/. [Accessed: 15 December 2015] [Google Scholar]
[43]. Mendes LB, Ogink NW, Edouard N, van Dooren HJ, Tinôco Ide F, Mosquera J, NDIR gas sensor for spatial monitoring of carbon dioxide concentrations in naturally ventilated livestock buildingsSensors 2015 15(5):11239-57.10.3390/s15051123925985166 [Google Scholar] [CrossRef] [PubMed]
[44]. Ratterman M, Shen L, Klotzkin D, Papautsky I, Carbon dioxide luminescent sensor based on a CMOS image arraySensors and Actuators B: Chemical 2014 198:1-6.10.1016/j.snb.2014.02.022 [Google Scholar] [CrossRef]
[45]. Gibson D, MacGregor C, A novel solid state non-dispersive infrared CO2 gas sensor compatible with wireless and portable deploymentSensors 2013 13(6):7079-103.10.3390/s13060707923760090 [Google Scholar] [CrossRef] [PubMed]
[46]. Inc., P. CO2 gas sensor module (27929) datasheet. Available from: http://www.digikey.com/Suppliers/us/Parallax.page?lang=en.Omni. [Accessed: 16 December 2016] [Google Scholar]
[47]. S.T.L. CO2 gas sensor module Digital CO2 Sensor EE893 datasheet. Available from: http://www.sensorsandtransmitters.com/product/ee893- CO2-module. [Accessed 12 January 2016] [Google Scholar]
[48]. Pdsr. Carbon dioxide Monitoring. Available from: http://www.nurse-anesthesia.org/archive/index.php/t-11551.html. [Accessed 20 August 2016] [Google Scholar]
[49]. Vaisala, V. How to Measure Carbon Dioxide. Technical Report. Available from: www.vaisala.com. [Accessed 15 September 2015] [Google Scholar]
[50]. Singh OP, Howe TA, Balakrishnan M, Real-time human respiration carbon dioxide measurement device for cardiorespiratory assessmentJ Breath Res 2018 12(2):02600310.1088/1752-7163/aa8dbd28928295 [Google Scholar] [CrossRef] [PubMed]
[51]. Kesten S, Maleki-Yazdi MR, Sanders BR, Wells JA, McKillop SL, Chapman KR, Respiratory Rate during Acute AsthmaChest 1990 97(1):58-62.10.1378/chest.97.1.582403901 [Google Scholar] [CrossRef] [PubMed]
[52]. Dubois AB, Fowler RC, Soffer A, Fenn WO, Alveolar CO2 measured by expiration into the rapid infrared gas analyzerJ Appl Physiol 1952 4(7):526-34.10.1152/jappl.1952.4.7.52614907568 [Google Scholar] [CrossRef] [PubMed]
[53]. Girshin M, Mendonca R, End-tidal CO2 monitoring tube holderUnited States patent US 8,348,854 2010 [Google Scholar]
[54]. Carlson LR, McClatchie EA, Martinosky J, Walden R, Causevic E, Breath end-tidal gas monitorUnited States patent US 8,021,308 2011 [Google Scholar]
[55]. Yang J, An K, Wang B, Wang L, New mainstream double-end carbon dioxide capnograph for human respirationJ Biomed Opt 2010 15(6):06500710.1117/1.352362021198171 [Google Scholar] [CrossRef] [PubMed]
[56]. Fezari M, Rasras R, El Emary IM, Ambulatory health monitoring system using wireless sensors nodeProc Computer Science 2015 65:86-94.10.1016/j.procs.2015.09.082 [Google Scholar] [CrossRef]
[57]. Stankus M, Penhaker M, Cerny M, Low cost data acquisition system for biomedical usagenXII Mediterranean Conference on Medical and Biological Engineering and Computing 2010 2010:883-88.0.1007/978-3-642-13039-7_223 [Google Scholar] [CrossRef]
[58]. da Silva Pinto MA, de Souza JK, Baron J, Tierra-Criollo CJ, A low-cost, portable, micro-controlled device for multi-channel LED visual stimulationJ Neurosci Methods 2011 197(1):82-91.10.1016/j.jneumeth.2011.02.004 [Google Scholar] [CrossRef]
[59]. Arduino. “Arduino Mega 2560”. Available from: arduino.cc/en/Main/arduinoBoardMega2560.http://arduino.cc/en/uploads/Main/arduinomega2560_R3-schematic.pdf. [Accessed 15 November 2016] [Google Scholar]
[60]. Shabry NA, Singh OP, Sardana P, binti Hisham R, Malarvili MB, Home based fetal heart rate monitorIJAER 2017 12(6):813-17. [Google Scholar]
[61]. Teikari P, Najjar RP, Malkki H, Knoblauch K, Dumortier D, Gronfier C, An inexpensive Arduino-based LED stimulator system for vision researchJ Neurosci Methods 2012 211(2):227-36.10.1016/j.jneumeth.2012.09.01223000405 [Google Scholar] [CrossRef] [PubMed]
[62]. Kato Y, Splish: A visual programming environment for arduino to accelerate physical computing experiences. In creating connecting and collaborating through computing (C5)2010 Eighth International Conference2010:3-10.10.1109/C5.2010.2019734089 [Google Scholar] [CrossRef] [PubMed]
[63]. Lady ada, “Adafruit 3.5” 320×480 Color TFT Touchscreen Breakout”Available from: https://cdn-learn.adafruit.com/downloads/pdf/adafruit-3-5-color-320×480-tft-touchscreen-breakout.pdf.pp.(1-45). [Accessed 15 November 20165] [Google Scholar]
[64]. McCurdy MR, Bakhirkin YA, Wysocki G, Tittel FK, Performance of an exhaled nitric oxide and carbon dioxide sensor using quantum cascade laser-based integrated cavity output spectroscopyJ Biomed Opt 2007 12(3):03403410.1117/1.274760817614742 [Google Scholar] [CrossRef] [PubMed]
[65]. Singh OP, Mekonnen D, Malarvili MB, Labview based ECG patient monitoring system for cardiovascular patient using SMTP technologyJournal of Medical Engineering 2015 2015:70152010.1155/2015/70152027006940 [Google Scholar] [CrossRef] [PubMed]
[66]. Betancourt JP, Tangel ML, Yan F, Otaño M, Portela AE, Dong FY, Hirota K, Capnogram Feature Extraction Based on Wavelet Decomposition by Segments for Classification of Asthma SeverityThe international workshop on advanced computational intelligence and intelligent informatics 2013 [Google Scholar]