Depression is one of the most common psychiatric morbidity among the older population [5,6]. Several studies from India have demonstrated the prevalence rates of depression in elderly ranging from 22 to 53% with an average of 39% [2,5-7]. Children/family members’ negligence, feeling isolated, a low status in the family and a sense of insecurity, living alone, increased physical dependency, loss of the partner, poor quality of life, poor interpersonal relationship, poverty and physical ill health were the possible reasons for the high prevalence of depression in older people [5,8-12]. The older people are more likely to experience a varied kind of morbidity, including cognitive impairment, causing functional impairment, and eventually disability [13-16].
Disability of the aged people is an important public health concern that causes impairment to function independently. Self-care activities such as bathing, dressing, transferring from a bed to a chair, using the toilet, eating, climbing up staircase, performing shopping and taking medication are commonly referred to as Activities of Daily Living (ADL’s) and are associated with depression [15,17-20].
Older people are often at risk for loneliness because of decreased social relationship and it is an important concern relating to their quality of life and well-being. Several studies identified the high rates of reported loneliness, factors contributing to this and its relationship with depression [21-23].
Community studies from India on depression, perceived loneliness and functional impairment are sparse. In the light of the above considerations, this study was intended to identify depression, perceived loneliness and functional impairment among elderly in a rural community, in order to assess their health needs and functional abilities, which will be useful to plan health and other supportive services for the elderly.
Materials and Methods
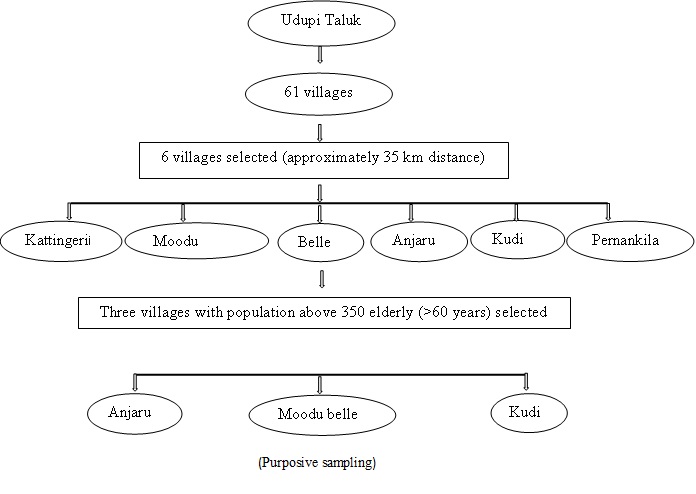
The present Study was conducted from January 2015 to February 2015 (The time period of the study was for 2 months) which consists of 61 villages, out of which 6 villages were selected randomly. Among 6 villages, three villages (namely, Anjaru, Moodubelle and Kudi) were selected based on the size of the population aged 60 years and above i.e., a village with more than 350 elderly people [Table/Fig-1]. People aged 60 years and above, who consented to participate in the study were included. People with dementia or memory problem, disoriented or with mental illness were excluded from the study. Sample size was calculated based on estimation of proportion after the pilot study.
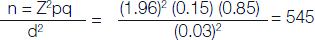
n = total sample size 600
p = anticipated proportion = 0.15
d = related precision= 0.03
q = approximate proportion = 0.8
According to this, total of 545 subjects were required and study recruited 600 subjects using purposive sampling technique. The study was approved by the institutional ethics committee. Permission was taken from the respective Presidents of selected villages. An informed written consent was obtained from the study participants. The pilot study was conducted among 100 elderly people and the study was found to be feasible.
Measures: A structurally designed demographic proforma was developed by the investigators to collect the background information of the subjects, pretested and finalized with appropriate modifications (Demographic proforma is described in the [Table/Fig-2] under the heading of sample characteristics). The following tools were used in the study:
Frequency and percentage distribution of sample based on the socio-demographic variables.
| Sample characteristics | Frequency (f) | Percentage (%) |
|---|
| Age (in years) |
| 60-70 | 394 | 65.7 |
| 71-80 | 150 | 25 |
| 81-90 | 48 | 8.0 |
| >90 | 8 | 1.3 |
| Gender |
| Male | 253 | 42.2 |
| Female | 347 | 57.8 |
| Marital status |
| Single | 9 | 1.5 |
| Married | 434 | 72.3 |
| Widow | 155 | 25.8 |
| Widower | 2 | 0.3 |
| Educational Status |
| Post graduate | 6 | 1.0 |
| Graduate | 9 | 1.5 |
| *PUC | 22 | 3.7 |
| *SSLC | 49 | 8.2 |
| Primary | 234 | 39 |
| Illiterate | 280 | 46.6 |
| Past occupation |
| Employed | 353 | 58.8 |
| Not employed | 247 | 41.1 |
| Present occupation |
| Employed | 66 | 11.0 |
| Retired | 534 | 89.0 |
| Family income (in Rupees) |
| <5000 | 102 | 17 |
| 5001-10000 | 257 | 42.8 |
| 10001-15000 | 188 | 31.3 |
| 15001-20000 | 40 | 6.7 |
| 20001 and above | 13 | 2.2 |
| Source of income |
| Salary/Pension | 66 | 11 |
| Children living at home/outside | 519 | 86.5 |
| Other family members | 15 | 2.5 |
| Living with whom |
| Living with spouse | 49 | 8.2 |
| Living with spouse & children | 357 | 59.5 |
| Living with children | 165 | 27.5 |
| Living alone | 11 | 1.8 |
| Health problems |
| Yes | 247 | 41.2 |
| No | 349 | 58.8 |
| Recreational activities |
| Yes | 20 | 3.4 |
| No | 580 | 96.6 |
*PUC- Pre University College (12th standard); *SSLC– Secondary School (10th standard)
Geriatric Depression Scale (short version): Geriatric Depression Scale is a widely used, standardized self-report instrument for measuring depression in elderly constructed by Yesavage JA et al., in 1983 and it is freely usable for research [24]. The scale was found to have a sensitivity of 92% and specificity of 89% when assessed against diagnostic criteria, with a high correlation (r=0.84, p-value <0.001). The validity and the reliability of the tool have been supported both in the clinical practice and in research. The shorter version of the scale consists of 15 questions and each negative answer will carry a mark and thus the more the scoring is, the more the chances of having depression. The maximum score that one can get is 15, which indicates a severe depression. The cut-off for normal range was 10.
The revised UCLA (University of California, Los Angeles) Loneliness Scale: It is a standardized tool measuring subjective loneliness and social isolation of the individual, developed by Russel and Daniel. The original tool had 20 positively worded items whereas the Revised UCLA Loneliness Scale included 10 negatively worded and 10 positively worded items that are scored on a four-point scale (often=3, sometimes=2, rarely=1 and never=0). The total scores ranges from 0 to 60; the higher the score, the higher the perceived loneliness of the individual. The researchers have obtained permission to use the scale for the current study. Analyses of the reliability, validity, and factor structure of this new version of the UCLA have shown high reliability, both in terms of internal consistency (coefficient a ranging from 0.89 to 0.96) and test-retest reliability over a one-year period (r =0 .73) [25].
Activities of Daily Living Scale for elderly: Activities of Daily Living Assessment Scale (ADL’S) was developed by the investigators after extensive review of literature to assess the partial functional impairment. The tool consisted of 21 items with following areas: self-care needs (getting in and out of bed/chair, brushing, bathing, grooming, using the toilet, climbing the steps, walking around the premises), instrumental activities of daily living (performing housework, shopping, taking decisions on problems, money management, gardening/watering the plants, going for morning/evening walk), and recreational activities (group participatory activities like clubs religious functions, going to the religious places, spiritual activities). Each item was scored on a 3 point scale. The score ranges from 21-63 and was classified as; dependent (1-21), partially dependent (22-42) and independent (43-63). The content validity of the tool was established, the reliability of the scale was found to be 0.88 by Cronbach’s alpha. Descriptive and inferential statistics such as frequency and percentage, Pearson’s correlation coefficient and Chi-square tests were used to analyse the data. Data was managed and analysed with the help of Statistical Package for Social Sciences (SPSS) version 16. All the hypotheses were tested at 0.05 level of significance.
Results
Sample Characteristics: The majority of elderly 394(65.7%) in the present study were in the youngest age group (60-70 years), and the number decreased with older age groups, with the least number in the oldest age group of >90 years 8(1.3%). Most of the participants 347(57.8%) were females and majority were married 434(72.3%). However, a substantial number among the married were widowed (male 3, 0.5%; female 155, 25.8%), 280(46.6%) of the study population had no formal education. Here 530 (88.8%) participants were currently not working. A total of 357(59.5%) elderly were staying along with their spouse and children, whereas 11(1.8%) of the participants were staying alone. A total of 247(41.2%) subjects were suffering from one or other health problems. Majority 580(96.6%) subjects were not engaged in any kind of recreational activities [Table/Fig-2].
Description of Depression, Partial Functional Impairment (Activities of Daily Living) and Perceived Loneliness: The overall prevalence of depression among the older people 60 years and above was found to be 241 (40.16%). 213(35.5%) participants with mild degree of depression, 23(3.8%) participants showed moderate and 5(0.8%) participants have demonstrated severe degree of depression [Table/Fig-3]. Mild degree of loneliness was perceived by 23(3.8%) elderly, 6(1%) older people perceived moderately high degree of loneliness and 571 subjects (95.2%) had never perceived loneliness [Table/Fig-4]. A total of 20(3.3%) study participants required minimum help and 1(0.2%) subject was completely dependent in their activities of daily living [Table/Fig-5].
Frequency percentage distribution of depression among people aged 60 years and above. n = 600
| Depression | Frequency (f) | Percentage (%) |
|---|
| Mild depression | 213 | 35.5 |
| Moderate depression | 23 | 3.83 |
| Severe depression | 05 | 0.83 |
| No depression | 359 | 59.83 |
Frequency percentage on loneliness among people aged 60 years and above.
| Loneliness | Frequency (f) | Percentage (%) |
|---|
| No loneliness | 571 | 95.2 |
| Low degree of loneliness | 23 | 3.8 |
| Moderately high degree of loneliness | 06 | 01 |
| No depression | 359 | 59.83 |
Frequency and percentage of Partial functional impairment of people aged 60 years and above. n = 600
| Partial functional impairment | Frequency (f) | Percentage (%) |
|---|
| Dependent | 01 | 0.2 |
| Minimum help required | 20 | 3.3 |
| Independent | 579 | 96.5 |
Correlation between Depression, Perceived Loneliness and Partial Functional Impairment: [Table/Fig-6] reveals that in the elderly persons, there was no significant relationship found between depression and partial functional impairment (r=0.028), depression and loneliness (r=0.289), but there was modest negative correlation between loneliness and partial functional impairment (r = -0.018).
Correlation between depression, perceived loneliness and partial functional impairment.
| Variables | r value | p-value |
|---|
| Depression & perceived loneliness | 0.289 | 1 |
| Perceived loneliness & Partial functional impairment | -0.018 | 0.0667 |
| Depression & Partial functional impairment | 0.028 | 1 |
p-value >0.05; The hypothesis was tested at 0.05 level of significance. Pearson’s correlation coefficient formula was used to calculate the correlation between depression, perceived loneliness and partial functional impairment.
Association between Depression, Perceived Loneliness, Partial Functional Impairment and Selected Demographic Variables: A significant association [Table/Fig-7] was found between depression and age (χ2=18.929, p=0.002), gender (χ2=14.710, p=0.002), family income (χ2=31.894, p=0.007), source of income (χ2=31.281, p=0.008), and living status (χ2=28.692, p=0.018). Association was found between perceived loneliness and marital status (χ2=41.511, p=0.016), education (χ2=42.164, p=0.009), family income (χ2=24.775, p=0.006), source of income (χ2=57.464, p=0.001) and living status (χ2=33.962, p=0.001) [Table/Fig-8]. A significant association [Table/Fig-9] was also found between partial functional impairment and age (χ2=33.336, p=0.001), heath problems (χ2=35.469, p=0.001) and recreational activities (χ2=37.280, p=0.001).
Association between depression and selected demographic variables. n=600
| Demographic characteristics | Normal | Mild | Moderate | Severe | Severe | df | p-value |
|---|
| Age (in years) |
| 60-70 | 258 | 118 | 14 | 4 | 18.929 | 9 | 0.002* |
| 71-80 | 71 | 72 | 6 | 1 |
| 81-90 | 26 | 19 | 3 | 0 |
| >90 | 4 | 4 | 0 | 0 |
| Gender |
| Male | 214 | 9 | 8 | 2 | 14.710 | 3 | 0.002* |
| Female | 205 | 144 | 15 | 3 |
| Marital status |
| Single | 4 | 5 | 2 | 0 | 26.658 | 6 | 0.026 |
| Married | 282 | 137 | 13 | 2 |
| Widow | 73 | 71 | 8 | 3 |
| Educational Status |
| SSLC and above | 74 | 34 | 5 | 0 | 27.960 | 6 | 0.063 |
| Primary | 140 | 61 | 9 | 4 |
| Illiterate | 145 | 118 | 9 | 1 |
| present occupation |
| yes | 50 | 15 | 2 | 1 | 7.464 | 3 | 0.280 |
| no | 309 | 198 | 21 | 4 |
| Family income (in Rupees) |
| <5000 | 58 | 33 | 11 | 2 | 31.894 | 9 | 0.007* |
| 5001-10000 | 170 | 84 | 2 | 2 |
| 10001-15000 | 107 | 70 | 8 | 1 |
| 15001 and above | 25 | 25 | 2 | 0 |
| Source of income |
| Children living at home | 269 | 150 | 14 | 1 | 31.281 | 6 | 0.008* |
| Children living outside | 41 | 37 | 2 | 4 |
| Pension and other | 49 | 26 | 7 | 0 |
| Living with whom |
| Living with spouse | 40 | 21 | 5 | 0 | 28.692 | 9 | 0.018* |
| Living with spouse & children | 229 | 116 | 10 | 2 |
| Living with children | 88 | 67 | 7 | 1 |
| Living alone | 2 | 7 | 1 | 4 |
| Health problems |
| Yes | 140 | 94 | 13 | 1 | 9.537 | 3 | 0.657 |
| No | 219 | 119 | 13 | 1 |
| Recreational activities |
| yes | 14 | 7 | 0 | 0 | 5.318 | 3 | 0.805 |
| no | 345 | 206 | 23 | 5 |
*significant at 0.05 level (p<0.05); Chi-square test was used to find the association between depression and selected demographic variables
Association between Loneliness and selected demographic variables. n=600
| Demographiccharacteristics | Normal | Low degreeloneliness | ModeratelyHigh degree | Chi- square | df | pvalue |
|---|
| Age (in years) |
| 60-70 | 370 | 17 | 4 | 3.275 | 6 | 0.774 |
| 71-80 | 142 | 6 | 2 |
| 81-90 | 48 | 3 | 0 |
| >90 | 8 | 0 | 0 |
| Gender |
| Male | 241 | 10 | 2 | 0.209 | 2 | 0.901 |
| male | 330 | 13 | 4 |
| Marital status |
| Single | 7 | 6 | 0 | | | |
| Married | 416 | 13 | 3 | 41.511 | 4 | 0.016* |
| Widow | 148 | 6 | 1 | | | |
| Educational Status SSLC and above |
| Primary | 100 | 9 | 4 | 42.164 | 4 | 0.009* |
| Illiterate | 209 | 5 | 0 | | | |
| present occupation |
| yes | 262 | 9 | 2 | 1.987 | 2 | 0.738 |
| no | 67 | 22 | 6 |
| Family income (in Rupees) |
| <5000 | 504 | 1 | 0 | 24.775 | 6 | 0.006* |
| 5001-10000 | 91 | 11 | 2 |
| 10001-15000 | 249 | 4 | 4 |
| 15001 and | 182 | 4 | 0 |
| above | 49 | 4 | 0 |
| Source of income |
| Children living at home | 425 | 9 | 3 | 57.464 | 4 | 0.001* |
| Children living outside | 78 | 4 | 0 |
| Pension and other | 68 | 10 | 3 |
| Living with whom |
| Living with spouse | 56 | 7 | 3 | | | |
| Living with spouse & children | 348 | 7 | 2 | 33.962 | 6 | 0.001* |
| Living with children | 158 | 7 | 1 | | | |
| Living alone | 9 | 2 | 0 | | | |
| Health problems |
| yes | 233 | 16 | 2 | 18.320 | 2 | 0.019 |
| no | 338 | 7 | 4 |
| Recreational activities |
| yes | 20 | 0 | 0 | 0.670 | 2 | 0.995 |
| no | 551 | 22 | 6 |
*significant at 0.05 level (p<0.05)
Chi-square test was used to find the association between loneliness and selected demographic variables
Association between partial functional impairment and selected demographic variables. n=600
| Demographiccharacteristics | Independent | Minimum help required | Dependent | Chi-square | df | pvalue |
|---|
| Age (in years) |
| 60-70 | 390 | 3 | 1 | 33.336 | 6 | 6 |
| 71-80 | 140 | 10 | 0 |
| 81-90 | 43 | 5 | 0 |
| >90 | 6 | 2 | 0 |
| Gender |
| Male | 246 | 8 | 0 | 0.846 | 2 | 2 |
| Female | 333 | 12 | 1 | | | |
| Marital status |
| Single | 11 | 0 | 0 | 9.424 | 4 | 4 |
| Married | 424 | 10 | 1 |
| Widow | 144 | 10 | 0 |
| Educational Status |
| SSLC and above | 111 | 2 | 0 | | | |
| Primary | 209 | 5 | 0 | 5.911 | 4 | 4 |
| Illiterate | 259 | 13 | 1 | | | |
| Present occupation |
| Yes | 68 | 0 | 0 | 0.862 | 2 | 2 |
| No | 511 | 20 | 1 | | | |
| Family income (in Rupees) |
| <5000 | 97 | 7 | 0 | 14.037 | 6 | 6 |
| 5001-10000 | 250 | 6 | 1 |
| 10001-15000 | 184 | 4 | 0 |
| 15001 and above | 49 | 4 | 0 |
| Health problems |
| Yes | 234 | 13 | 0 | 35.469 | 2 | 2 |
| No | 345 | 7 | 1 | 2 |
| Recreational activities |
| Yes | 20 | 0 | 0 | 37.280 | 2 | 2 |
| No | 560 | 20 | 0 | |
*significant at 0.05 level (p<0.05)
Chi-square test was used to find the association between partial functional impairment and selected demographic variables.
Discussion
The overall prevalence of depressive disorders among the elderly of 60 years and above was found to be 40.16%. The study findings were consistent with the observations made by Barua A et al., Swarnalatha N, and Sengupta P et al., who had determined the prevalence of depressive disorders in the elderly population to be 21.7%, 47%, and 8.9% respectively [2,11,26].
Mild degree of loneliness was perceived by (3.8%) elderly, and six (1%) older people perceived moderately high degree of loneliness in the present study. Study also revealed that there was no significant correlation between depression and loneliness, depression and partial functional impairment. The study findings are inconsistent with the observations made by Singh A et al., who had determined a significant relationship between depression and loneliness [23]. The findings throw light in to the fact that though the elderly feel depressed it is not related to their functional impairment, nor it reflects their perception of loneliness. Rather it is evident that the loneliness is very minimally perceived. This revelation can be better understood with the context of the study, as it was conducted in rural India, where majority of them are living with their kith and kins. A modest negative correlation between loneliness and partial functional impairment was observed in this study which is consistent with findings of a study by Swarnalatha N who reported a statistically significant association between depression and activities of daily living [11]. This indirectly shows that the elderly do not feel dejected and unattended, especially when their health is affected. In fact, it is relieving to understand that culturally still the elderly are considered integral part of the family in rural South India.
In the present study partial functional impairment was found among twenty (3.3%) study participants, in which one (0.2%) participant was totally dependent. The study also revealed an association between partial functional impairment and demographic variables. These findings support the reports of a study by Loh KY et al., who observed partial functional impairment among 35.5 percent subjects in which two (0.8%) subjects were totally dependent [15]. There was also a significant association found between functional impairment and selected demographic variables. A significant correlation (p=0.003) between functional impairment and depressive symptoms was reported by Hatfield JP et al., [17]. Hairi NN et al., presented significant associations between functional limitations, physical disabilities and depressive symptoms [27].
Limitation
Small sample size and use of purposive sampling technique can limit generalization of the study findings. The study was restricted to three villages of Udupi taluk and this could limit the generalization of the study. Further the self-construction of Activities of Daily Living assessment tool may contribute to minor errors to the findings.
Conclusion
People aged 60 years and above are likely to have depressive features irrespective of their locality and living arrangements which could be a major public health concern. Depression need not be stemming from the perception of loneliness and functional impairment among the elderly residing in rural areas of South Karnataka. This facilitates the health care professionals in early identification of depressive features for effective interventions and notifying to primary care provider and family members for the detailed management.
*PUC- Pre University College (12th standard); *SSLC– Secondary School (10th standard)
p-value >0.05; The hypothesis was tested at 0.05 level of significance. Pearson’s correlation coefficient formula was used to calculate the correlation between depression, perceived loneliness and partial functional impairment.
*significant at 0.05 level (p<0.05); Chi-square test was used to find the association between depression and selected demographic variables
*significant at 0.05 level (p<0.05)
Chi-square test was used to find the association between loneliness and selected demographic variables
*significant at 0.05 level (p<0.05)
Chi-square test was used to find the association between partial functional impairment and selected demographic variables.