Rheumatic heart disease is a post infection autoimmune disease. Mitral valve is affected most commonly followed by aortic valve. Patients with rheumatic heart disease require surgical interventions mainly to prevent from heart failure, pulmonary arterial hypertension and atrial fibrillation [1,2].
Occurrence of thromboembolic events are increased in patients with mechanical valves therefore these patients should be treated with oral anti-coagulant of vitamin K antagonists. Acenocoumarol is an oral anticoagulant which is widely used in Europe and South America [3,4].
It is difficult to predict daily maintained dose of acenocoumarol which range from 1 mg to 56 mg (because acenocoumarol shows interindividual variation). This wide variation in dose requirement is influenced by pharmacokinetic and pharamacodynamic aspects which in turn determined by genetic and environment factors [5]. Because of large inter individual variation and response to acenocoumarol, this demands repeated and frequent monitoring of INR [5].
The oral anticoagulants have adverse effects which are complications due to bleeding even when INR values are within the therapeutic range [6]. A meta-analysis was done for warfarin, acenocoumarol and phenprocoumon, showed that therapeutic drug monitoring of oral anticoagulants will ensures an optimal net benefit for the patients. Therapeutic drug monitoring is essential to first estimate the drug level in plasma and then according to the plasma concentration of acenocoumarol, dose can be adjusted depending on individual patients [7].
The present study aimed to ompare INR with plasma concentration acenocoumarol at trough and Cmax levels of acenocoumarol in blood for optimal dosage to prevent sub-therapeutic/supra-therapeutic drug therapy leading to life-threatening complications in patients with mechanical heart valve replacement of patients.
The present study aimed to find out the trough and peak levels of acenocoumarol in the blood of patients with normal INR (2.5-3.5) and patients with extremes of INR (1.5-2.5 and 3.5-4.5) and to compare the association between INR of three groups (low, normal and high) and their respective plasma concentration of acenocoumarol taken at trough and Cmax concentration.
Materials and Methods
The present study is an observational simple randomised study. The patients included in this study were from Outpatient Department of Cardiothoracic, PSG Institute of Medical Science and Research, Coimbatore, Tamil Nadu, India. The study was initiated in February 2015 and completed by June 2016. The study as initiated only after getting the approval from Institutional Human Ethics Committee. The participants who were willing to give the written informed consent were only included in the study.
Inclusion criteria: Patients who have undergone mechanical heart value replacement taking acenocoumarol 2 mg and were on once daily dose were included in the present study [8]. Patients with INR between 1.5 to 4.5 were included in this study [9]. Since, the present study was a pilot study, 56 patients were included for the present study [9]. Patients only with normal liver function with vitamin K convalescent period were included in the present study.
Exclusion criteria: Patients with known diseases which can lead to coagulation disturbance {i.e., Haemophilia Factor 5 Leiden mutation, Protein C deficiency, Protein S deficiency, von willebrand’s disease (vwd), cirrhosis, Shock, Sepsis, Malignancy, Renal disease, Prolonged steroid use, anti-phospholipid antibody syndrome (aplas), systemic lupus erythematosus (sle)} were excluded from the study. Patients on drugs which were well known to produce interactions with acenocoumarol (allopurinol, amiodarone, azathioprine, betamethasone, carbamazepine, cefoxitin, cholestyramine, cimetidine, dexmethasone, doxycycline, eryth-romycin, fenofibrate, fluvostatin, Gingko biloba, ibuprofen, ketoconazole, lovastatin, orlistat, quinine, zafirlukast) were excluded from the study.
Sample size: The present study was a pilot study. The sample estimated was 60. However, for this study we were able to recruit only 56 patients.
Number of groups: First group (Normal range)-patients who have undergone valve replacement surgery and INR 2.5-3.5 (30 participants). Second group (Low INR)-patients who have undergone valve replacement surgery and have INR 1.5-2.5 (15 participants). Third group (High INR)-patients who have undergone valve replacement surgery and have INR 3.5-4.5 (11 participants).
Timing of the blood sample collected for analysing: An amount of 2 mL of blood collected from the patients at the trough (just before taking drug) and Cmax levels (two hours after taking drug) [10]. The blood was withdrawn from the elbow and was collected in EDTA tube. The first blood sample was collected just before the patient had the tablet (trough concentration). The next sample was collected two hours after the patient have taken the tablet (Cmax). Acenocoumarol concentration was estimated in the plasma by chromatography technique [11,12].
Statistical Analysis
The collected data were entered into SPSS version 19.0 for statistical analysis. Pearson’s correlation was done to see the association between INR of three groups (low, normal and high) and their respective plasma concentration of acenocoumarol taken at trough and Cmax. Unpaired t-test was done to see relation between trough plasma concentration of patients with low and high INR with trough concentration of patients with normal INR. Similarly, unpaired t-test was done to see relation between Cmax plasma concentration of patients with low and high INR with Cmax concentration of patients with normal INR. One-way Analysis Of Variance (ANOVA) was used to compare only the trough plasma concentration of acenocoumarol of patients with INR 1.5-4.5 (all the three groups). Similarly, one-way ANOVA was used to compare only the Cmax plasma concentration of acenocoumarol of patients with INR 1.5-4.5 (all the three groups). A p-value of <0.05 was considered statistically significant high performance liquid.
Results
A total of 56 Participants were recruited. 30 patients were recruited in the INR normal range arm with 2.5-3.5. 15 patients were recruited with INR of 1.5-2.5 and 11 patients were recruited with INR of 3.5-4.5.
Analysing the distribution of male and female among valve replaced participants: Out of the 56 participants, there was equal number of male and female participants (50% in each group-28 in each group).
Estimating the distribution of the total participants based on age: In the study, there were more number of participants in the age group of 40-60 years which was around 39 (70%). In the age group of 20-40 years the percentage of participants present were 23% which was 13 in number. Above 60 years of age there were about 5% of participants which was around three in number, while below 20 years there were only 2% of participants i.e., only one patient.
Comparing the association between plasma trough concentrations of acenocoumarol (in ng/mL) in participants with INR 1.5 to 2.5: Association between the trough concentration and INR 1.5 to 2.5 was compared. The highest trough concentration of 29 ng/mL was in participant with INR 1.87 while, the lowest trough concentration of 13 ng/mL was seen in participant with INR 1.78.
Analysing the association between plasma Cmax concentrations of acenocoumarol (in ng/mL) in participants with INR 1.5 to 2.5: Association between Cmax plasma concentration and INR 1.5-2.5 was analysed. Lowest Cmax concentration was found to be 32 ng/mL in participants with INR 1.88 and the maximum Cmax concentration of 88 ng/mL was seen in participants with INR 2.1.
Estimating the association between plasma trough concentrations of acenocoumarol (in ng/mL) in participants with INR 2.5 to 3.5: The association between trough concentration and INR 2.5-3.5 was analysed. The highest trough concentration of 22 ng/mL was seen in participants with INR 2.82. While the lowest trough concentration was seen in patient with INR 2.6 and concentration was 10 ng/mL.
Comparing the association between plasma Cmax concentrations of acenocoumarol (in ng/mL) in participants with INR 2.5 to 3.5: Association between plasma Cmax concentrations of acenocumarol in participants with INR 2.5-3.5 was analysed. The maximum Cmax concentration was 120 ng/mL while corresponding INR was 2.59. While the participant with INR 3.27 had the lowest concentration of 28 ng/mL.
Estimating the association between plasma trough concentrations of acenocoumarol (in ng/mL) in participants with INR 3.5 to 4.5: The association between plasma trough level plasma concentration of acenocoumarol and INR 3.5-4.5 was analysed. The participant with INR 4.08 had maximum trough concentration of 19 ng/mL, while a participant with INR 4.34 had the lowest trough concentration of 10 ng/mL.
Analysing the association between plasma Cmax concentrations of acenocoumarol (in ng/mL) in participants with INR 3.5 to 4.5: The association between INR and Cmax plasma concentration of acenocoumarol in participants with INR 3.5-4.5 was analysed. The lowest Cmax concentration of 45 ng/mL was noted with INR 4.25, while the highest Cmax concentration of 92 ng/mL was noted with INR 4.08.
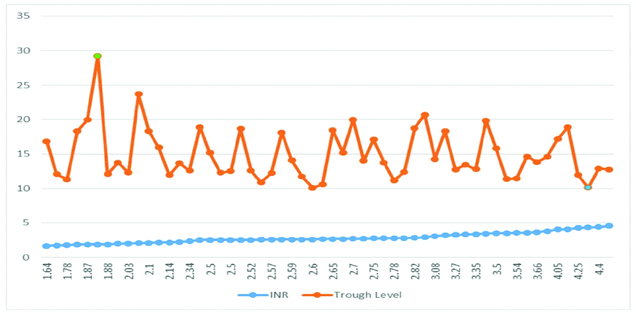
The association between INR and trough level plasma concentration of acenocoumarol in participants with INR 1.5-4.5 (all the three groups) was analysed. The highest trough concentration of 29 ng/mL was found in a patient with INR 1.88. The lowest trough concentration of 10 ng/mL was in a participant with patients with INR 2.6 and INR 4.3 is shown in the above graph [Table/Fig-1].
Association between plasma trough concentrations of acenocoumarol (in ng/ml) in participants with INR 1.5 to 4.5.
The association between INR and trough level plasma concentration of acenocoumarol in participants with INR 1.5-4.5 (all the three groups) was analysed. The highest trough concentration of 29 ng/mL was found in a patient with INR 1.88. The lowest trough concentration of 10 ng/mL was in a participant with INR 2.6. INR 4.34 is shown in the above [Table /Fig-2].
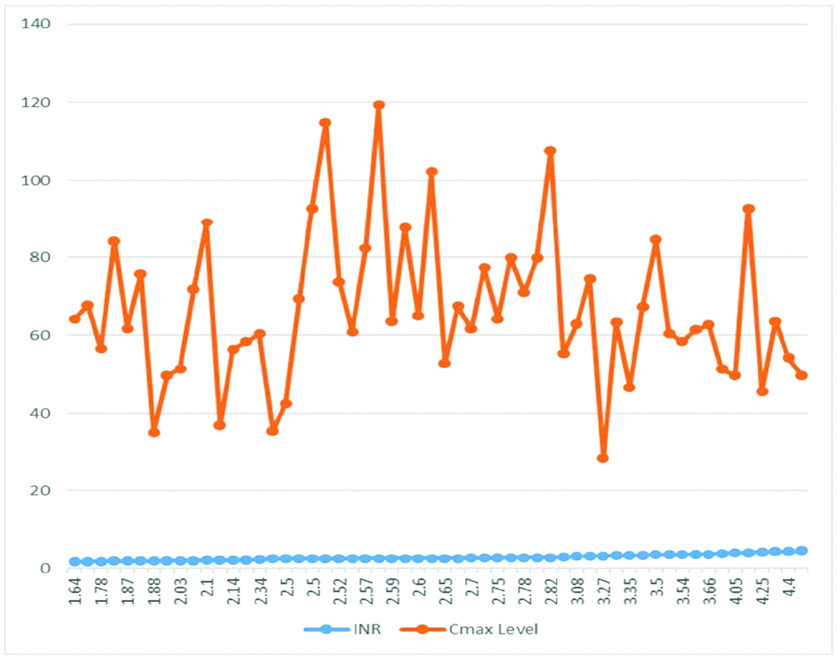
Association between plasma Cmax concentrations of acenocoumarol (in ng/ml) in participants with INR 1.5 to 4.5.
Association between of INR and Cmax level plasma concentration of acenocoumarol in participants with INR-4.5 (all the three groups) showed that participant with INR 2.59 had a Cmax concentration of 120 ng/mL which was the highest. However, a participant with INR 3.27 had 28 ng/mL of Cmax concentration which was found to be the lowest.
Only the mean trough concentration of all the three groups (1.5-2.5, 2.5-3.5 and 3.5-4.5) was compared and there was no significant difference between all the three groups. The mean Cmax plasma concentration of all the groups of participants with INR 1.5-2.5, 2.5-3.5 and 3.5-4.5 was compared and all the three groups was found to be similar as the p-value=0.254 [Table/Fig-3].
Mean trough and Cmax concentrations of all three groups.
| Plasma Concentration | with INR | with INR | with INR |
|---|
| 1.5-2.5 | 2.5-3.5 | 3.5-4.5 |
|---|
| Mean Trough Concentration of Acenocoumarol in ng/mL | 16.14 | 18.79 | 17.19 |
| Mean Cmax Concentration of Acenocoumarol in ng/mL | 56.3 | 59.1 | 57.3 |
Correlation between INR of all the three groups and their respective plasma concentration taken at trough and Cmax by Pearson’s correlation (p=0.187); The plasma concentration of acenocoumarol taken at trough and Cmax of all the three groups of participants was compared using one way analysis of variance (ANOVA) (p=0.164)
Discussion
Acenocoumarol is the most frequently used oral anticoagulant in valve replaced participants. This drug has a narrow therapeutic index. The most important and serious adverse effect of this drug is profuse bleeding which is life threating. To prevent this complication repeated and frequent estimation of INR is done. There are previous studies which confirm the variation of INR according to the laboratory tested. Studies also prove the inverse relation between INR and dose of the anticoagulant. There are studies which compared the relation between INR and plasma concentration of warfarin. These studies were done in Europe, China and India [13-15]. All these studies confirm that there is no association between INR and plasma concentration of warfarin. The present study is one of the first studies to prove that there is no correlation between INR and plasma concentration of acenocoumarol.
There were equal number of male (50%) and female (50%) participants in the present study. In another study done in Indonesia participants with Rheumatic heart disease, males were more and accounted for 95.2% while female were 4.8% [16].
In this study, maximum number of participants was in age group 40-60 (70%). In the age group of 20-40 years, the percentage of participants was 23%. Above 60 years of age there were only 5% of participants. While below 20 years, there were only 2% of participants. There is a study done in Australia which reveals maximum number of participants with rheumatic heart disease between 50.9-71.4. In this study, maximum number of participants was in the in age group of 40-60 years [17].
The INR (low, normal, high) of each group was compared with their respective trough plasma concentration. Each comparison revealed that there was no significant correlation between INR and the respective trough concentrations. (p>0.05) [Table/Fig-1].
Similarly, comparison of total INR (1.5-4.5) with trough concentration also showed that there was no significant correlation between INR and the trough concentrations of acenocoumarol. (p=0.152) [Table/Fig-1].
The INR (low, normal, high) of each was compared with their respective Cmax plasma concentration. Each comparison revealed that there is no significant correlation between INR and the respective trough concentrations. (p>0.05).
Similarly, comparison of total INR (1.5-4.5) with Cmax concentration plasma concentration of acenocoumarol also showed that there was no correlation between INR and the Cmax concentrations of acenocoumarol. (p=0.254) [Table/Fig-2].
Similar to present study there are studies showing the poor correlation between INR and plasma warfarin concentration. They have found that there is no association between INR and plasma concentration of warfarin [13-15,18]. They have discussed that concomitant medication diet variations, seasonal changes and age are the factors which makes INR poorly dependent on plasma warfarin concentration [13].
From these observations, it shows that there is no need to alter the dose of acenocoumarol based on INR alone because the concentration is similar.
Another study done in Ethiopia, also explained that there was less association between plasma warfarin concentration and INR. They explained that numerous factors and inter-individual differences such as interaction with other drugs, resistance, diet, differing drug metabolisms, vitamin K status, and other factors are the reasons for low association [18].
A study done in China also proved the poor correlation between INR and plasma concentration of warfarin [13].
A study done in Southern India had concluded that participants with INR 2-3.5 had no correlation between INR and plasma warfarin concentration. They have also said that warfarin has inter-individual variation which makes the dosing problematic. Because of their inter-individual variation some participants are sensitive to warfarin, and will require low dose of warfarin. Those participants who are resistant to Warfarin, therefore they will require a higher dose [15]. Warfarin plasma concentration measurement may be helpful in managing participants with fluctuant INR and to treat the same participants with the appropriate dose which prevent life threatening adverse effects [13-15,18].
All the above studies have the same conclusion as the present study, which strengthens the concept that INR measurement alone would be only of limited value for dose-adjustment in participants with complicated situations. There is a need for monitoring of plasma concentration before dose adjustment Mean trough plasma concentration of acenocoumarol of low and high INR group with the mean trough concentration of participants with normal INR were compared. There was no significant difference between trough concentrations of different groups it was all most similar as the p-value=0.452 [Table/Fig-3]. Mean Cmax concentration of low and high INR group with the mean Cmax concentration of participants with normal INR were compared. There was no significant difference between the comparisons showed it was similar as the p-value=0.465 [Table/Fig-3].
Comparison of the plasma trough concentration of all three different group of INR (low, normal and high) was done. Even though these participants belong to various group of INR the trough level was almost similar. The participants with INR 1.5-2.5, 2.5-3.5 and 3.5-4.5, had trough level as 16.14 ng/mL; 18.79 ng/mL; 17.19 ng/mL respectively. The plasma trough concentration of all the three groups was similar as the p-value=0.152 [Table /Fig-3].
Participants with INR ranging between 1.5-2.5, 2.5-3.5 and 3.5-4.5 had Cmax level as 56.3 ng/mL, 59.1 ng/mL, 57.3 ng/mL respectively. The mean Cmax of all the three groups with different INR did not show any variation, they were almost similar. The plasma mean Cmax concentration of all the three groups is similar as the p-value=0.254 [Table/Fig-3].
Vitamin K antagonists are effective oral anticoagulants drug in preventing and treatment of thromboembolic disease. These drugs have a narrow therapeutic range and shows inter and intra individual variability in dose requirement which is largely determined by both environmental and genetic factors. With the use of oral anticoagulant, the dose response relationships are unpredictable.
So, it is difficult to predict maintenance dose for acenocoumarol which varies from 1 mg to 56 mg [19]. The large variation in dose requirement is influenced mainly by pharmacokinetic and pharmacodynamics features [5]. In routine practice the dose adjustment for acenocoumarol is done by INR monitoring with acenocoumarol. However, studies carried out in four different zones in the world have concluded that there is poor correlation between INR and plasma warfarin concentration [13-15,18].
In the present study, we have found a similar finding for acenocoumarol. We have found that there is no correlation between INR of three groups and plasma concentration of acenocoumarol (Trough and Cmax).
So, the measurement of acenocoumorol in plasma will be more accurate, precise and reliable method for the dose adjustment in patients compared to INR.
Limitation
Only 56 participants were included in the present study. Since, the sample size was small and with this small sample size we can’t come to a definite conclusion. Therefore, further studies are needed with larger sample size.
Conclusion
The present study proved that there was no correlation between INR and plasma concentration of acenocoumarol taken at trough and Cmax level for all the three groups. Therefore, we can conclude that measuring INR alone will have limited value for dose adjustment of acenocoumarol. Therefore, estimation of plasma concentration of acenocoumarol will be ideal and appropriate for the dose adjustment of acenocoumarol. However, the findings of this study have to be further confirmed with larger sample size for extremes of INR.
Correlation between INR of all the three groups and their respective plasma concentration taken at trough and Cmax by Pearson’s correlation (p=0.187); The plasma concentration of acenocoumarol taken at trough and Cmax of all the three groups of participants was compared using one way analysis of variance (ANOVA) (p=0.164)