Job satisfaction of personnel narrates the performance of an organisation being related to efficacy and efficiency of the personnel working therein. Studies have shown job satisfaction to be dependent on the leader’s behaviour [1-3]. Lower levels of job satisfaction is a reflection of organisational factors like inappropriate leader behaviour, ill defined job profile and improper work environment [2,3]. Conduct of the leader affects the turnover ratio, psychological stress/distress of the employees and their performance [4].
Recognition by leader for achievements, contribution to the prosperity of the organisation, augments the job satisfaction of employees. Transformational leaders encourage followers to attain more responsibility and autonomy; endowing the followers with increased level of satisfaction of accomplishment [5]. It has been claimed that employees’ job satisfaction declines after they have worked for an organisation for about six months as a result of lack in recognition by the managers [6]. Supportive and creative environment has been valued and recognized to enhance job satisfaction, retention and excellence [7,8].
In a study conducted in Norwegian public social services; being valued, receiving praise and positive feedback, were considered to be important aspects of job satisfaction [9]. Integrity of the reporting head enhances the job satisfaction and reduces stress levels of employees [10], while the reverse happens with hostile and latitude behaviour of leaders [11]. Research has shown that different aspects of a leader’s behaviour have a dissimilar impact on employees of various professional groups [12]. Hierarchy in the organisations, work profile of employees may require leaders to meticulously select particular behavioural aspects and practice them differently for each segment [12]. Studies in the past have focused on stylistic behaviour of leaders; even though it may not be feasible for leader’s to change their style as a whole, yet leaders can focus to develop particular aspects of their behaviour.
Majority of the studies assessing the impact of leader’s behaviour on personnel are mostly from non-healthcare organisations [2-6]. Limited studies [7,8,13,14] that have been done in healthcare organisation focus on particular category of employees of organisations. Further very limited work has been done in public non-profit healthcare organisations.
Materials and Methods
For the purpose of study a non-profit medical college, in Punjab was selected. This institute started operating more than 30 years ago and has more than 30000 admissions per year with an average OPD of more than 1600 patients per days having 740 plus beds and being manned by 950 plus personnel including 282 nurses, 275 doctors, 96 non-medicos, 143 paramedics and 240 plus unskilled staff. Permission was taken from the head of the institute for the conduct of the study and the research proposal was cleared by doctoral committee vide approval no DCC/190.09 dated 9 May 2015.
Study instrument: It consisted of three parts namely: demographic profile (age, gender and duration of service) of the respondents, assessment of perceived leader’s behaviour and job satisfaction. Validated instruments like Leader Behaviour Description Questionnaire (LBDQ) Form XII by Stodgil RM (1963) and Job Satisfaction Survey (JSS) by Spector PE (1994) were used after taking due permission from the respective authors [15,16]. JSS assesses nine facets of job satisfaction namely Pay, Supervision, Promotion, Contingent rewards (performance based rewards), Fringe Benefits, Co-workers, Operating procedures (required rules and procedures), communication and nature of work. Each facet was assessed by four questions, thus the scale on JSS included 36 questions.
Twelve aspects of perceived leader’s behaviour [Table/Fig-1] as per LBDQ are Integration, Representation, Tolerance and Freedom, Predictive Accuracy, Demand Reconciliation, Production Emphasis, Tolerance of Uncertainty, Consideration Persuasiveness, Role Assumption, Initiation of Structure and Superior Orientation. Each aspect was assessed by five to ten questions and the LBDQ included 100 questions. Internal consistency of the scale was checked and found to be adequate with Cronbach’s alpha (0.948) for LBDQ and 0.95 for JSS which testified the strong reliability of the scale. Consent was obtained from the respective authors for use of the above questionnaire.
Leader’s behavioural aspects and their description.
| S.No | Behavioural aspect | Definition |
|---|
| 1 | Representation | speaks and acts as the representative of the group |
| 2 | Demand Reconciliation | reconciles conflicting demands and reduces disorder to system |
| 3 | Tolerance of Uncertainty | is able to tolerate uncertainty and postponement without anxiety or upset |
| 4 | Persuasiveness | uses persuasion and argument effectively; exhibits strong convictions |
| 5 | Initiation of Structure | clearly defines own role, and lets followers know what is expected |
| 6 | Tolerance and Freedom | allows followers scope for initiative, decision and action |
| 7 | Role Assumption | actively exercises the leadership role rather that surrendering leadership to others |
| 8 | Consideration | regards the comfort, well being, status, and contributions of followers |
| 9 | Production Emphasis | applies pressure for productive output |
| 10 | Predictive Accuracy | exhibits foresight and ability to predict outcome accurately |
| 11 | Integration | maintains a closely knit organization; resolves inter-member conflicts |
| 12 | Superior Orientation | maintains cordial relations with superiors; has influence with them; is striving for higher status |
Sample size and sampling: For the purpose of this study all nurses, doctors, non-medicos and paramedics (thus all skilled employees) were selected and a cross sectional study was performed. Unskilled staffs (e.g., housekeeping and general duty helpers) were excluded from the study considering their ability to understand the defined tool. List of all employees was obtained from the institute and all the eligible 796 personnel were contacted and questionnaire was distributed. They were met individually or in small groups; at each meeting objectives of the study were explained and confidentially of responses was ensured.
Statistical Analysis
Each of the leader behaviour aspect was tested using 5 to 10 questions on a 5 point Likert scale with always practiced at score 1 to never practiced at score 5. Each of the job satisfaction facet was tested using 4 questions on a 6 point Likert based scale ranging from highest agreement at score 6 to non-agreement at score 1. Negatively worded items were reverse scored using spread sheet. Further assessment was done applying correlation (Pearson’s) and Regression analysis using statistical (SPSS v.20) package. The results were than discussed with the top management to understand the possible reasons for observed variation.
Results
Distribution of Respondents: A total of 621 (78%) respondents completed their questionnaire. The sex ratio of respondents was in favour of females (66:34); 29% of the employees were contractual staff and rest were regular employees. Study group respondents included 243(39%) nurses, 207(33%) doctors, 72(12%) non-medicos and 99(16%) paramedics [Table/Fig-2,3].
Demographic split of study group.
| ‘Gender’ distribution of respondent employees |
|---|
| Male | Female | Total |
|---|
| Non Medico | 38 | 34 | 72 |
| Doctor | 88 | 119 | 207 |
| Nurse | 20 | 223 | 243 |
| Para Medic | 67 | 32 | 99 |
| Total | 213 | 408 | 621 |
Duration of service in the current institute of regular and contractual employee study group.
| Distribution of respondent employees based on duration of service |
|---|
| Duration of service | Contractual | Regular | Total |
|---|
| ≤ 2 yrs | 64 | 120 | 184 |
| 2-4 yrs | 61 | 82 | 143 |
| > 4 yrs | 87 | 203 | 290 |
| No Response | 1 | 3 | 4 |
| Total | 213 | 408 | 621 |
| Distribution of respondent employees based on their age |
| Age | Contractual | Regular | Total |
| ≤35 yrs | 126 | 294 | 420 |
| 35-45 yrs | 44 | 67 | 111 |
| 45-55 yrs | 18 | 34 | 52 |
| > 55 yrs | 25 | 13 | 38 |
| Total | 213 | 408 | 621 |
There was no significant difference in perception on jobs satisfaction levels with respect to duration of service of employees (p=0.771) and age of employees (p=0.565) between various categories of employees.
Overall demand reconciliation behaviour had maximum correlation [Table/Fig-4] with total of job satisfaction (r=.212, p<0.01) and initiation of structure behaviour had least correlation with total of job satisfaction (r=0.096, p<0.05). While assessing for leader behaviour aspects and individual job satisfaction facets [Table/Fig-4], persuasive behaviour of leader was found to have maximum association with supervision facet of job satisfaction (r=0.341, p<0.01). Further all the aspects of perceived leader’s behaviour had maximum correlation with job satisfaction facet ‘supervision’ and least correlation with job satisfaction facet ‘pay’.
Correlation between leader behaviour and job satisfaction for all employees as a whole.
| Job Satisfaction →Leader Behaviour ↓ | Pay | Promotion | Supervision | Fringe Benefits | Contingent Rewards | Operating Conditions | Co-Workers | Nature of Work | Communication | Total of Job Satisfaction |
|---|
| Representation | 0.032 | 0.131** | 0.231** | 0.121** | 0.188** | 0.130** | 0.111** | 0.068 | 0.156** | 0.121** |
| Demand Reconciliation | 0.096* | 0.147** | 0.312** | 0.160** | 0.275** | 0.246** | 0.226** | 0.165** | 0.261** | 0.212** |
| Tolerance of Uncertainty | 0.056 | 0.099* | 0.220** | 0.177** | 0.197** | 0.174** | 0.131** | 0.057 | 0.181** | 0.135** |
| Persuasiveness | 0.07 | 0.137** | 0.341** | 0.167** | 0.251** | 0.147** | 0.203** | 0.171** | 0.242** | 0.206** |
| Initiation of Structure | -0.004 | 0.072 | 0.221** | 0.132** | 0.158** | 0.101* | 0.090* | 0.052 | 0.132** | 0.096* |
| Tolerance of Freedom | 0.081* | 0.123** | 0.298** | 0.171** | 0.252** | 0.167** | 0.182** | 0.106** | 0.199** | 0.171** |
| Role Assumption | 0.023 | 0.065 | 0.210** | 0.055 | 0.147** | 0.109** | 0.114** | 0.051 | 0.166** | 0.097* |
| Consideration | 0.053 | 0.118** | 0.333** | 0.139** | 0.262** | 0.198** | 0.197** | 0.118** | 0.235** | 0.182** |
| Production Emphasis | 0.019 | 0.111** | 0.267** | 0.062 | 0.216** | 0.107** | 0.146** | 0.087* | 0.189** | 0.123** |
| Predictive Accuracy | 0.005 | 0.104** | 0.279** | 0.116** | 0.216** | 0.139** | 0.148** | 0.084* | 0.180** | 0.135** |
| Integration | 0.048 | 0.122** | 0.340** | 0.135** | 0.254** | 0.168** | 0.186** | 0.112** | 0.219** | 0.173** |
| Superior Orientation | 0.067 | 0.144** | 0.281** | 0.145** | 0.238** | 0.160** | 0.158** | 0.105** | 0.194** | 0.168** |
**. Correlation is significant at the 0.01 level (2-tailed)
*. Correlation is significant at the 0.05 level (2-tailed)
Highest correlation value has been highlighted for each set of leader behaviour aspect and job satisfaction facet
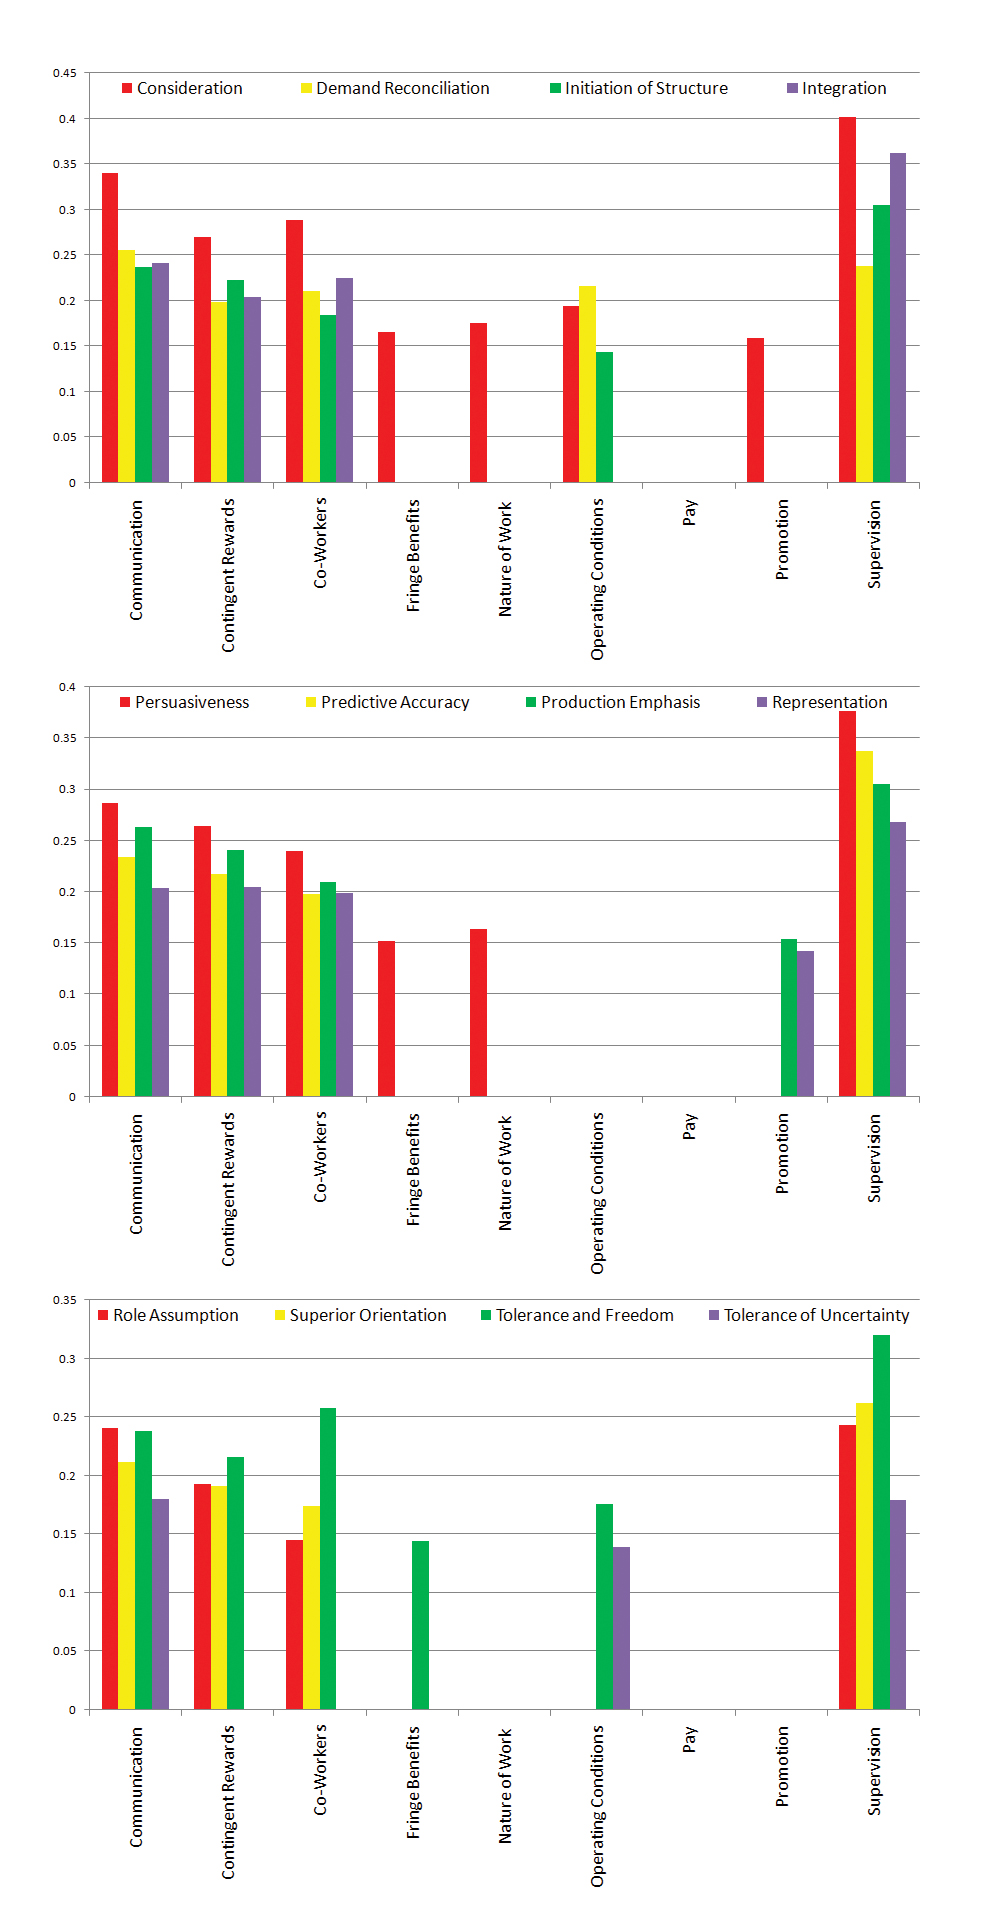
For professionals categorised as doctors, consideration behaviour had maximum correlation with eight of the nine job satisfaction facets [Table/Fig-5]; Communication (r=0.340, p=<0.01), Contingent Rewards (r=0.270, p=<0.01), Co-Workers (r=0.289, p=<0.01), Fringe Benefits (r=0.166, p=<0.01), Nature of Work (r=0.176, p=<0.01), Operating Conditions (r=0.194, p=<0.01), Promotion (r=0.159, p=<0.01) and Supervision (r=0.402, p=<0.01). There was no correlation between leader behaviours aspects and job satisfaction facet ‘pay’.
Correlation between leader’s behaviour and job satisfaction of Doctors (Multi panel split Graph).
x-axis: Job satisfaction facets
y-axis: Correlation values for each pair of leader behavioural aspect and job satisfaction facet (only significantly correlating values have been plotted)
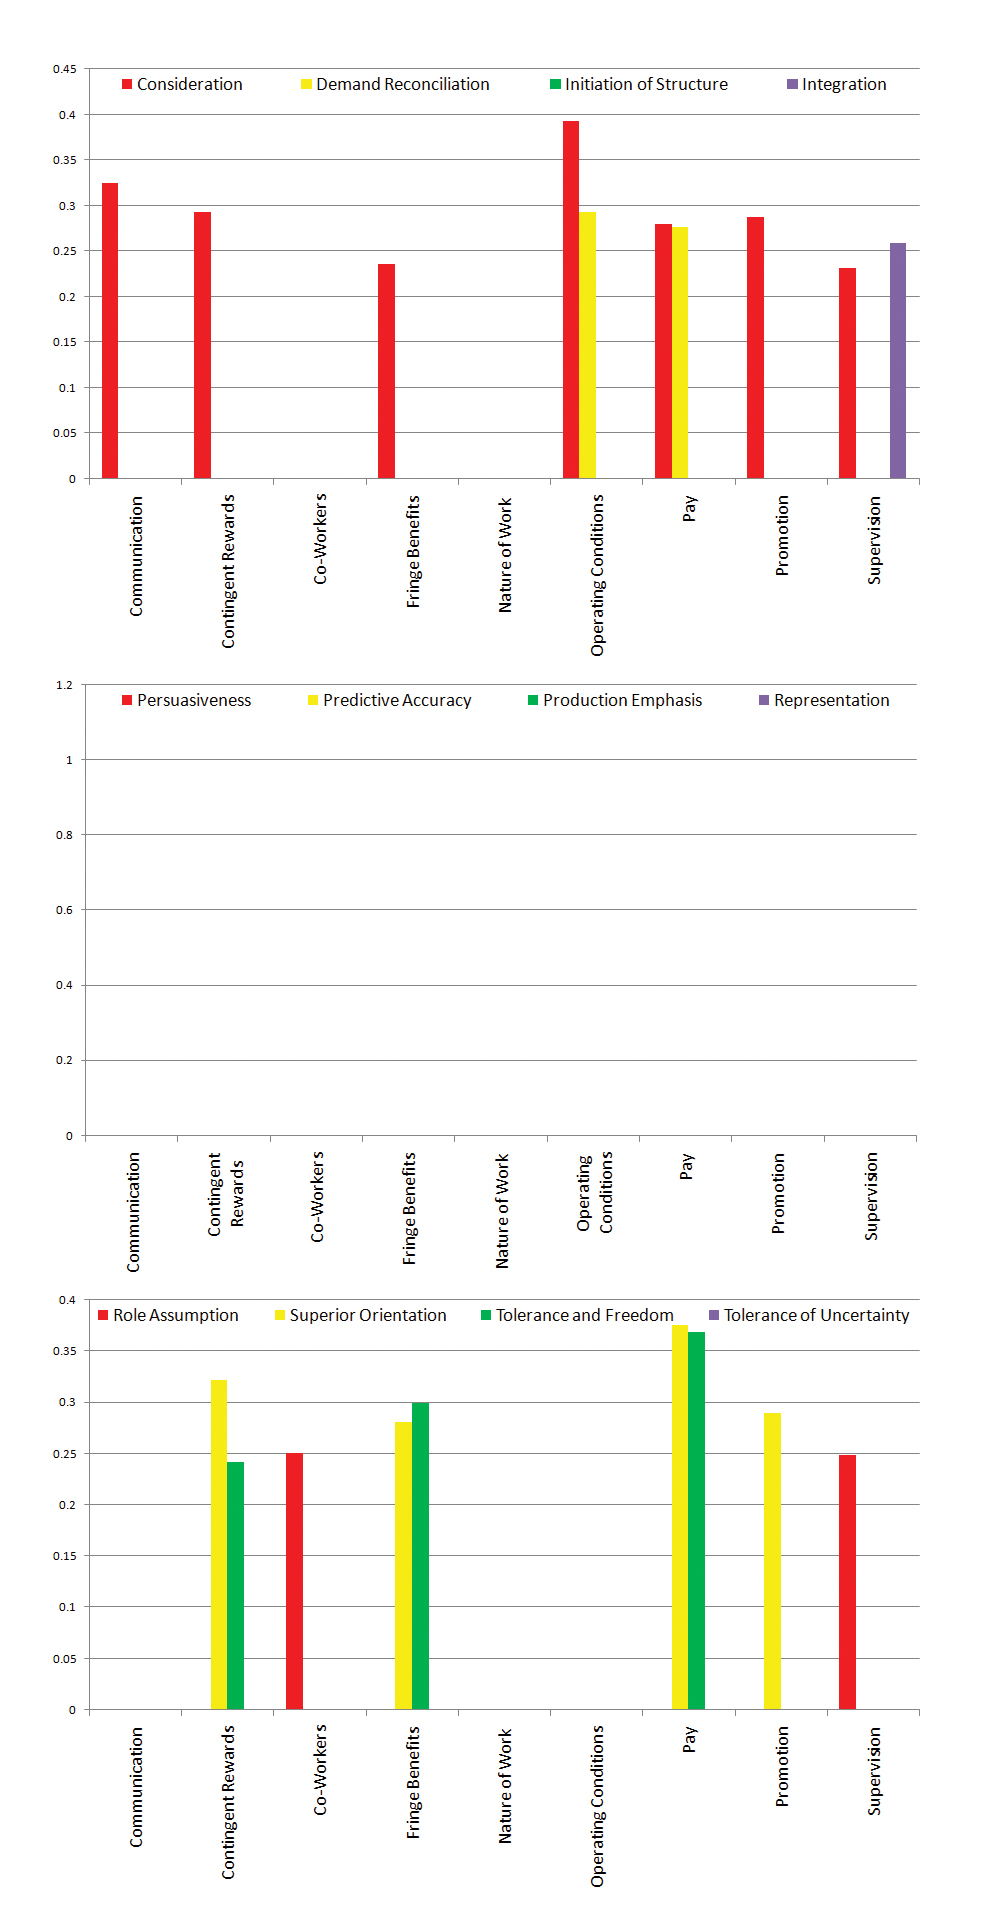
Behavioural aspects of leaders of non-medicos had varying levels of correlation with job satisfaction [Table/Fig-6] facets; communication (r=0.325, p=<0.01), Contingent Rewards (r=0.322, p=<0.01), Co-Workers (r=0.251, p=<0.01), Fringe Benefits (r=0.300, p=<0.01), Operating Conditions (r=0.393, p=<0.01), Pay (r=0.376, p=<0.01), Promotion (r=0.290, p=<0.01) and Supervision (r=0.259, p=<0.01). There was no correlation between leader’s behaviour and job satisfaction facet ‘nature of work’.
Correlation between leader’s behaviour and job satisfaction Non-medicos (Multi panel split Graph).
x-axis: Job satisfaction facets
y-axis: Correlation values for each pair of leader behavioural aspect and job satisfaction facet (only significantly correlating values have been plotted)
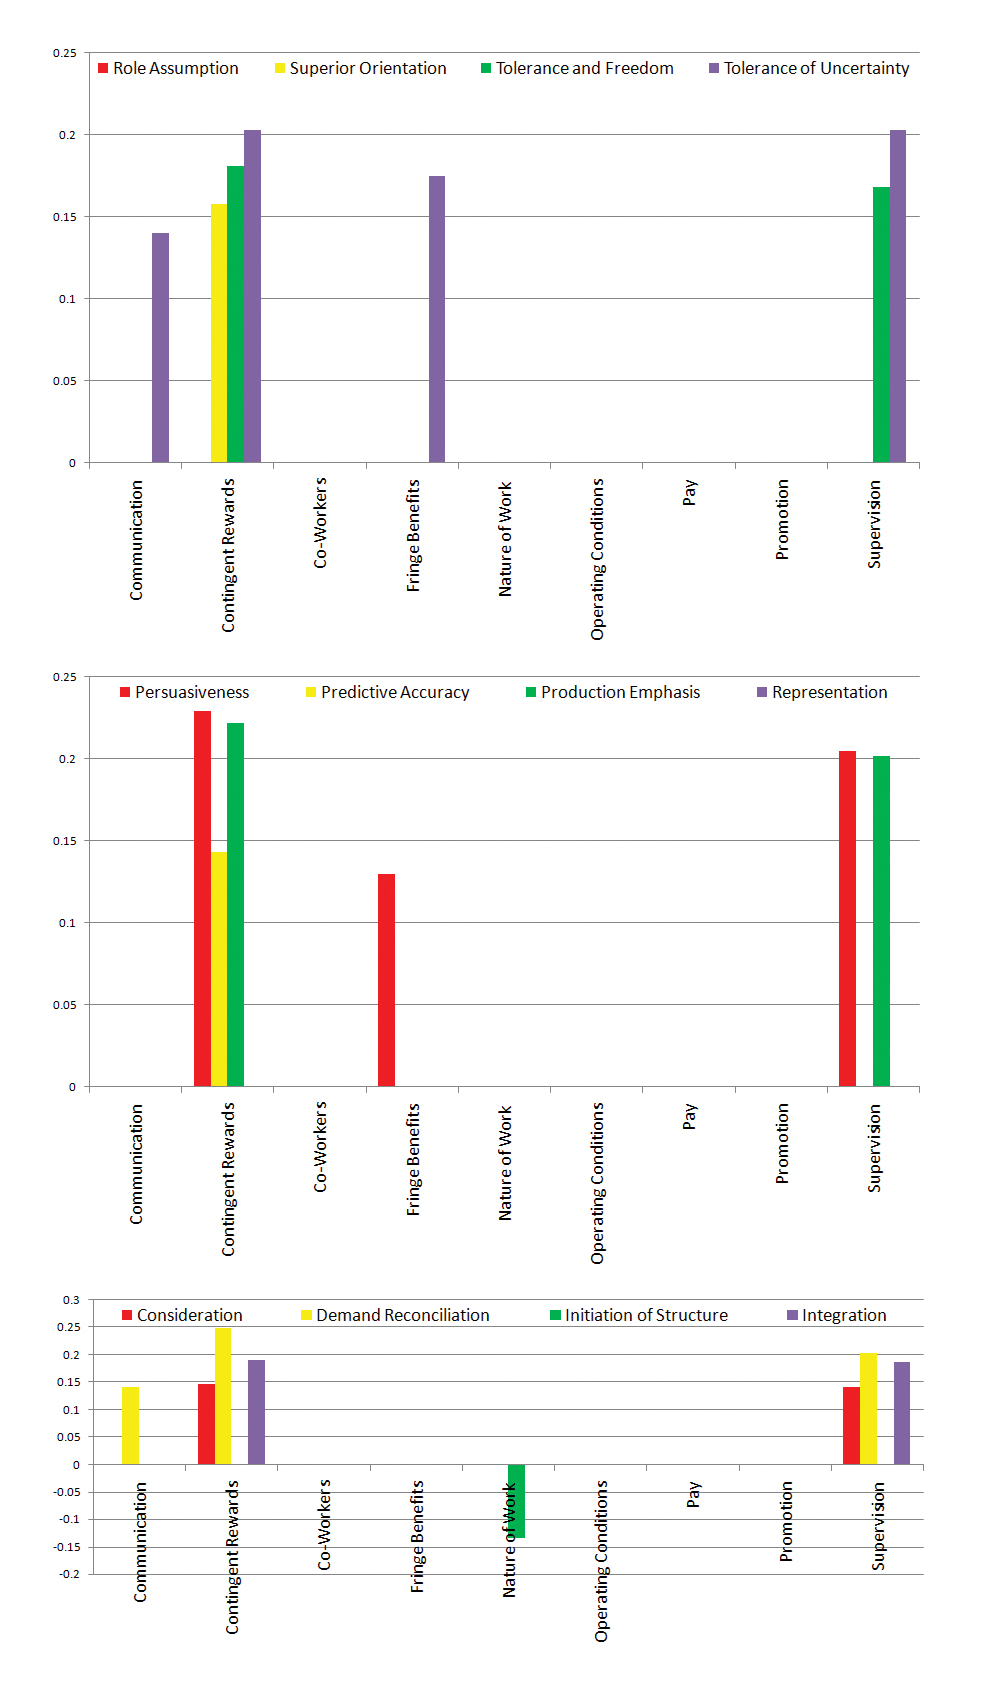
Leader’s behaviour as perceived by nurses had varying levels of correlation for 5 of 9 job satisfaction [Table/Fig-7] facets; Communication (r=0.141, p=<0.01), Contingent Rewards (r=0.248, p=<0.01), Fringe Benefits (r=0.175, p=<0.01) and Supervision (r=0.205, p=<0.01). There was weak and negative association between initiation of structure behavioural aspect and nature of work facet of job satisfaction (r=-0.134, p<0.05). There was no correlation between leader’s behaviour and job satisfaction facets; Co-workers, Operating conditions, Pay and Promotion.
Correlation between leader’s behaviour and job satisfaction of Nurses (Multi panel split Graph).
x-axis: Job satisfaction facets
y-axis: Correlation values for each pair of leader behavioural aspect and job satisfaction facet (only significantly correlating values have been plotted)
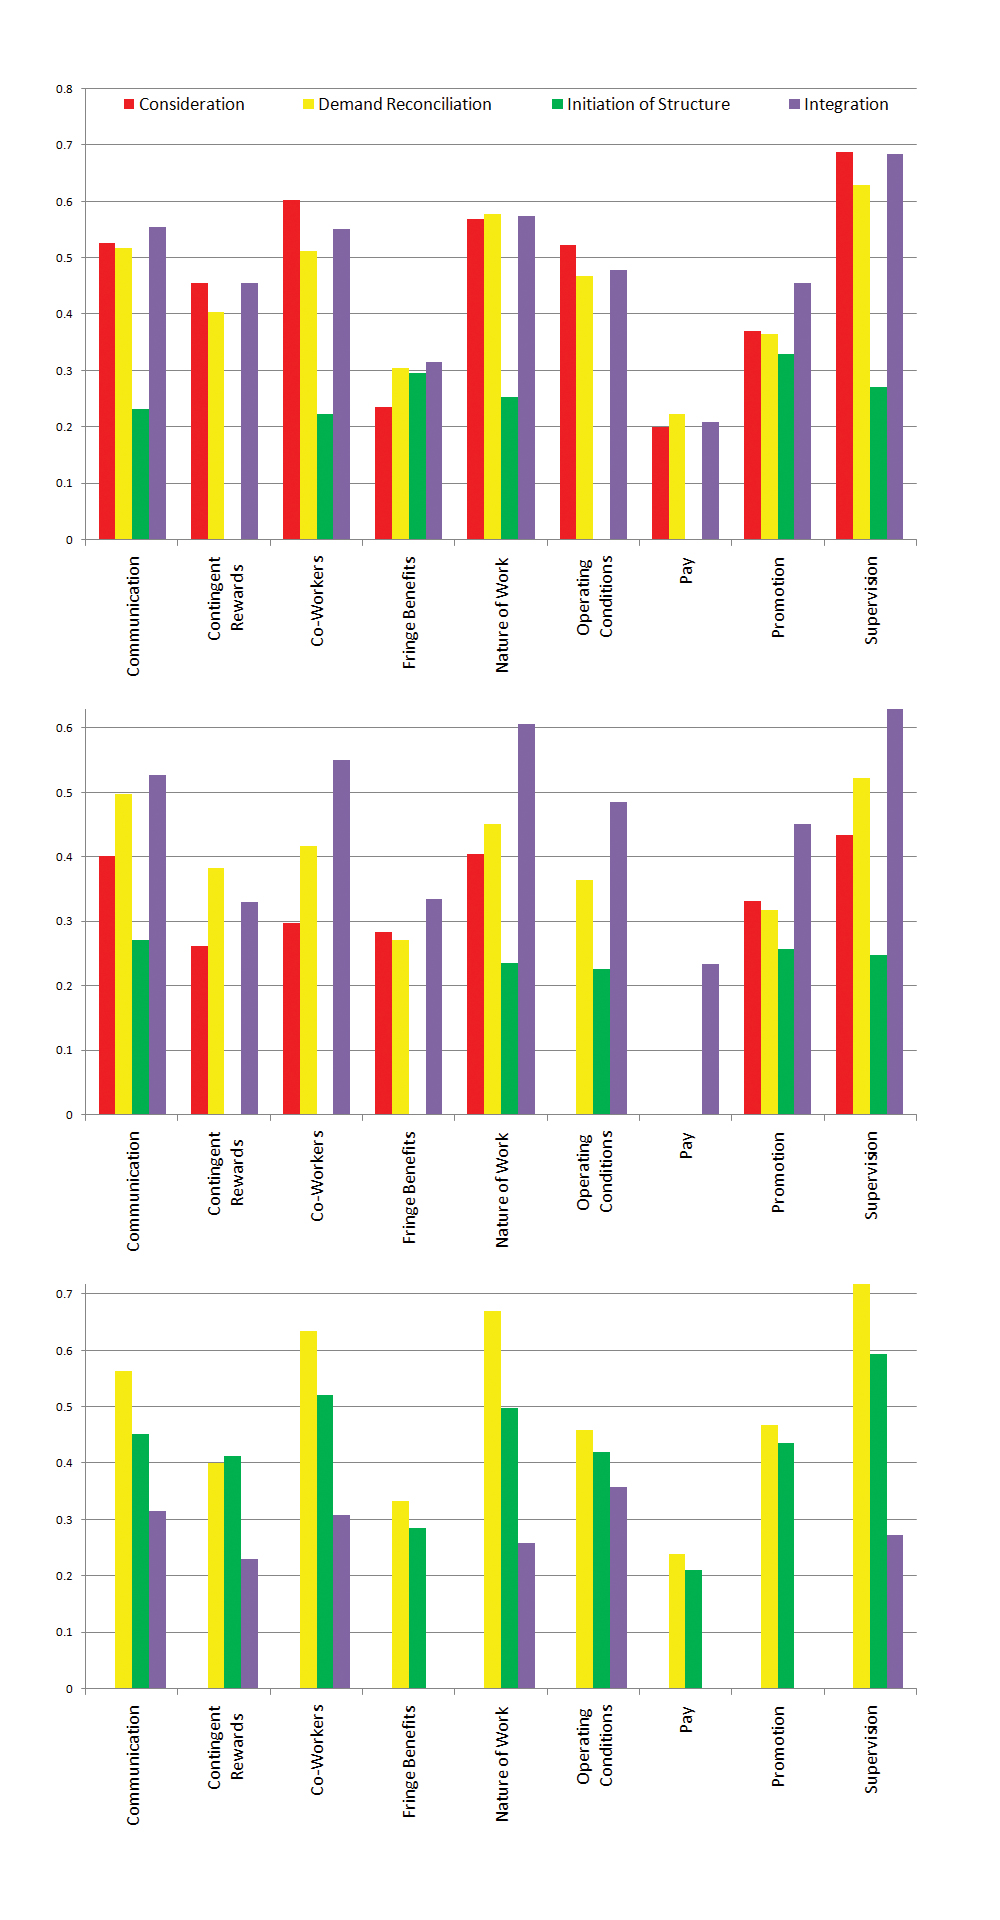
For professionals categorised as paramedics: Superior orientation of the leader had maximum correlation with seven of the nine job satisfaction facets [Table/Fig-8] Communication (r=0.560, p=<0.01), Co-Workers (r=0.634, p=<0.01), Fringe Benefits (r=0.333, p=<0.01), Nature of Work (r=0.670, p=<0.01), pay (r=0.239, p=<0.01), Promotion (r=0.468, p=<0.01) and Supervision (r=0.741, p=<0.01).
Correlation between leader’s behaviour and job satisfaction of Para-medics (Multi panel split Graph).
x-axis: Job satisfaction facets
y-axis: Correlation values for each pair of leader behavioural aspect and job satisfaction facet (only significantly correlating values have been plotted)
Regression analysis was performed using SPSS separately for each category of employees. All the aspects of leader behaviour were entered together as independent variables for each of the job satisfaction facet separately as dependent variable. Maximum association for each of the job satisfaction facets with either or many of the leader behaviour aspects identified as predicators has been summarised in [Table/Fig-9]. It was found that maximum association of leader’s behaviour aspects with job satisfaction was different for each of the professional groups and there was a wide variation in the same.
Maximum R2 values for association between leader behaviour* and job satisfaction for different professional groups.
| Doctors | Non-Medicos | Nurses | Para-medics |
|---|
| Supervision | 0.162 | 0.067 | 0.085 | 0.577 |
| Co-workers | 0.084 | 0.063 | | 0.456 |
| Nature of Work | 0.049 | | 0.048 | 0.448 |
| Operating conditions | 0.047 | 0.200 | | 0.272 |
| Communication | 0.115 | 0.105 | 0.041 | 0.348 |
| Contingent rewards | 0.073 | 0.103 | 0.061 | 0.208 |
| Pay | | 0.142 | | 0.057 |
| Promotion | 0.025 | 0.084 | | 0.219 |
| Fringe benefits | 0.027 | 0.090 | 0.053 | 0.112 |
*all the leader’s behavioural aspects were enetered into regression analysis. Above table depicts maximum R2 values with either, many or all aspects of leader beahaviour having maximum association.
Values in Bold text represent job staisfaction facet with highest R2 value for each employee category
Individual aspects of leader behaviour identified as being significant predicators for various job satisfaction facets were identified and have been enumerated as below:
For doctors regression analysis indicated consideration, tolerance of uncertainty and demand reconciliation aspects as significant predicators.
For non-medicos regression analysis indicated consideration, superior orientation, role assumption, tolerance of freedom and integration aspects as significant predicators.
For nurses regression analysis indicated consideration, demand reconciliation, integration, persuasiveness, tolerance of uncertainty and initiation of structure behaviour aspects as significant predicators.
For paramedics regression analysis indicated superior orientation, integration, consideration, production emphasis and representation aspects as significant predicators.
Discussion
Work profile, working conditions, unmet needs, leaders and hierarchy of leaders vary for diverse professional groups. Hierarchy in the organisations, work profile of segments of employees requires leaders to pedantically and scientifically select particular aspects of behaviour and practice them differently for each group. Considering this reconnoitring was performed dividing employees into four professional groups (namely doctors, nurses, paramedics and non-medicos) and the relationship between perceived leader’s behaviour (of respective leaders) and job satisfaction was examined discretely for each group. Leader behaviour aspects enhanced satisfaction of all employees except for ‘initiation of structure’ behaviour of leader which negatively influenced the ‘nature of work’ facet of job satisfaction of nurses. In Government organisations this negative influence needs to be further studied particularly for nursing segment of employees.
Most of the studies performed earlier to identify correlation between leader’s behaviour and employee outcomes emphasised on leadership styles as a whole [1,3,5,12-14]. Very few of them accentuated on individual aspects of leader behaviour and construed that individual leader’s behavioural aspects have varying magnitude of impact on employee outcomes [13].
Voon ML et al., found contingent rewards and active management aspects to have significant positive correlation and passive management by exception to have negative outcomes [13]. Long CS et al., in a Government organisation found positive correlation for consideration behavioural aspect and that not all transformational characterises have positive effect [17]. This study establishes that different aspects of perceived leader’s behaviour have varying levels of correlation with various facets of job satisfaction. Persuasiveness, consideration, integration and demand reconciliation aspect of leader behaviour have maximum impact on job satisfaction of employees when deliberated as one group. Demand reconciliation behaviour has resilient association with most of the facets of job satisfaction. Saleem H in 2015 found deleterious relationship between transactional leadership style and job satisfaction [18].
Based on the findings it is found that emphasise on individualised consideration, demand reconciliation and tolerance of uncertainty behaviour by leaders of doctors enhances their job satisfaction. Considering doctors as teachers at medical college, similar studies [19,20] on teachers in past found consideration behaviour having significant positive correlation which corroborates with findings of this study.
Leaders of non-medicos must exercise consideration behaviour (having maximum correlation with job satisfaction) along with other behavioural aspects like superior orientation, role assumption, tolerance of freedom and integration. In public sector organisations where pay and promotion is time bound, significant correlation for superior orientation behaviour could be explained as significant number of respondents were contractual employees and waiting for their jobs to be regularised. It can be deciphered that better superior orientation of leader enables subordinates in getting benefits and relaxations which otherwise may not be applicable or are discretionary. Considering job of non-medicos similar to office workers; positive correlation [13,18] was found for transformational leader behaviour and job satisfaction, however contrary to the earlier [13,18] findings there was positive correlation with leader’s transactional style also. This finding is unique with general perception that public sector employees do not work but on the other hand as per study findings they feel more satisfied if they have to work with a leader having transactional approach.
Para-medics appreciate leaders having greater superior orientation apart from other aspects of behaviour like integration, consideration, representation and production emphasis. It shall be worth investigating further as to how their leaders’ cordial relation with next level superior explains for higher job satisfaction of paramedics. One of the possible explanations could be that approximately thirty percent of technicians were contractual and relations of their leader with higher management could get their jobs regularised. It could also be deciphered that better superior orientation of leader enables subordinates in getting benefits and relaxations which otherwise are not applicable or are discretionary.
For nurses, empowerment has been found in earlier studies to improve job satisfaction [14,21-26]. Surprisingly leader behaviour showed least impact on job satisfaction of nurses in the current organisations compared to other three groups. This finding was contrary to the findings of other researchers [27-31]. Further research shall be required to understand reason for such differences in perception of nurses in contrast to other three groups. Nurses appreciate leaders having consideration, persuasion skills, better demand reconciliation, and high on integration, tolerance of uncertain behaviour. ‘Initiation of structure’ behaviour of leader negatively influenced the ‘nature of work’ facet of job satisfaction of nurses in the government medical college. One of the possible reasons could be that management of the working of nursing had not been there for long time and any attempt to change may create sense of threat in the system. Other factors leading to such results could be due to improper working conditions, recruitment policy, improper deployment, fewer career growth opportunities and poorly defined job description. Supportive and creative environment; where nurses felt being valued and recognized enhanced their job satisfaction, retention and excellence [7,8].
The results of this study connote that the association between perceived leader’s behaviour and job satisfaction of employees studies as one group may not be representative of the individual professional categories [32,33]. Leaders of different professional groups have different hierarchy in the organisation thus attributing to difference between professional categories. Further employees in different professional groups are likely to have achieved different levels [33] as per Maslow theory of needs and are striving for next level to be achieved and thus leading to variation in expectations and consequent variation in impact by various aspects of leaders behaviour.
Leaders at their current ages may not change their styles (transformation or transactional) as whole. However they can strive to develop certain aspects of their behaviour. Leadership trainings sessions can help them attain skills for better job satisfaction of subordinates. This study has been able to identify key behaviour aspects based on the category/profession of the employees. Respective leader could focus on identified aspects and prowess leadership skills to improve the job satisfaction of employees and consequent positive patient related outcomes for the organisation.
On interviewing the organisational administrative heads (Principal, Medical Superintendent and Incharge establishment) it was found that head of various departments are being designated by virtue of their seniority and not by leadership skills. There is no practice of training of heads on leadership skills in Government systems. Public sector organisations have Establishment Sections instead of Human Resource Departments (which is a practice in corporate setups). Establishment section is usually headed by senior non-medico employee who has the more knowledge of rules and regulations attained by working experience in such departments. Employees usually approach such sections for getting their due benefits applicable as per rules. For grievance redressal, employees need to contact their respective head of the department or organisation. Organisational administrative heads (Principal, Medical Superintendent and Incharge establishment) also expressed that no active efforts are practiced for improving job satisfaction of personnel in Government systems and development of leadership in the organisation.
Conclusion
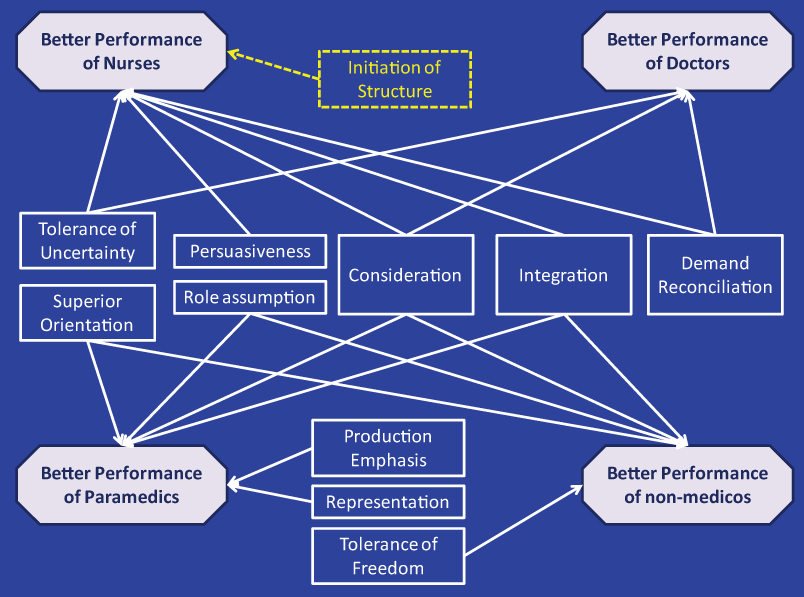
It is recommended for the researchers to study impact of leader’s behaviour on employee’s outcomes separately for every professional group. Indentified catalysing behavioural aspects for each professional group have been enumerated above and summarised in [Table/Fig-10]. Work environment, work culture and other interlinked dynamics of scope of job of nursing professionals needs also be focused to improve patient care by enhancing their job satisfaction. Public sector organisations though having limited scope for going beyond the documented rules need to work on developing the leadership skills of the assigned heads.
Group wise job satisfaction catalysing leader behaviour aspects.
* solid white lines specify positive impact
* doted yellow lines specify negative impact
**. Correlation is significant at the 0.01 level (2-tailed)
*. Correlation is significant at the 0.05 level (2-tailed)
Highest correlation value has been highlighted for each set of leader behaviour aspect and job satisfaction facet
*all the leader’s behavioural aspects were enetered into regression analysis. Above table depicts maximum R2 values with either, many or all aspects of leader beahaviour having maximum association.
Values in Bold text represent job staisfaction facet with highest R2 value for each employee category