Introduction
Depression is a worldwide concern causing lots of adverse social consequences.
Aim
To assess the stochastic processes of depression frequency through statistical modelling.
Materials and Methods
The data contained the processes of depression frequency in Hamadan from April 2008 to March 2016. A total of 3252 patients, according to psychiatrist diagnosed based on DSM-IV criteria, were accounted. To model and forecast the depression incidence frequency, the time series analysis method, Holt-Winter exponential smoothing, was applied.
Results
After a considerable decrease in the last months of 2010 which was followed by an increase in early 2011, a constant series of frequencies happened until 2015. The first months of 2015 are the beginning of the increase in the development of depression.
Conclusions
Present findings demonstrated an increase in the incidence of depression during 2016-2018. The Holt-winter exponential smoothing method can be used as an appropriate statistical tool to analyse and forecast such data.
Depression, Incidence, Time series, Stochastic process
Introduction
Mood disturbances are among the most predominant forms of thought of mental illness [1]. Depression is a significant contributor to the global burden of disease. It affects about 17–22% of the populace [2-5]. Additionally, it is associated with a considerable functional impairment, diminished quality of life, increased burden, both for patients and caregivers, as well just like with a higher risk of mortality [6-9].
The major depressive disorder is predicted to rank as the eleventh largest global contributor to disability-adjusted lifetime years in 2010 [5], a significant proportion of the individuals suffering from a major depressive episode develop a chronic condition. Approximately about 30% of depressed individuals and 47% of the patients who present in mental health care services have problems with serious varieties of depression [10-13]. The higher prevalence of depression among women is one of the most widely recorded findings in psychiatric epidemiology [14]. This has been found throughout the world through variety of analysis schemes and interview methods [15] Seasonal variations in mood and behaviour have been recognised since Hippocrates. Hospital admission rates for mania and depressions have been shown to have annual rhythms. Depression tends to be higher in spring and in autumn [16-18].
Statistical methods include a variety of tools which deal with lots of medical and clinical problems. Modelling and forecasting methods such as time series [19-21], multivariate analysis [22,23] and also machine learning methods [24] are used frequently in studying special types of response variables.
A research characteristic such as incidence of an event might be of consequence and one can not determine the future state with precision. However, forecasting methods can reduce consequent risks and costs caused by the uncertainty of conditions in future [25]. Studying the development of a characteristic over the time can be carried out using stochastic processes methods. Time series methods, as well as Markov chain approaches, are classes of stochastic processes in which a future state of an experiment will depend on this current and previous status of the statement [26].
Several conditions such as stationary and seasonality of the time series observation require special attention in determining the forecasting and modelling method [26]. Among several time series methods, Holt-Winters exponential smoothing method is widely used based on its flexibility [27]. This popular method was first utilised to forecast seasonal time series [25].
The present study aimed to apply the Holt-Winters Exponential Smoothing method (HWES) approach to model and forecast monthly depression incidence frequency in Hamadan Province, from 2008 to 2016.
Materials and Methods
The present historic cohort investigation was done on depression patients in Farshchian Psychiatric Hospital, from April 2008 to April 2016. Patients according to DSM-IV criteria were hospitalised. Also, data collection based on a checklist was developed by the investigators. All the explorations were done by R.3.2.3. Software using the packages “forecast” and “series”. The statistical considerable level was assumed as 0.05.
Statistical Analysis
Holt-Winters Exponential Smoothing (HWES); a time series model is a stochastic procedure of observations during the time [28,29]. Analysing such data requires a model which considers the conditions such as seasonality and stationary of the consequent observations. After the model is fitted, parameter estimation and evaluating the goodness of fit can be carried out. Using the model, one can find out the status and procedure of the time series observation during the time [30].
An HWES is of exponential smoothing methods which the forecasting procedure performs with a special type of weighting the previous observations. This method assigns exponentially increasing weights as the previous observation get closer to the current state and the older observations are given relatively less weight [25]. Special types of exponential smoothing methods such as single, double and triple smoothing approaches can be determined according to presence/absence of the trend and seasonality. In contrast to single and double smoothing methods, the HWES is applied when the series presents trend in addition to seasonality. A multiplicative or additive approach can be applied based on the multiplicative or additive seasonality nature of the time series observations, respectively.
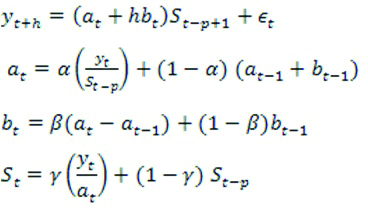
A multiplicative HWES approach was used to consider multiplicative change in a seasonal development of time series. Seasonal trend is defined as the propensity of time-series data to display behaviour that reiterates itself every L periods. The multiplicative term refers to an amount that multiplies at beginning of next period. The following model includes “yt+h” as the frequency of depression at "t+h" (the time of processes), "p" as period length, (at, bt) as the permanent and trend of time series, as "S" the multiplicative seasonal factor and Et as the random error component.
Forecasting the estimated response at any future time point can be carried out using the estimated coefficients from the model.
Formula 1
Results
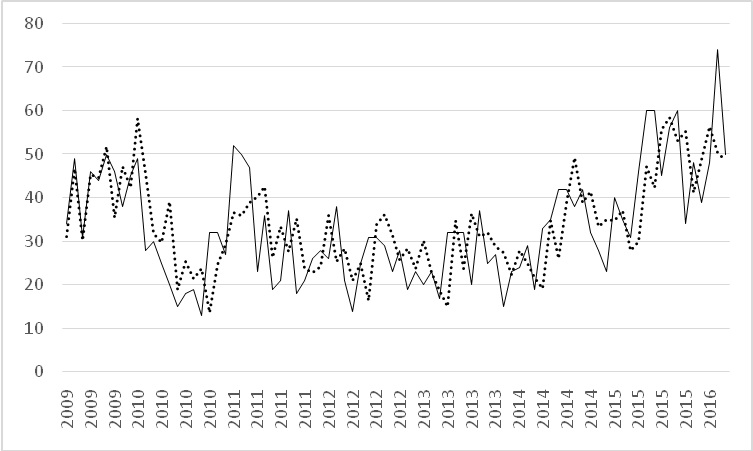
The data contains the processes of depression frequency in Hamadan from April 2008 to March 2016. The [Table/Fig-1] shows the development of depression as well as fitted numbers estimated by the HWES method. Based on the observations, after a considerable decrease in the last months of 2010 which was followed by an increase in early 2011, a constant series of frequencies happened until 2015. The initial months of 2015 were the beginning of an increase in the development of depression which continued untill March 2016.
The development of depression (Dashed line=estimated frequencies resulted by the HWES, line=Observed frequency of depression).
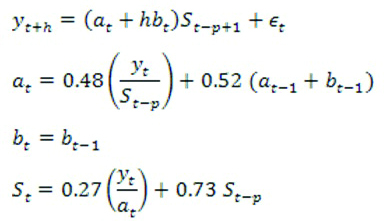
Holt-Winters exponential smoothing method with a multiplicative approach was applied. The model resulted is as follows:
Formula 2
The level, trend and seasonal components were estimated and shown in [Table/Fig-2] in which the period is 12 month (p=12). Thus, according to the nature of HWES modeling, forecasting the future status of depression is possible.
The estimation of level, trend and seasonal components of time series HWES model.
| Coefficients | Estimates |
|---|
| a | 57.81 |
| b | 0.43 |
| s1 | 0.89 |
| s2 | 1.08 |
| s3 | 0.86 |
| s4 | 0.87 |
| s5 | 1.02 |
| s6 | 0.96 |
| s7 | 0.85 |
| s8 | 0.84 |
| s9 | 0.87 |
| s10 | 1.12 |
| s11 | 1.15 |
| s12 | 0.85 |
Hence, a 24 month prediction of depression was carried out using the estimated model. The frequencies as well as a 95% confidence interval are exposed in [Table/Fig-3].
A 24 months forecasting of depression using the HWES model.
| Date | Point forecast | 95% Confidence interval |
|---|
| April-2016 | 52.25 | 40.35 - 64.16 |
| May-2016 | 63.38 | 47.07 -79.70 |
| June-2016 | 51.01 | 34.40 - 67.62 |
| July-2016 | 51.50 | 32.46 - 70.54 |
| August-2016 | 61.04 | 37.24 - 84.84 |
| September-2016 | 57.92 | 33.53 - 82.31 |
| October-2016 | 51.91 | 28.07 - 75.76 |
| November-2016 | 51.97 | 26.51 - 77.44 |
| December-2016 | 53.98 | 26.20 - 81.76 |
| January-2017 | 69.68 | 33.38 - 105.99 |
| February-2017 | 72.07 | 33.69 - 110.45 |
| March-2017 | 53.91 | 17.35 - 90.47 |
| April-2017 | 56.91 | 19.14 - 94.68 |
| May-2017 | 68.99 | 23.12 - 114.86 |
| June-2017 | 55.49 | 17.16 - 93.82 |
| July-2017 | 55.99 | 16.48 - 95.50 |
| August-2017 | 66.33 | 19.38 - 113.28 |
| September-2017 | 62.90 | 17.57 - 108.22 |
| October-2017 | 56.34 | 14.67 - 98.01 |
| November-2017 | 56.38 | 13.92 - 98.84 |
| December-2017 | 58.52 | 13.84 - 103.21 |
| January-2018 | 75.51 | 18.11 - 132.90 |
| February-2018 | 78.05 | 18.42 - 137.67 |
| March-2018 | 58.35 | 6.64 - 110.06 |
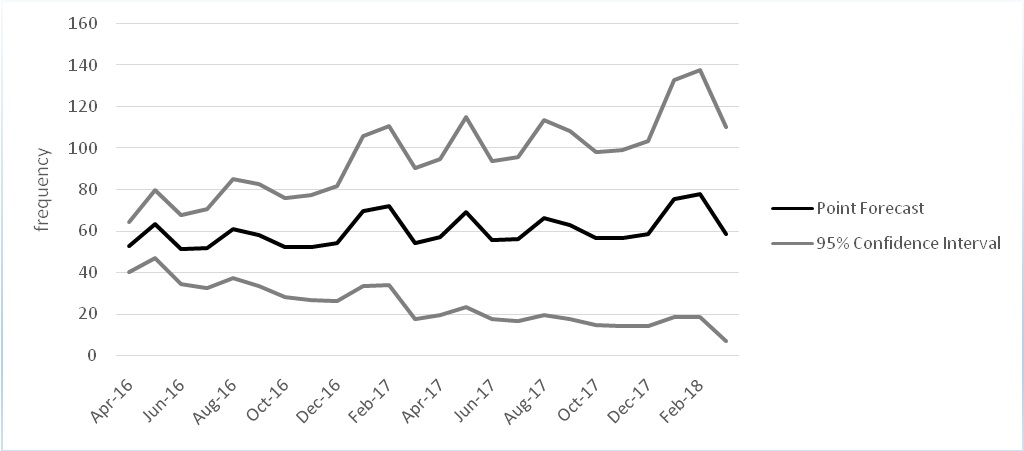
Moreover, [Table/Fig-4] demonstrates the development of depression in the next 24 months with 95% confidence interval.
Forecasting 24 next months of depression frequency.
Discussion
Current research aimed to apply the HWES approach to model and forecast monthly depression incidence frequency in Hamadan Province, from 2008 to 2016. The present findings illustrated that after a considerable decrease in the last months of 2010 which was followed by an increase in early 2011, a constant series of frequencies happened until 2015. The first months of 2015 are the beginning of an increase in the development of depression. Epidemiological researches on mood disorders in the overall population most frequently explain depressed feelings during winter, affecting women harder than men [31,32] and young women severer than older women [19]. Kraines SH, also illustrated an increase in the occurrence of depression [33]. On the other hand, Magnusson A et al., did not find any seasonal consequence on the occurrence of depression, though some contradictory effects reported for seasonal differences in frequency of admittances to hospital for effective incidents and for other forms of human behaviour could be due to methodological difference [34]. The psychobiological foundation underlying a connection between seasonality and depression is unclear.
Moore PJ et al., used exponential smoothing and Gaussian process regression to forecast depression among patients with bipolar disorder resulting in the same performance of the methods [35]. Dorea FC et al., performed three types of time series model including HWES to examine syndromic surveillance using veterinary laboratory information. They mentioned HWES as a recursive estimating method which can adapt the forecasts in reply to recent behaviour of the time series. However, they concluded that using several models caused more accurate and complete results [36]. However, a study demonstrated the out performance of other methods comparing to HWES. Zhang L et al., predicted the incidence of Hepatitis B in China and showed more accurate results by Nash nonlinear grey Bernoulli model in comparison to traditional methods such as HWES [37].
Limitation
The main limitation of the current research was the lack of access to the data before 2008.
Conclusion
The current study forecasted an increase in depression incidence during the next two years and health policy makers must apply proper tools to reduce its costs and negative consequences.
[1]. Nestler EJ, Barrot M, DiLeone RJ, Eisch AJ, Gold SJ, Monteggia LM, Neurobiology of depressionNeuron 2002 34(1):13-25.10.1016/S0896-6273(02)00653-0 [Google Scholar] [CrossRef]
[2]. Kessler RC, Zhao S, Blazer DG, Swartz M, Prevalence, correlates, and course of minor depression and major depression in the National Comorbidity SurveyJournal of Affective Disorders 1997 45(1):19-30.0.1016/S0165-0327(97)00056-6 [Google Scholar] [CrossRef]
[3]. Jacobi F, Wittchen H-U, Hölting C, Höfler M, Pfister H, Müller N, Prevalence, co-morbidity and correlates of mental disorders in the general population: results from the German Health Interview and Examination Survey (GHS)Psychological Medicine 2004 34(04):597-611.10.1017/S003329170300139915099415 [Google Scholar] [CrossRef] [PubMed]
[4]. Angst J, Gamma A, Rössler W, Ajdacic V, Klein DN, Long-term depression versus episodic major depression: results from the prospective Zurich study of a community sampleJournal of Affective Disorders 2009 115(1):112-21.10.1016/j.jad.2008.09.02318973954 [Google Scholar] [CrossRef] [PubMed]
[5]. Negt P, Brakemeier EL, Michalak J, Winter L, Bleich S, Kahl KG, The treatment of chronic depression with cognitive behavioural analysis system of psychotherapy: a systematic review and meta-analysis of randomized-controlled clinical trialsBrain Behav 2016 6(8):e0048610.1002/brb3.48627247856 [Google Scholar] [CrossRef] [PubMed]
[6]. Vilagut G, Forero CG, Barbaglia G, Alonso J, Screening for depression in the general population with the center for epidemiologic studies depression (CES-D): a systematic review with meta-analysisPloS one 2016 11(5):e015543110.1371/journal.pone.015543127182821 [Google Scholar] [CrossRef] [PubMed]
[7]. Bromet E, Andrade LH, Hwang I, Sampson NA, Alonso J, De Girolamo G, Cross-national epidemiology of DSM-IV major depressive episodeBMC Medicine 2011 9(1):0110.1186/1741-7015-9-9021791035 [Google Scholar] [CrossRef] [PubMed]
[8]. Ahmadvand A, Sepehrmanesh Z, Ghoreishi FS, Afshinmajd S, Prevalence of psychiatric disorders in the general population of Kashan, IranArchives of Iranian Medicine 2012 15(4):205 [Google Scholar]
[9]. Yazdi-Ravandi S, Taslimi ZA, Haghparast AB, Ghaleiha A, Quality of life in patients with chronic pain disorders: determination the role of intensity and duration of painKoomesh 2016 17(4):836-43. [Google Scholar]
[10]. Arnow BA, Constantino MJ, Effectiveness of psychotherapy and combination treatment for chronic depressionJournal of Clinical Psychology 2003 59(8):893-905.10.1002/jclp.1018112858430 [Google Scholar] [CrossRef] [PubMed]
[11]. Gilmer WS, Trivedi MH, Rush AJ, Wisniewski SR, Luther J, Howland RH, Factors associated with chronic depressive episodes: a preliminary report from the STAR-D projectActa Psychiatr Scand 2005 112(6):425-33.10.1111/j.1600-0447.2005.00633.x16279871 [Google Scholar] [CrossRef] [PubMed]
[12]. Torpey DC, Klein DN, Chronic depression: update on classification and treatmentCurr Psychiatry Rep 2008 10(6):458-64.0.1007/s11920-008-0074-618980728 [Google Scholar] [CrossRef] [PubMed]
[13]. Satyanarayana S, Enns MW, Cox BJ, Sareen J, Prevalence and correlates of chronic depression in the canadian community health survey: mental health and well-beingCan J Psychiatry 2009 54(6):389-98.Epub 2009/06/1710.1177/07067437090540060619527559 [Google Scholar] [CrossRef] [PubMed]
[14]. Rezaei T, Yazdi-Ravandi S, Ghaleiha A, Rabiei S, Ali M, Depression among medical students of Hamadan University of Medical Sciences in 2014: The Role of demographic variablesPajouhan Scientific Journal 2015 13(4):1-8. [Google Scholar]
[15]. Kessler RC, Epidemiology of women and depressionJournal of Affective Disorders 2003 74(1):5-13.10.1016/S0165-0327(02)00426-3 [Google Scholar] [CrossRef]
[16]. Eastwood M, Peacocke J, Seasonal patterns of suicide, depression and electroconvulsive therapyThe British Journal of Psychiatry 1976 129(5):472-75.10.1192/bjp.129.5.472990662 [Google Scholar] [CrossRef] [PubMed]
[17]. Silverstone T, Romans S, Hunt N, McPherson H, Is there a seasonal pattern of relapse in bipolar affective disorders? A dual northern and southern hemisphere cohort studyThe British Journal of Psychiatry 1995 167(1):58-60.10.1192/bjp.167.1.587551610 [Google Scholar] [CrossRef] [PubMed]
[18]. Morken G, Lilleeng S, Linaker OM, Seasonal variation in suicides and in admissions to hospital for mania and depressionJournal of affective disorders 2002 69(1):39-45.10.1016/S0165-0327(00)00373-6 [Google Scholar] [CrossRef]
[19]. Dayer MJ, Jones S, Prendergast B, Baddour LM, Lockhart PB, Thornhill MH, Incidence of infective endocarditis in England, 2000–13: a secular trend, interrupted time-series analysisThe Lancet 2015 385(9974):1219-28.10.1016/S0140-6736(14)62007-9 [Google Scholar] [CrossRef]
[20]. Shahdoust M, Sadeghifar M, Poorolajal J, Javanrooh N, Amini P, Predicting Hepatitis B monthly incidence rates using weighted markov chains and time series methodsJournal of Research in Health Sciences 2014 15(1):28-31. [Google Scholar]
[21]. Ghaffari ME, Ghaleiha A, Taslimi Z, Sarvi F, Amini P, Sadeghifar M, Forecasting schizophrenia incidence frequencies using time series approachInternational Clinical Neuroscience Journal 2018 4(4):152-56.10.15171/icnj.2017.06 [Google Scholar] [CrossRef]
[22]. Calderwood MS, Kleinman K, Murphy MV, Yokoe D, Platt R, Huang SS, 111U. S. Hospitals with Low Surgical Volume are Excluded from Public Reporting but have Higher Rates of Surgical Site InfectionOpen Forum Infectious Diseases 2014 Oxford University Press10.1093/ofid/ofu051.19 [Google Scholar] [CrossRef]
[23]. Shen Y-C, Hsia RY, Do patients hospitalised in high-minority hospitals experience more diversion and poorer outcomes? A retrospective multivariate analysis of Medicare patients in CaliforniaBMJ Open 2016 6(3):e01026310.1136/bmjopen-2015-01026326988352 [Google Scholar] [CrossRef] [PubMed]
[24]. Chen Y, Cao W, Gao X, Ong H, Ji T, Predicting postoperative complications of head and neck squamous cell carcinoma in elderly patients using random forest algorithm modelBMC Medical Informatics and Decision Making 2015 15(1):1-10.10.1186/s12911-015-0165-326054335 [Google Scholar] [CrossRef] [PubMed]
[25]. Prajakta SK, Time series forecasting using holt-winters exponential smoothingKanwal Rekhi School of Information Technology 2004 4329008:01-13. [Google Scholar]
[26]. Box GE, Jenkins GM, Reinsel GC, Ljung GM, Time series analysis: forecasting and control 2015 John Wiley and Sons [Google Scholar]
[27]. Pan R, Holt–Winters Exponential SmoothingWiley Encyclopedia of Operations Research and Management Science 2010 10.1002/9780470400531.eorms0385 [Google Scholar] [CrossRef]
[28]. Hamilton JD, Time series analysis 1994 Princeton university press Princeton [Google Scholar]
[29]. Prado R, West M, Time series: modeling, computation, and inference 2010 CRC Press10.1201/9781439882757 [Google Scholar] [CrossRef]
[30]. Brockwell PJ, Davis RA, Introduction to time series and forecasting 2006 Springer Science and Business Media [Google Scholar]
[31]. Kasper S, Wehr TA, Bartko JJ, Gaist PA, Rosenthal NE, Epidemiological findings of seasonal changes in mood and behaviour: a telephone survey of Montgomery County, MarylandArchives of general psychiatry 1989 46(9):82310.1001/archpsyc.1989.018100900650102789026 [Google Scholar] [CrossRef] [PubMed]
[32]. Schlager D, Schwartz JE, Bromet EJ, Seasonal variations of current symptoms in a healthy populationThe British Journal of Psychiatry 1993 163(3):322-26.10.1192/bjp.163.3.3228401960 [Google Scholar] [CrossRef] [PubMed]
[33]. Kraines SH, Mental depressions and their treatment 1957 Macmillan [Google Scholar]
[34]. Magnusson A, Axelsson J, Karlsson MM, Oskarsson H, Lack of seasonal mood change in the Icelandic population: results of a cross-sectional studyAmerican Journal of Psychiatry 2000 157(2):234-38.10.1176/appi.ajp.157.2.23410671392 [Google Scholar] [CrossRef] [PubMed]
[35]. Moore PJ, Little MA, McSharry PE, Geddes JR, Goodwin GM, Forecasting depression in bipolar disorderIEEE Transactions on Biomedical Engineering 2012 59(10):2801-07.10.1109/TBME.2012.221071522855220 [Google Scholar] [CrossRef] [PubMed]
[36]. Dórea FC, McEwen BJ, McNab WB, Revie CW, Sanchez J, Syndromic surveillance using veterinary laboratory data: data pre-processing and algorithm performance evaluationJournal of the Royal Society Interface 2013 10(83):2013011410.1098/rsif.2013.011423576782 [Google Scholar] [CrossRef] [PubMed]
[37]. Zhang L, Zheng Y, Wang K, Zhang X, Zheng Y, An optimized Nash nonlinear grey Bernoulli model based on particle swarm optimization and its application in prediction for the incidence of Hepatitis B in Xinjiang, ChinaComputers in Biology and Medicine 2014 49:67-73.10.1016/j.compbiomed.2014.02.00824747730 [Google Scholar] [CrossRef] [PubMed]