Introduction
The incidence of Chronic Kidney Disease (CKD) is rising throughout the world, and with it, the need for kidney transplants. The ‘Gold Standard’ in measuring Glomerular Filtration Rate (GFR) in potential kidney donors remains a renogram. In many countries, access to this technology remains limited and expensive. We evaluated a Computed Tomography (CT)- based method of calculating the GFR using estimated renal volume, as first described by Herts’ et al.
Aim
To compare differential renal function as assessed by isotope renal scan using 99mTc Diethylene-Triamine-Penta-Acetic Acid (DTPA) with CT scan measured differential renal volume. Further, we aimed to compare and correlate the CT scan measured volume based GFR, with GFR estimated using Modification of Diet in Renal Diseases (MDRD) and Cockcroft-Gault (CG) methods.
Materials and Methods
A total of 61 healthy donors (47 female, 14 male) were studied. Standard contrast CT scan was performed using non-ionic iodinated contrast. Special volumetric 3D analysis was used to calculate the volume. Herts formula was used to calculate the GFR. DTPA renogram was done on all patients with a Gamma Camera. The results were compared with MDRD and CG estimated GFR on all patients using Analysis of Variance (ANOVA) and Tukey Post-Hoc Test.
Results
The Volume Calculated-GFR correlates better with total GFR than GFR calculated by CG and MDRD formulae.
Conclusion
The Herts formula based GFR correlated well with estimated GFR values and may be used in circumstances were access to DTPA renograms is expensive or unavailable.
Introduction
The incidence of CKD is rising globally due to the rise in diseases like Diabetes Mellitus (DM), Hypertension (HTN) and Obesity [1]. With increasing success rates, and an improved quality of life, more patients are opting for kidney transplantation rather than continuing other renal replacement therapies [2].
In India, as in most middle- and low-income countries, approximately 90% of kidneys are donated from live related donors [3]. To meet the demand, “Marginal Kidney Donors” are being selected increasingly in view of the burgeoning waiting list [4]. In such a scenario, it becomes important to ensure good postoperative and long-term complication-free life for kidney donors who are selected by the expanded donor selection criteria.
As a standard protocol for donor evaluation, donors are assessed for Human Leukocyte Antigen (HLA) matching, surgical fitness and assessment of kidney function. The kidney to be selected for donation is selected based on adequate GFR, anatomical factors and differential function. The investigation of choice for the assessment of GFR in donors is the DTPA acid (99mTc-DTPA) Renogram [5]. However, its availability outside large cities in low- and middle-income countries is a constraint. Hence, there is a need for a reliable alternative method of measurement of total and differential GFR comparable to estimated GFR (eGFR) as measured by DTPA renogram.
Other methods of estimating GFR in patients include the Modification of Diet in Renal Disease (MDRD) and Cockcroft-Gault (CG) methods. Cockcroft DW et al., described their eponymous formula, the CG formula, which uses an equation based on age, weight, height, and serum creatinine along with correlation factors to calculate creatinine clearance [6]. This formula acts as a surrogate for estimated GFR. This formula was based mainly on hospitalised men as there were only nine females in the studied group, and it requires height and weight of the patient to be measured as well, restricting its use in most laboratories. The MDRD formula was derived in a study on dietary modifications in patients with CKD in which there was added the objective of devising a formula to calculate GFR from plasma creatinine levels [7]. Logistic regression was used to figure out a final 4 variable formula based on gender, plasma creatinine value, age and race differentiation with results expressed as per 1.73 m2 of body surface area. The MDRD formula was derived from a study on CKD patients, hence its utility in healthy persons remains undefined. Furthermore, it has not been validated in patients under 18 years, older than 70 years of age, and those who are obese, limiting its use in potential healthy kidney donors [8].
This paper evaluates a kidney volume-based formula of assessment of GFR as proposed by Herts B et al., in Radiology [9].
An abbreviated version of this paper was presented as a poster at the American Urological Association Annual Meeting in 2016 [10].
Our hypothesis was that contrast CT scan calculated volume-based GFR can be used as alternative methods of calculation of GFR and differential renal function.
This study aimed to compare GFR and differential renal function as assessed by isotope renal scan using 99mTc DTPA with CT scan measured differential renal volume. Further, we aimed to compare the CT scan measured volume based GFR, with GFR estimated using MDRD and CG methods.
Materials and Methods
This study was done at Jaslok Hospital and Research Centre (JHRC), Mumbai, Maharashtra, India. The Instutional Ethical Committee approved the study. The study was an observational study conducted on 61 consecutive kidney donors (47 female and 14 male) admitted in hospital for live related kidney transplantation over a period from 2012-2013. This was a time-bound study; hence we intended to evaluate all prospective donors at our study centre during the said period. Prospective kidney donors who had investigations done outside the study hospital, were excluded. As per protocol, donor evaluation was done by HLA matching, surgical fitness and functional and anatomical assessment of the urinary system.
Measurement of Renal Volume: Anatomical assessment was done with 64-slice Helical CT scanner (Discovery CT 750 HD, GE Medical Systems, USA) installed at Department of Radiology, JHRC. Prospective donors underwent 4 hours of fasting before CT scan. Plain images were obtained prior to intra venous contrast. Proper hydration was maintained with i.v. fluids given during procedure. Non-ionic iodinated contrast material (Iohexol 350) was used. After the administration of contrast media (1-1.5 mL/kg body weight) at a rate of 3 mL/sec, images were captured in arterial phase, venous phase and renal excretory phase. Axial images were taken at a thickness of 1.25 mm. The kidney size was measured using software from GE Advantage Windows Workstation (AW 4.6-04.047- SLED-11, Volume Viewer-Version VXT 1-11-3-81). Kidney volume of prospective donors was measured from coronal section contiguous slices in CT images with parenchymal enhancement. Around the 3D volume-rendered image of the kidney a region of interest was drawn. Three-Dimensional (3D) tools inbuilt in the CT scan functioned by automatically filling space that contains similar voxel values. Selecting a piece of the renal parenchyma allowed the software to identify the remainder of surrounding renal parenchyma by measuring same Hounsfield Units (HU) and subtracting others of different HU like adjacent fat, or fluid in the renal pelvis. Each 3D model of each kidney was finally visually compared to the cross-sectional images, ensuring that only the renal parenchyma was included in the virtual representation.
Selecting the ‘view type’ menu in the CT workstation showed a histogram representing the percent voxel in the 3D structure of any given attenuation, thus giving the final 3D model. This tool provided the total volume and the mean attenuation for the entire 3D model in one step. Differential renal volume measurement was done by dividing the renal volume of the side of interest with the total renal volume as calculated above. The renal volume was calculated in milliliters.
Measurement of Glomerular Filtration Rate: GFR was measured with 99mTc-DTPA renogram at Department of Nuclear Medicine, JHRC which was done with a Gamma Camera (GE Discovery NM-670, GE Medical Systems, USA).
The prospective kidney donor was checked for any allergy to drugs before proceeding for isotope renogram. For the procedure one mci of 99mTc-DTPA was taken in the syringe and its radio-activity counted under the gamma camera before injection. Then, a butterfly I.V. cannula was secured in median cubital vein of the donor and 99mTc-DTPA was injected. Both the kidneys were scanned under gamma camera for the next 3-5 minutes and radioactivity was counted in both kidneys for assessment of differential uptake of isotope in each kidney. After completion of scanning, the empty syringe was placed under the gamma camera and residual radioactivity in the syringe post injection was counted to get net amount of radioactivity injected. The donor’s blood samples were collected at 1 hour and 3 hours post injection. Rate of disappearance of radioactivity was then calculated from these two samples by the method described by Russel CD et al., [11] and then total GFR calculated by applying this data to a linear dual compartment model. Once total GFR was obtained, individual kidney GFR was then calculated by applying this to the data of differential uptake obtained during Gamma Camera screening.
The formula used for calculation of total GFR was taken from a research paper by Herts B et al., [9], as below:
GFR = 70.77-0.444A+0.366W+0.200VR-37.317Cr
Here A is age in years, W is weight in kilograms, VR is mean total volume of kidney in millilitres and Cr is serum creatinine in milligram per decilitre.
We then used the CG [6] and MDRD [7] formulae to calculate GFR in all the subjects.
Statistical Analysis
We used Analysis of Variance (ANOVA) for one-way classification for four samples of Total GFR (eGFR), CG GFR, MDRD GFR, Volume Calculated GFR (VC-GFR). We used a post-hoc test (Tukey’s Honest Statistical Difference (HSD) Test) to compare the four variables to determine which groups in the study sample differ significantly. Pearson’s correlation test was used to find the correlation between the two variables.
Results
In this study we included 61 renal donors comprising 47 females (77%) and 14 males (23%). The age of donors ranged from 27 years to 73 years and estimated GFR ranged from 60.24 mL/min/m2 to 139.85 mL/min/m2 (avge=86.36 mL/min/m2). Average formula-based volume calculated average GFR of study population was 95.73 mL/min [Table/Fig-1,2].
Distribution of study group as per sex.
| Sex | Frequency | Percent |
|---|
| Male | 14 | 22.95% |
| Female | 47 | 77.05% |
| Total | 61 | 100.00% |
Variables measured in subjects.
| Study variable | n | Mean | SD | Median | IQR | Minimum | Maximum |
|---|
| Age (Yrs) | 61 | 49.2 | 11.3 | 49.00 | 16.5 | 27 | 73 |
| CT Renal Vol Rt (cc) | 61 | 124.92 | 23.97 | 126.22 | 28.83 | 75 | 177 |
| CT Renal Vol Lt (cc) | 61 | 126.47 | 23.51 | 125.20 | 35.21 | 70 | 172.9 |
| Total Volume (cc) | 61 | 251.39 | 46.04 | 251.71 | 62.52 | 145 | 341 |
| Diff Volume Rt (%) | 61 | 49.66 | 2.23 | 49.25 | 2.73 | 43.53 | 57.1 |
| Diff Volume Lt (%) | 61 | 50.34 | 2.23 | 50.75 | 2.73 | 42.9 | 56.47 |
| Diff Function Rt (%) | 61 | 49.70 | 3.48 | 50.33 | 4.53 | 41.85 | 58 |
| Diff function Lt (%) | 61 | 50.30 | 3.50 | 49.67 | 4.35 | 42 | 58.15 |
| Rt GFR (mL/min/1.73m2) | 61 | 43.03 | 9.49 | 40.16 | 12.70 | 29.92 | 76.27 |
| Lt GFR (mL/min/1.73m2) | 61 | 43.33 | 9.14 | 41.04 | 11.78 | 29.87 | 67.7 |
| Total GFR(mL/min/1.73m2) | 61 | 86.36 | 17.44 | 80.89 | 20.41 | 60.24 | 139.85 |
| Height (cm) | 61 | 160.26 | 5.42 | 160 | 8 | 150 | 172 |
| Weight (Kg) | 61 | 65.37 | 6.17 | 66.70 | 7.90 | 45 | 78 |
| BMI (kg/m2) | 61 | 25.44 | 2.00 | 25.73 | 2.13 | 18.2 | 29.05 |
| Hb (gm/dL) | 61 | 12.83 | 1.38 | 13.10 | 2.30 | 10.1 | 15.5 |
| S. Creatinine (mg/dL) | 61 | 0.73 | 0.18 | 0.70 | 0.30 | 0.4 | 1.1 |
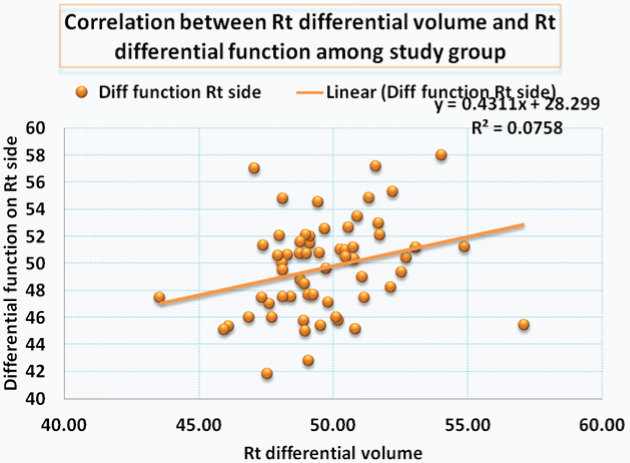
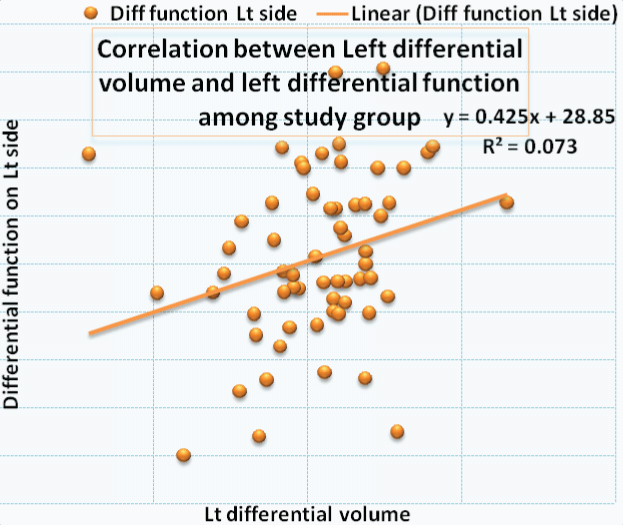
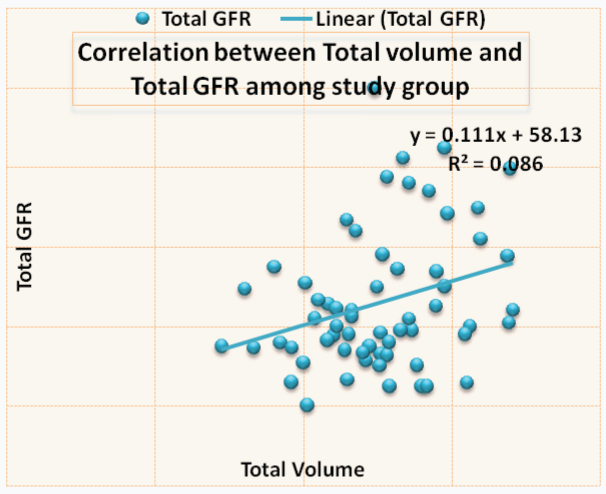
Correlation between the right renal volume and differential function is shown in [Table/Fig-3,4] a significant correlation was noted. [Table/Fig-5,6] shows the correlation between left renal volume and left differential function. Correlation between total GFR and total renal volume is shown in [Table/Fig-7,8]. The Pearson correlation coefficient for the correlation of Total Renal Volume and Total GFR is 0.293 which is significant (p-value=0.022).
Correlation between right renal differential volume and right renal differential function among study group.
| Variable | N | Mean | Std. Dev | Pearson Coefficient | p-value |
|---|
| Diff. Renal Volume Rt | 61 | 49.66 | 2.23 | 0.275 | 0.032 |
| Diff. Renal function Rt | 61 | 49.70 | 3.48 | Correlation is significant |
Plot showing the differential function of right kidneys compared with the differential volume.
Showing the correlation between the left differential volume and function.
| Study Variable | N | Mean | Std. Dev | Pearson Correlation | p-value |
|---|
| Lt Renal Diff Vol | 61 | 50.34 | 2.23 | 0.271 | 0.035 |
| Lt Renal Diff function | 61 | 50.29 | 3.50 | Correlation is significant |
Plot showing correlation between left differential volume and left differential function.
Showing correlation between total GFR and total renal volume.
| Study variable | N | Mean | Std. Dev | Pearson Correlation | p-value |
|---|
| Total Volume | 61 | 251.39 | 46.04 | 0.293 | 0.022 |
| Total GFR | 61 | 86.36 | 17.44 | Correlation is significant |
Showing correlation between total renal volume and total GFR (r=0.293, p=0.022).
Analysis of Variance (ANOVA) was used for one-way classification for four samples of Total GFR (eGFR), Cockcroft-Gault GFR, MDRD GFR, Volume Calculated GFR (VC-GFR) with the null hypothesis as
H0: There is no significant difference of means of differences of GFR [Table/Fig-9]:
Classification of four samples – Total GFR, CG-GFR (Cockcroft-Gault formula calculated GFR), MDRD-GFR (Modification of Diet in Renal Diseases formula calculated GFR), VC GFR (Volume-based calculated GFR).
| Between Subject Factors | |
|---|
| | Value Label | N | Means |
|---|
| Type | 1 | Total GFR | 61 | μ1 |
| 2 | CG GFR | 61 | μ2 |
| 3 | MDRD GFR | 61 | μ3 |
| 4 | VC GFR | 61 | μ4 |
That is H0: μ1 = μ2 = μ3 = μ4
And the alternative hypothesis was defined as:
H1: At least two means are different.
By using the statistical software, Statistical Package for the Social Sciences (SPSS), we obtained the ANOVA which showed the significance value (p-value) was 0.000 (p=0.000) which revealed that we cannot accept the null hypothesis. The alternative hypothesis was then assessed.
The application of a post-hoc test (Tukey’s Honest Statistical Difference Test) gives the results as shown in [Table/Fig-10]. It is clear from above that there is more homogeneity between Total GFR (eGFR) and VC-GFR in comparison to the others (p= 0.096). It was concluded that VC-GFR is closer to Total GFR (eGFR).
Multiple comparisons among– Cockcroft Gault formula calculated GFR, MDRD GFR-Modification of Diet in Renal Diseases formula GFR, VC-GFR – Volume calculated GFR using Herts’ formula) using Tukey-HSD Test.
| Multiple Comparisons: |
|---|
| Tukey HSD(I) Type | (J) Type | Mean Difference (I-J) | Std. Error | Sig. | 95% Confidence Interval |
|---|
| Lower Bound | Upper Bound |
|---|
| Total GFR | CG GFR | 33.5107* | 4.16378 | .000 | 22.7385 | 44.2829 |
| MDRD GFR | -19.5257* | 4.16378 | .000 | -30.2979 | -8.7535 |
| VC GFR | -9.6745 | 4.16378 | .096 | -20.4467 | 1.0977 |
| CG GFR | Total GFR | -33.5107* | 4.16378 | .000 | -44.2829 | -22.7385 |
| MDRD GFR | -53.0364* | 4.16378 | .000 | -63.8086 | -42.2642 |
| VC GFR | -43.1851* | 4.16378 | .000 | -53.9573 | -32.4129 |
| MDRD GFR | Total GFR | 19.5257* | 4.16378 | .000 | 8.7535 | 30.2979 |
| CG GFR | 53.0364* | 4.16378 | .000 | 42.2642 | 63.8086 |
| VC GFR | 9.8513 | 4.16378 | .087 | -.9209 | 20.6235 |
| VC GFR | Total GFR | 9.6745 | 4.16378 | .096 | -1.0977 | 20.4467 |
| CG GFR | 43.1851* | 4.16378 | .000 | 32.4129 | 53.9573 |
| MDRD GFR | -9.8513 | 4.16378 | .087 | -20.6235 | .9209 |
*The mean difference is significant at 0.05 level
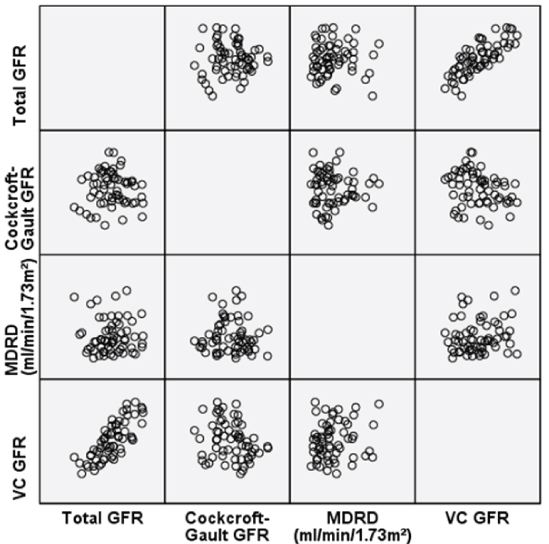
We also analysed the CG-GFR and MDRD calculated GFR’s of the patients and plotted the following scatter diagram which showed a positive correlation between Total GFR (eGFR) and Volume-Calculated-(VC)-GFR(r=0.4727, p=0.00012) [Table/Fig-11].
Showing a scatter plot comparing the relationships of each method of GFR measurement. There is maximum correlation between the VC-GFR and Total-GFR methods of measurement (r=0.4727, p=0.00012).
Discussion
For estimation of GFR in healthy adults, there is no accurate formula as MDRD and CG formulae are meant for patients with CKD [6-8]. Currently available direct methods of assessment of GFR for kidney donors are 24-hour urine creatinine clearance and radio-isotope renogram based GFR estimation. The DTPA renogram method is considered the investigation of choice [5]. Twenty-four-hour urine creatinine clearance method can be used as an alternative to isotope renogram, but it is associated with inherent errors and inability to estimate differential renal function. In this study, we evaluated a formula proposed by Herts B et al., which includes renal parenchymal volume as an independent variable in calculating GFR and we found that volume calculated GFR (VC-GFR) correlates better with estimated GFR (eGFR) than GFR calculated by CG and MDRD formula [9]. The Pearson correlation coefficient (r=0.472) shows positive correlation.
Herts B et al., proposed this formula and applied it on 244 renal donors. They found that correlation between renal volume-based GFR and GFR measured by using 125I-iothalamate clearance was +0.42 [9]. This model outperformed the MDRD equation in six of six measurements. Samuel J et al., did a study on 224 healthy kidney donors determinants and studied the functional significance of renal parenchymal volume in adults and he found that GFR correlated well with renal parenchymal volume (r=0.62) [12]. Donadio C et al., measured renal volume of 66 kidney donors by echo-graphic renal dimensions to predict GFR and found that GFR estimated from renal volume is more accurate than GFR estimated from serum creatinine [13]. Miyazaki C et al., correlated split renal function as depicted by DTPA/SPECT with CT Renal Volume and found strong correlation (r=0.907) [14]. Sharma D et al., performed a correlative study between differential renal function estimated from CT-based functional renal parenchymal volume and 99mTc-DTPA renal scan in 21 patients with unilateral obstructive uropathy and obtained a correlation between differential renal volume and differential renal function in obstructed units (r=0.828, p<0.001) as well as in non-obstructed units (r=0.827, p<0.001) [15]. Ho SS et al., measured kidney volume with multi-detector CT scan in a young Korean population and came to the conclusion that kidney volume predicts estimated GFR significantly (adjusted r2=0.431, F=85.90 and p <0.05) [16]. Morrisroe SN et al., in a study on 33 patients with chronic obstruction, found a strong correlation between differential renal function and differential renal volume in all cases (r=0.90, p<0.001), including in enhanced (r=0.87, p<0.001) and nonenhanced (r=0.95, p <0.001) groups [5]. Correlations were also noted in the less than 40% (r=0.76, p<0.001) and less than 30% (r=0.64, p=0.015) renal function subgroups. Feder MT et al., studied 111 patients between 2005 and 2007 for any correlation between measured renal parenchymal area with computerized tomography and differential function with 99Technetium-mercaptoacetyltriglycine renal scan to ascertain whether CT measurements could predict differential renal function and concluded that differential renal parenchymal area measured by CT strongly correlates with differential function on renal scintigraphy and it may obviate the need for nuclear renal scan in some circumstances [17]. Summerlin AL et al., in a study found split renal function based on 3D CT models may provide a “one-stop” evaluation of both the anatomical and the functional characteristics of the kidneys of living prospective kidney donors [18].
Our results also confirm the above findings of these studies. The VC-GFR has the best correlation with eGFR, and with easy availability of CT Scans, it is a suitable alternative to eGFR.
Limitation
The limitations of our study include a small sample size, the fact that this was a single-centre study, in which experienced nuclear physicians and radiologists were involved in reporting. In future, this study can be the basis of a multi-institutional study to evaluate the Herts formula in a larger number of patients. Potentially, after validation, Herts formula can be used as a method of calculating total and differential GFR in situations where radio-isotope scan is unavailable due to limited access or prohibitive costs.
Conclusion
The present study evaluated the volume-based formula, proposed by Herts et al., for calculation of GFR and found that in healthy adults, this formula is accurate in predicting GFR. Another important aspect of this formula is that individual renal function can also be obtained without the need of isotope renogram, which has poor availability and limited access in some middle- and low-income countries.
*The mean difference is significant at 0.05 level
[1]. Agarwal SK, Srivastava RK, Chronic kidney disease in India: Challenges and solutionsNephron Clin Pract 2009 111(3):197-203.10.1159/00019946019194110 [Google Scholar] [CrossRef] [PubMed]
[2]. Joshi SA, Almeida N, Almeida A, Assessment of the perceived quality of life of successful kidney transplant recipients and their donors pre- and post-transplantationTransplant Proc 2013 45(4):1435-37.10.1016/j.transproceed.2013.01.03723726590 [Google Scholar] [CrossRef] [PubMed]
[3]. Sakhuja V, Kumar V, Spouses as kidney donors in India: Trends and outcomesIndian J Nephrol 2014 24(1):1-2.10.4103/0971-4065.12504324574622 [Google Scholar] [CrossRef] [PubMed]
[4]. Gopalakrishnan G, Gourabathini SP, Marginal kidney donorIndian J Urol 2007 23(3):286-93.10.4103/0970-1591.3372619718332 [Google Scholar] [CrossRef] [PubMed]
[5]. Morrisroe SN, Su RR, Bae KT, Eisner BH, Hong C, Lahey S, Differential renal function estimation using computerized tomography based renal parenchymal volume measurementJ Urol 2010 183(6):2289-93.10.1016/j.juro.2010.02.02420400144 [Google Scholar] [CrossRef] [PubMed]
[6]. Cockcroft DW, Gault MH, Prediction of creatinine clearance from serum creatinineNephron 1976 16(1):31-41.10.1159/0001805801244564 [Google Scholar] [CrossRef] [PubMed]
[7]. Klahr S, Levey AS, Beck GJ, Caggiula AW, Hunsicker L, Kusek JW, The effects of dietary protein restriction and blood-pressure control on the progression of chronic renal diseaseN Engl J Med 1994 330:877-84.10.1056/NEJM1994033133013018114857 [Google Scholar] [CrossRef] [PubMed]
[8]. Florkowski CM, Chew-Harris JSC, Methods of estimating GFR-different equations including CKD-EPIClin Biochem Rev 2011 32:75-79. [Google Scholar]
[9]. Herts B, Sharma N, Lieber M, Freire M, Goldfarb DA, Poggio ED, Estimating glomerular filtration rate in kidney donors: A model constructed with renal volume measurement from donor CT scansRadiology 2009 252:109-16.10.1148/radiol.252108187319435940 [Google Scholar] [CrossRef] [PubMed]
[10]. Dixit V, Calculation of glomerular filtration rate using renal volume in kidney donors using Herts’ formulaJ Urology 2016 195(4):e43310.1016/j.juro.2016.02.1310 [Google Scholar] [CrossRef]
[11]. Russell CD, Bischoff PG, Kontzen FN, Rowell KL, Yester MV, Lloyd LK, Measurement of glomerular filtration rate: Single injection plasma clearance method without urine collectionJ Nucl Med 1985 26:1243-47. [Google Scholar]
[12]. Samuel J, Rishi R, Andone A, Khawandi W, Al-Said J, Gletsu-Miller N, Determinants and functional significance of renal parenchymal volume in adultsClin J Am Soc Nephrol 2011 6:70-76.10.2215/CJN.0003011020847095 [Google Scholar] [CrossRef] [PubMed]
[13]. Donadio C, Abdelkawy H, Grassi G, Echographic renal dimensions can predict glomerular filtration rate of potential living kidney donorsTransplantation Proceedings 2010 42:1035-39.10.1016/j.transproceed.2010.03.03920534217 [Google Scholar] [CrossRef] [PubMed]
[14]. Miyazaki C, Harada H, Shuke N, Okizaki A, Miura M, Hirano T, 99mTc-DTPA dynamic SPECT and CT volumetry for measuring split renal function in live kidney donorsAnn Nucl Med 1999 24:189-95.10.1007/s12149-010-0349-y20213340 [Google Scholar] [CrossRef] [PubMed]
[15]. Sharma D, Barua SK, Rajeev TP, Baruah SJ, Correlation between differential renal function estimation using CT-based functional renal parenchymal volume and 99mTc - DTPA renal scanIndian J Urol 2012 4:414-17.10.4103/0970-1591.10575323449624 [Google Scholar] [CrossRef] [PubMed]
[16]. Ho SS, Chung BH, Lee SU, Kim WJ, Ha HL, Yang CW, Measurement of kidney volume with multi-detector computed tomography scanning in young KoreansYonsei Med J 2009 2:262-65.10.3349/ymj.2009.50.2.26219430561 [Google Scholar] [CrossRef] [PubMed]
[17]. Feder MT, Blitstein J, Mason B, Hoeing DM, Predicting differential renal function using CT measurements of renal parenchymal areaJ Urol 2008 180(5):2110-15.10.1016/j.juro.2008.07.05718804236 [Google Scholar] [CrossRef] [PubMed]
[18]. Summerlin AL, Lockhart ME, Strang AM, Kolettis PN, Fineberg NS, Smith JK, Determination of split renal function by 3D reconstruction of CT angiograms: a comparison of gamma camera renographyAm J Roentgenol 2008 191:1552-58.10.2214/AJR.07.402318941100 [Google Scholar] [CrossRef] [PubMed]