Excess body fat adiposity identification using body mass index is not a direct measure of body fat, or lean tissue, it is the most commonly used indicator of health risks associated with overweight although, it has several limitations especially in individuals or populations who have very long or very short legs relative to torso length [1-3]. The bioelectrical impedance technique has been suggested as an alternative measurement to curivate these difficulties. Equations for estimating Fat Free Mass (FFM) and body fat using this tool, with appropriate cross-validation, have been developed in adults [4].
Major components of stature were proved to help in assessment of the antecedents of disease, morbidity and death in adulthood. Human leg length, sitting height and their proportions, are associated with epidemiological risk for overweight, coronary heart disease, diabetes, liver dysfunction and certain cancers [5]. There is also wide support for the use of relative leg length as an indicator of the quality of the environment for growth during infancy, childhood and the juvenile years of development [6]. The leg length index is a marker of early life nutrition, growth and development. Inadequate nutrition early in life may interact with the increased risk for diabetes later in life. A low leg length index is associated with increased body fat when compared with those with high leg length index [7]. Individuals from developed societies have shown that those with short legs relative to height have higher risk of type 2 diabetes [8]. In less developed populations, influences on relative leg length and diabetes may differ. Differences in leg length are associated with significant differences in the components of the metabolic syndrome such as glucose intolerance, insulin resistance and hypertension [9,10].
Growth and nutritional status have been associated with Blood Pressure (BP) in numerous studies, however the direction of the associations may vary at different ages [11-13]. For example, greater fetal growth, as indexed by birthweight, is associated with reduced BP later in life [14]. This contrasts with later ages, where greater BMI is associated with increased BP [15].
Studies have reported positive associations of Fat Mass (FM), its regional distribution and abdominal obesity with BP [1,16]. Moreover, Lean Mass (LM) has also been associated with BP variability, and the sex-differences in BP disappeared if adjustment was made for LM [11]. The association between height and BP appears complex. Leg length, suggested to be a sensitive indicator to predict coronary heart disease risk better than Sitting Height (SH), with longer legs associated with lower BP [17]. The aim of this study was to evaluate the impact of relative leg length on the presence of hypertension and prediabetes or type 2 diabetes in a sample of Egyptian adults.
Materials and Methods
This was a cross-sectional analysis of 4308 Egyptian adult individuals of both sexes (2094 women and 2214 men) aged between 20 and 75 years. In 2010, a team from the National Research Centre of Egypt initiated a community-based cross-sectional survey for establishing comprehensive anthropometric measurements for the dimensions of the Egyptian human body to be used for obtaining the standards needed for the Egyptian clothing industry. The study sample in this survey included 8250 adult individuals of both sexes, aged 20-75 years. Individuals who participated in this study, were part of the study sample of a project entitled ‘Standardisation of adult Egyptian dimensions for implementation in development of clothing industries’ (1256).
The participants represented different geographic localities and different social classes. The sample was selected from the cities of Greater Cairo, Alexandria, and El Mehala, representing Lower Egypt and El Fayoum, Banysouif, and El Menia, representing Upper Egypt. The survey included individuals working in government organisations, those working in factories, and those attending social clubs.
The study was performed to evaluate the presence of prediabetes or type 2 diabetes and hypertension in relation to the leg length index. The study design was approved from an ethical committee board of the National Research Centre of Egypt (No. 09/038). Informed written consent was obtained from all participants.
All participants completed a questionnaire that included personal, socioeconomic, demographic, and medical data. Persons with chronic diseases or on medical treatment were excluded from the study. Anthropometric measurements including height, weight, mid upper arm circumference, thigh circumference, waist circumference, and hip circumference were taken by practitioners.
Height was measured in the standing position using fixed stadiometers (Seca, Japan). Sitting height was measured to the nearest 0.1 cm, with the subject seated on a flat-topped stool of known height, buttocks adjacent to the wall and head in the Frankfort plane. Body weight was measured in light clothing to the nearest 0.1 kg. Mid upper arm circumference was measured at the midpoint between the acromion process and the olecranon. Thigh circumference was measured directly below the gluteal fold of the right thigh. Waist circumference was measured at the midpoint between the lower rib margin and the iliac crest, with the participant standing at the end of normal expiration. Hip circumference was measured at the level of the greater trochanters with the individual wearing minimum clothing. Non-stretchable tape was used for measurement of the four circumferences. The mean of three consecutive measurements of each anthropometric measure was evaluated using standardised equipment and following the recommendations of the International Biological Program [18]. Body mass index was calculated as weight (kg) divided by height (m) squared. The Waist to Hip Ratio (WHR) was calculated. Leg length and leg length index (%) were derived by computation: Leg length (cm) = Height − sitting height. Leg length index (%) = (leg length/height)*100.
The participants were then classified into two groups of leg length index according to established cut-offs by Frisancho AR [7]: a Low leg length index = Z score < −1.036, the age and sex-specific reference of leg length index and a High leg length index = Z score > 1.036 the age and sex-specific reference of leg length index. Body composition was measured using the Tanita BC-418 MA Segmental Body Composition Analyser (Tanita, Japan). It prints out a complete bodycomposition profile including weight, BF%, body fat mass and BMI, and visceral fat rating, in which the rate from 1 to12 indicates a healthy level of visceral fat and that from 13 to 59 indicates an excess level of visceral fat [19,20].
Systolic and diastolic blood pressures were measured in the sitting position using a standard mercury sphygmomanometer with appropriate cuff sizes after a 5-minutes rest period. Two blood pressure readings were averaged, and the average was used for analyses. According to the Seventh Report of the Joint National Committee on Prevention, Detection, Evaluation, and Treatment of High Blood Pressure (JNCVII) criteria [21] hypertension was defined as systolic blood pressure ≥140 mmHg and/or diastolic blood pressure ≥90 mmHg, or current use of anti-hypertensive medication; pre-hypertension was if the systolic blood pressure was 120 to 139 mmHg and/or diastolic blood pressure was 80 to 89 mmHg; and normal was if the systolic blood pressure was <120mmHg and diastolic blood pressure was < 80 mmHg [22].
Serum glucose levels were measured after an 8 hours fasting by the glucose oxidase peroxidase method using an enzymatic colorime trickit (Biodiagnostic kit, Egypt) according to the Trinder method [23].
We excluded participants with missing information that was needed to ascertain diabetes status and hypertension. We excluded cases that were less than 20-year-old and above 75-year-old.
Data were analysed using SPSS for Windows (version 17; SPSS Inc., Chicago, Illinois, USA). The Kolmogorov–Smirnov test was used to check for normality in the continuous variables. Quantitative variables are presented as mean±SD. The analysis of variance test was used to compare groups. All post-hoc comparisons were made using t-tests with Bonferroni adjustment. Significance was assumed for p-values less than 0.05. In additional analyses, we used linear regression to assess leg length index in relation to diabetes and hypertension.
Results
The characteristics of the sample of the individuals (2094 females and 2214 males) aged 20-75 years are described in [Table/Fig-1]. The mean age of the studied group was 38.69±12.18 years in males and 41.44±12.26 years in females. The mean value of both leg length and leg index was significantly higher in males compared to females. There were significant sex-differences for most anthropometric measures and body composition, but not for age.
The characteristics of the studied individuals.
| Males n=2214 | Females n=2094 | p |
|---|
| Variables | Mean±S.D | Mean±S.D | |
| Age (years) | 38.69±12.18 | 41.44±12.26 | 0.83 |
| Regional obesity |
| MUAC (cm) | 30.87±3.58 | 32.80±4.77 | 0.01 |
| Waist C. (cm) | 98.31±12.53 | 92.07±11.12 | .02 |
| Thigh C. (cm) | 53.93±7.51 | 57.12±8.31 | 0.01 |
| Leg Length (cm) | 83.21±5.2 | 74.98±4.93 | 0.001 |
| Body proportions |
| WHR | 0.92±0.07 | 0.82±0.249 | 0.43 |
| Leg Length index | 48.63±1.934 | 47.30±2.036 | 0.02 |
| Body composition |
| BMI(kg/m2) | 28.58±5.17 | 31.80±6.55 | 0.024 |
| Fat% | 24.73±6.63 | 39.14±7.19 | 0.002 |
| Visceral fat rating | 9.67±5.45 | 8.46±4.08 | 0.005 |
MUAC: Mid Upper Arm Circumference; C. Circumference; WHR: Waist Hip Ratio; BMI: Body Mass Index
Comparison of anthropometric parameters in both sexes according to leg length index showed that individuals with short leg length and low leg length index had significantly greater MUAC, waist and thigh circumferences compared with those with long leg length and high leg length index. Also, BMI and fat % and visceral fat rating were increased in both females and males with shorter legs. A low leg length index was associated with increased body fat [Table/Fig-2].
Comparison of anthropometric parameters in both sexes according to leg length index.
| Males | p | Females | p |
|---|
| Leg length index categories | Leg length index categories |
|---|
| Low | High | Low | High |
|---|
| Regional obesityMUAC (cm)Waist C. (cm)Thigh C. (cm) | 31.09±3.60 | 30.50±3.57 | 0.026 | 33.51±5.11 | 32.15±4.80 | 0.02 |
| 98.74±12.68 | 97.40±12.88 | 0.045 | 92.37±11.48 | 91.24±11.03 | 0.04 |
| 54.58±8.02 | 53.38±7.09 | 0.004 | 58.87±9.28 | 55.81±7.96 | 0.01 |
| Body proportionsWHRLeg Length index | 0.91±0.07 | 0.92±0.07 | 0.066 | 0.83±0.40 | 0.83±0.38 | 0.835 |
| 46.169±0.741 | 51.32±1.56 | 0.018 | 44.653±1.736 | 49.96±1.35 | 0.038 |
| Body compositionBMI(kg/m2)Fat%Visceral fat rating | 29.91±5.24 | 27.19±4.66 | 0.03 | 33.68±7.13 | 30.36±6.28 | 0.02 |
| 25.92±6.66 | 32.32±6.39 | 0.02 | 40.01±7.45 | 38.21±7.45 | 0.02 |
| 10.53±5.31 | 8.62±5.31 | 0.02 | 9.21±4.48 | 7.82±3.83 | 0.03 |
| Leg Length(cm) | 77.61±3.23 | 88.88±4.708 | 0.01 | 69.60±4.23 | 80.35±4.12 | 0.001 |
MUAC: Mid Upper Arm Circumference; C. Circumference; WHR: Waist Hip Ratio; BMI: Body Mass Index.
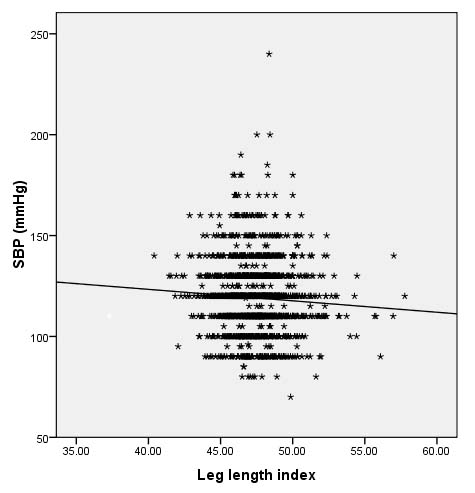
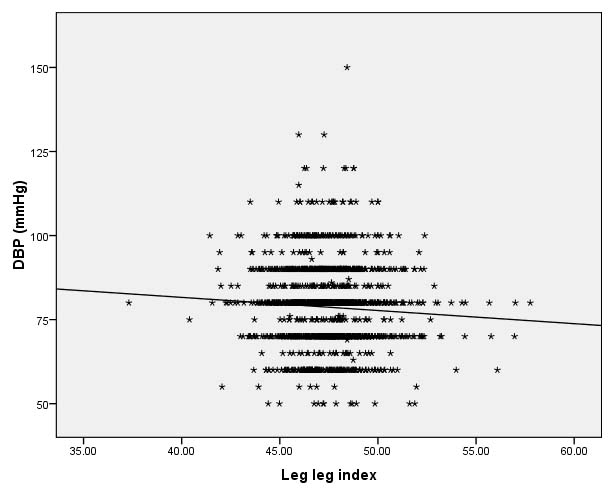
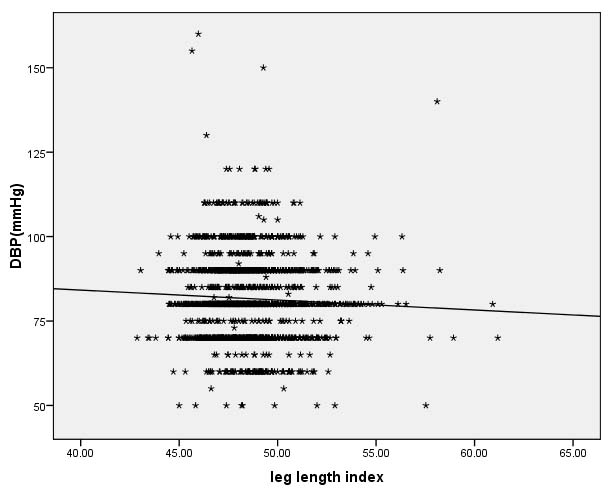
Correlation of leg length index to regional obesity, body composition and blood pressure levels, showed significant negative correlation of leg length index with Systolic Blood Presure (SBP) and Diastolic Blood Presure (DBP) in females i.e., cases with low relative leg length had high SBP and DBP [Table/Fig-3,4], males showed significant negative correlation with DBP only [Table/Fig-5]. Also, there was significant negative correlation between the leg length index and BMI, Fat%. As regards anthropometry, MUAC in both males and females showed significant negative correlation with leg length index. There was a significant negative correlation of leg length index and thigh circumference in females only. Moreover, there was significant positive correlation of leg length index and waist circumference in females only [Table/Fig-6].
Correlation between systolic blood pressure and leg length index in females.
Correlation between diastolic blood pressure and Leg length index in females.
Correlation between diastolic blood pressure and Leg length index in males.
Correlation of leg length index to regional obesity, body composition and blood pressure levels.
| Males | Females |
|---|
| r | p | r | p |
|---|
| Regional obesity |
| MUAC(cm) | -0.057 | 0.008 | -0.100 | 0.000 |
| Waist C. | -0.031 | 0.153 | 0.047 | 0.045 |
| Thigh C. | -0.037 | 0.087 | -0.103 | 0.000 |
| Body proportions |
| WHr | 0.013 | 0.544 | 0.016 | 0.494 |
| Body composition |
| BMI | -0.175 | 0.001 | -0.172 | 0.001 |
| Fat% | -0.129 | 0.001 | -0.083 | 0.001 |
| Blood pressure |
| SBP | -0.014 | 0.518 | -0.069 | 0.004 |
| DBP | -0.050 | 0.020 | -0.067 | 0.005 |
MUAC: Mid Upper Arm Circumference; C: Circumference; WHR: Waist Hip Ratio; BMI: Body Mass Index; SBP: Systolic Blood Pressure; DBP: Diastolic Blood Pressure.
Hypertension was more prevalent in women with low leg index (12.1%) than women with high leg length (10.2%) with statistical significant difference (p=0.001). Also, the same was observed inmales. Hypertension was more prevalent in males with low leg index (15.4%) than males with high leg length (12.4%) with statistical significant difference (p=0.002) [Table/Fig-7].
Frequency of hypertension & diabetes according to leg length index in males & females.
| Sex | HT % | p | Prediabetes | | DM | p |
|---|
| Males |
| Low leg index | 15.4% | 0.002 | 29.9% | 0.07 | 22.4% | 0.08 |
| High leg index | 12.4% | 31.6% | 18.4% |
| Females |
| Low leg index | 12.1% | 0.001 | 45.5% | 0.08 | 14.8% | 0.06 |
| High leg index | 10.2% | 39.8% | 13.3% |
HT: Hypertension; DM: Diabetes Mellitus
No statistical significant difference was observed between women with low leg index and prediabetes and diabetes (45.5% and 14.8% respectively). In males with low leg index, 22.4% had diabetes with no statistical difference.
Discussion
The current study shows that the mean value of both leg length and leg index is higher in males compared to females. This result is in agreement with the study which reported that females exhibited relatively shorter legs than males [5].
Leg length and proportion is an important sign of health [6]. Our findings observed that a low leg length index is associated with increased body fat when compared with those with high leg length index. This is the same results that were observed by several studies who reported that a low leg length index is associated with significantly greater amount of body fat [7,8,24]. Short legs alter the regulation of physiologic mechanisms responsible for energy balance, resulting in excess adiposity [8].
Several previous studies have shown inverse associations of leg length with BP [17,25,26]. Our results show that leg length index was inversely associated with BP; however, the associations varied between sexes. In males, leg length index was negatively associated with DBP only, while in females, leg length index was negatively associated with both DBP and SBP. This is in agreement with the study who concluded that short leg length is associated with increased SBP, but not DBP, in middle-aged men and women [25]. In disagreement with our observation, Montagnese C et al., concluded that leg length was inversely associated with SBP and DBP in males, with a similar trend evident in females [17]. It is possible that this reflects differences in physical activities between the sexes, with many older males maintaining high activity levels. Also, it may also indicate difference in quality of the environment for growth during infancy, childhood and the juvenile years of development.
Our study did not find a significant association between low leg length index and higher prevalence of prediabetes or diabetes in the studied sample. This is in contrary to the study done by Mueller NT et al., who reported that short legs relative to height are positively associated with diabetes [8]. The association between relative leg length and type 2 diabetes exists in both less and more affluent societies, in which the individuals of relative leg length may be different [27]. More research is thus needed to shed light on the potential causal factors driving this observation.
Finally, the study emphasises the potential correlation between leg length and leg length index, anthropometric parameters, and hypertension among Egyptians. The study suggests that the analysis of both anthropometric measurements and body composition might be clinically important for the estimation of risk factors for chronic diseases.
Limitation
Limitations of this study include the absence of biochemical analyses including serum lipids and other metabolic parameters. Moreover, leg length was calculated as the difference between standing and sitting height, each of which has its own variances.
Conclusion
Low leg length index is associated with increased body fat. Leg length index was inversely associated with BP, however the associations varied between sexes. In males, leg length index was negatively associated with DBP only, while in females, leg length index was negatively associated with both DBP and SBP. Thus, both leg length and leg length index can be used as anthropometric determinants for health risks that related to diabetes and cardiovascular disease among Egyptians.
MUAC: Mid Upper Arm Circumference; C. Circumference; WHR: Waist Hip Ratio; BMI: Body Mass Index
MUAC: Mid Upper Arm Circumference; C. Circumference; WHR: Waist Hip Ratio; BMI: Body Mass Index.
MUAC: Mid Upper Arm Circumference; C: Circumference; WHR: Waist Hip Ratio; BMI: Body Mass Index; SBP: Systolic Blood Pressure; DBP: Diastolic Blood Pressure.
HT: Hypertension; DM: Diabetes Mellitus