Image processing is a process which is used to derive information from the images. Image processing is mainly used to determine the pixel variations in the image for analysis, classification and identification of objects or regions. In image processing, histogram of an image can be described as histogram of intensity values of pixels. Histogram is the graphical representation of pixels in an image to every different intensity value defined in that image. For colour Red, Green and Blue (RGB) images, histogram can be determined based on the RGB channels of the images. Histogram can be used for various image processing applications. In pre-processing, histogram is used to equalise the intensity of the pixels. Segmentation based on histogram is possible and defined to be effective. Histogram based features such as entropy; kurtosis and skewness are obtained from the histogram of the image with the pixel intensities. These features from the histogram are mainly used for classification and determination of various regions in an image for further identification and analysis [1].
Statistical features were mainly used to analyse the effectiveness of determining the region of pixels in an image. These features are probability based statistical values for description of any object or region of interest. Statistical features like mean, standard deviation and variance defines the state of pixel intensities with the help of probabilistic occurrences. Histogram and statistical based features of skin tumours are derived to differentiate the two different dermal images [2]. In this study, statistical and histogram features of skin tumours were analysed to detect the skin tumour types.
Chan CH etal., described the use of histogram and statistical based features for the face recognition. Structured based parts of the face such as eye, ear and nose are determined based on the histogram and statistical features. Entire Face recognition can be carried out with the help of these features [1]. Malathi G and Shanthi V, described use of histogram for classification of 11 ultrasound images of placenta. Histogram is used for the clear description and detection of placenta [2].
The objective of this paper was to diagnose skin tumours with the help of certain easily definable statistical features and histogram functions. In this process, two types of dermal images from the database were categorised. Classification of benign and malignant skin tumours were carried out with the help of Support vector machines. The present study differentiates the two dermal images with the features considered. Statistical and histogram based features described the pixel values of the image for differentiation and identification.
Materials and Methods
In the present study, the dermal images of two different categories such as Melanocytic nevi and Melanoma were obtained from the authorised PH2 database. PH2 is a dermoscopic image database acquired at the Dermatology Service of Hospital Pedro Hispano, Matosinhos, Portugal (https://www.fc.up.pt/addi/ph2%20database.html). The dermoscopic images in the database were obtained from the patients of Dermatology Service of Hospital Pedro Hispano (Matosinhos, Portugal) with the help of Tuebinger Mole Analyser system using a magnification of 20X. They are 8-bit RGB colour images with a resolution of 768x560 pixels. In this study, 100 dermal images were considered with 50 melanocytic nevi and 50 malignant melanoma images.
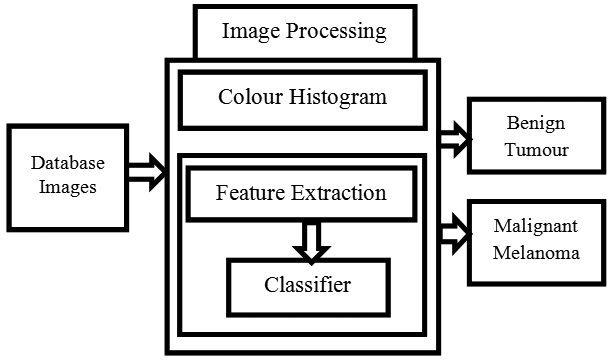
PH2 image database contains a total of 200 dermoscopic images of patients with melanocytic lesions, including 80 common nevi, 80 atypical nevi and 50 melanoma. The image database possesses ethical clearance approval for the dermal images obtained from the Dermatology Service of Hospital Pedro Hispano, Matosinhos, Portugal. The methodology of the study is described below in the [Table/Fig-1].
Methodology for Identification of skin tumours.
A. Colour Histogram
Colour histogram is defined as continuous colour distribution in an image. In general, colour histogram of a digital image represents the number of pixels with colours in each of a fixed colour ranges. The colour histogram can be more often used for any three-dimensional spaces like RGB or HSV. They describe the statistical distribution and essential tone of colours in an image [3].
B. Dilation and Erosion
Dilation and Erosion were performed for the removal of hair cells from dermal images. In this process, hair cells were processed by morphological operations such as dilation and erosion. This enhances better segmentation of lesion by adding and removing pixels for extraction of statistical and histogram functions. Dilation operation is shown in the equation (1) with f(x) as image function and b(x) as structuring function in Euclidean space (E) [4].

In Erosion, f(x) is defined as the image function with the structuring element b(x) in Euclidean space (E) which is described in equation (2).

C. Segmentation
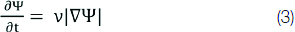
Image segmentation is considered as the most important technique in Image processing. There are different types of image segmentation for identifying the pixels of interest in an image. Segmentation technique was applied to separate the lesion from the background [5]. The most accurate segmentation process used for the separation of irregular dimensional pixel objects from the background is contour segmentation [6]. This segmentation is best suitable for dermal images. In this study, contour based level set segmentation was used that describes the lesion pixels from the dermal images. In this, a contour function is defined for the lesion structures in the pre-processed dermal images. Superimposition burning of the binary image over the original image derives the lesion without any background. Contour algorithm is defined below in equation (3) with Ψ as contour function.
D. Statistical and Histogram Based Features
Statistical features define the parameters of texture, probability distribution and asymmetry measures in the form of statistical values which includes entropy, kurtosis and skewness. Histogram based features are obtained from the gray level histogram of the lesions in the dermal images [7]. These histogram based statistical features include standard deviation and variance in this methodology. Histogram defines the dark gray level pixel values of the lesion in a well-defined manner so statistical nature of histogram from the lesion is analysed in detail [8]. Statistical values obtained from lesion of dermal images define the energy, texture and asymmetry of the image lesions. Thus, Statistical and Histogram based features are derived from the lesion of the dermal images are used for identification of different skin tumours.
Entropy is a statistical form of randomness to characterise the texture of the image which is shown in equation (4)

Kurtosis can be defined as the probability distribution measure of a real value random variable. This is a descriptor of the shape of a probability distribution. Kurtosis is shown in the equation (5) with μ as mean [9].

Skewness is asymmetry measure of probability distribution of a real value random variable over its mean [9]. The skewness values can be positive or negative or undefined which is shown in equation (6) with average mean as μ.

Standard deviation (σ) is a used to determine variation or dispersion measure of a set of data values and is shown in the equation (7) where, μ is mean; pi is the number of probabilities from p1, p2… pN.

Variance is the expectation of the squared deviation of a random variable from its mean. In general, it determines the spread out of set of random numbers from their average value. Variance with μ as mean is shown in equation (8)

Based on these colour histogram of RGB images and statistical feature values from the segmented lesions, the two different categories of skin tumour images were categorised.
E. Classification
Neural network can be defined as part of artificial intelligence which possesses units similar to neurons in biological systems arranged in layers. These are capable of converting any input into output. An input is considered by each unit to which a function is applied and later passes the output to the next layer. Neural network may comprise N-layers based on the number of inputs. With these layers classification process of various patterns and structures are performed [10]. Back Propagation Neural network (BPN) is one of the neural network classifier with hidden layers is mainly designed for complex pattern recognition in different structures. Backward flow of the error signals is computed for each output unit to the input unit which improves the detection of patterns and structures [11].
Thus the dermal images are pre-processed with help of morphological operation like dilation and erosion to remove the hair cells. The images of two different categories such as benign and malignant melanoma undergo contour segmentation process to separate the lesion from the background of image. From these segmented lesion image structures different statistical and histogram based statistical features. Statistical features such as Entropy, Kurtosis, Skewness and histogram based statistical features of dermal lesion images such as Standard Deviation (STD), Variance are derived [12]. Further to enhance the identification process, neural network classifiers are used. This process of classification defines that the statistical and histogram based features classify the dermal images at a high accuracy [13]. Classification of skin tumours was carried out for the entire feature set of 100 dermal images taken into consideration in which 60, 10 and 30 dermal images were defined for training, validation and testing respectively. Confusion matrix was obtained for determination of efficiency. With these values, the two different categories of melanocytic nevi (moles) and malignant melanoma were identified.
Results
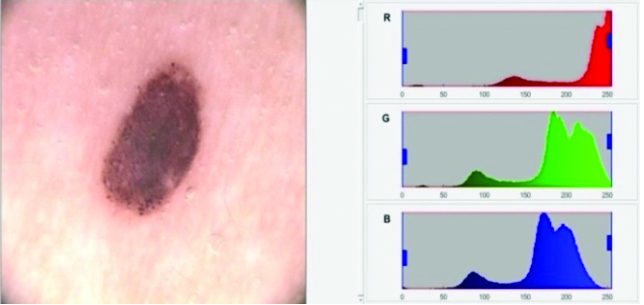
Colour histogram of Melanocytic Nevi (moles) and malignant melanoma is shown in the [Table/Fig-2a,b] respectively describing the RGB colour range of pixels in the image. Colour pixels of the image are represented graphically for the lesion identification. The pixels of lesion regions are defined at the end of the histogram in Melanocytic nevi and these regions are described at the centre for malignant melanoma.
Colour histogram of melanocytic nevi (moles).
Colour histogram of malignant melanoma.
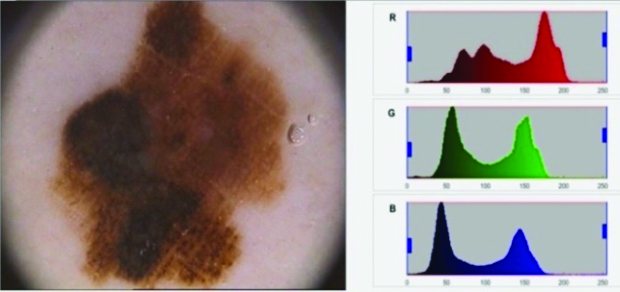
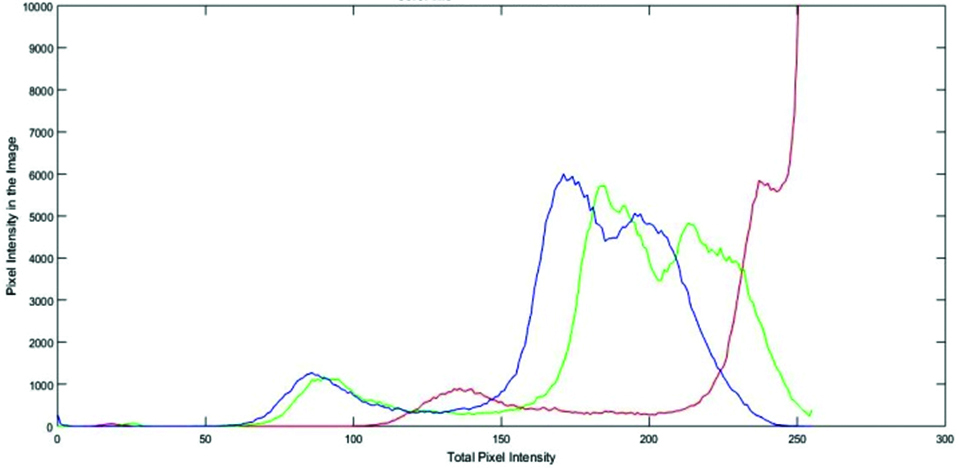
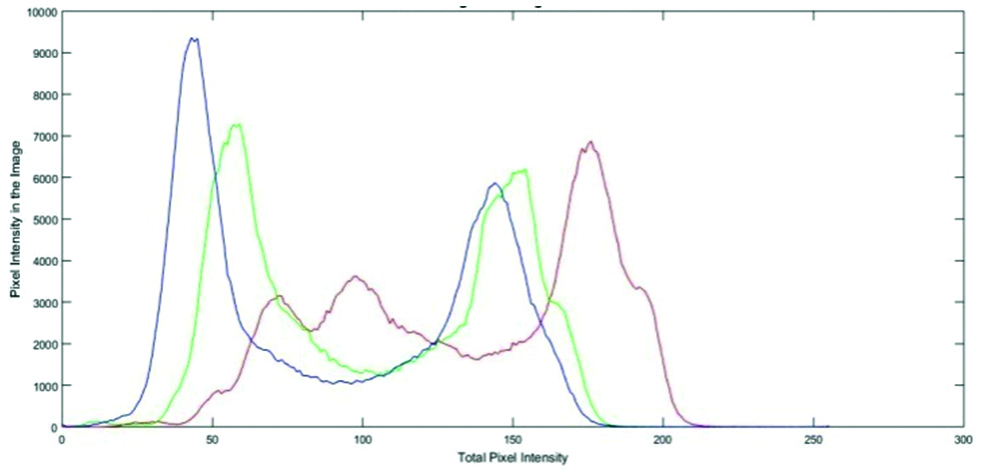
Colour histogram configures the nature of the lesion based on the intensity of the colour pixels. Graphical representation of colour pixel intensity is defined below for both Melanocytic Nevi (moles) and malignant melanoma in [Table/Fig-3a,b] respectively. Colour histogram for the moles were defined by the RGB pixel intensity spread with high peaks at one extreme end. For the malignant melanoma, high peaks were seen in both the extreme ends. Variations in the colour histogram determine the nature of the skin lesion. Intensity of RGB pixels in the images are defined graphically to categorise the skin lesion types.
Graphical representation of colour histogram of melanocytic nevi (moles).
Graphical representation of colour histogram of malignant melanoma.
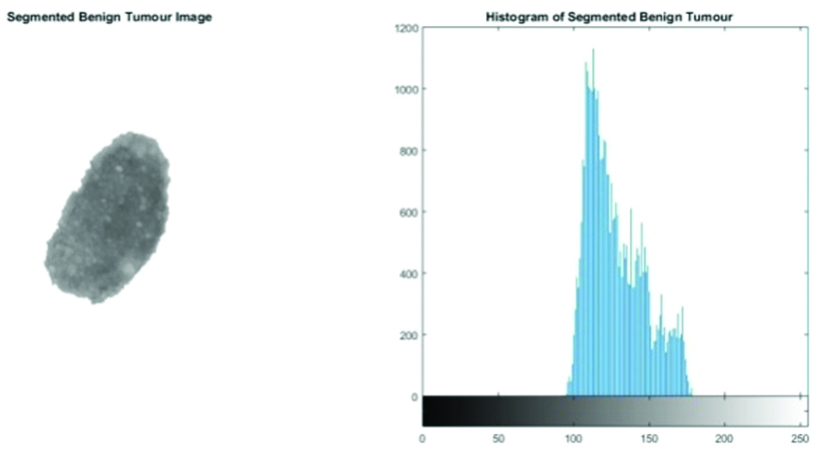
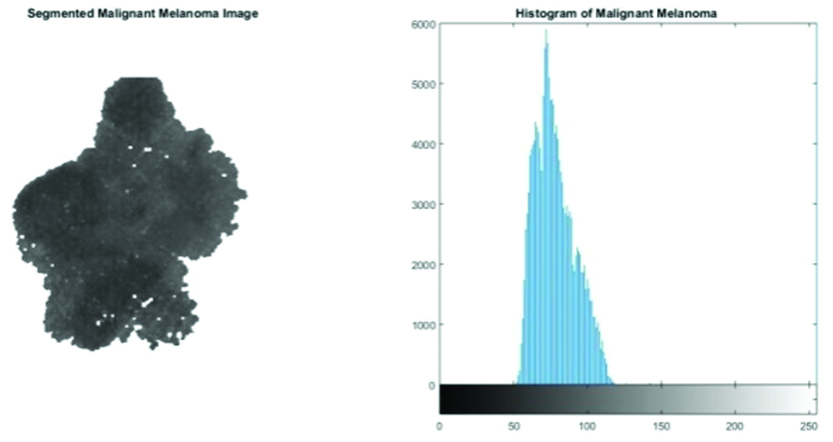
Skin lesions from the dermal images were segmented with the help of contour description. Histogram for the segmented lesions in the grayscale level was obtained. Segmented lesions of benign and malignant melanoma along with the gray level histogram are shown in the [Table/Fig-4a,b] which illustrates that the lesion pixels were widely spread for moles and narrow for the malignant melanoma compared to the moles.
Segmented lesions with gray level histogram of melanocytic nevi (moles).
Segmented lesions with gray level histogram of malignant melanoma.
Statistical and histogram based statistical features obtained from the segmented lesions of two different dermal images were analysed with the mean and standard deviation values. Graphical representation of mean values of the statistical and histogram based features are shown in [Table/Fig-5] in which moles possess low range of mean values. The mean values are stated in the [Table/Fig-6]. In this table, the mean of the moles were significantly low and malignant melanoma were high that specifically differentiates the two types of skin lesions. The p-value in the table defines that the mean of the statistical and histogram based features of two different skin tumours were significant.
Graphical Representation of mean of statistical and histogram based features.
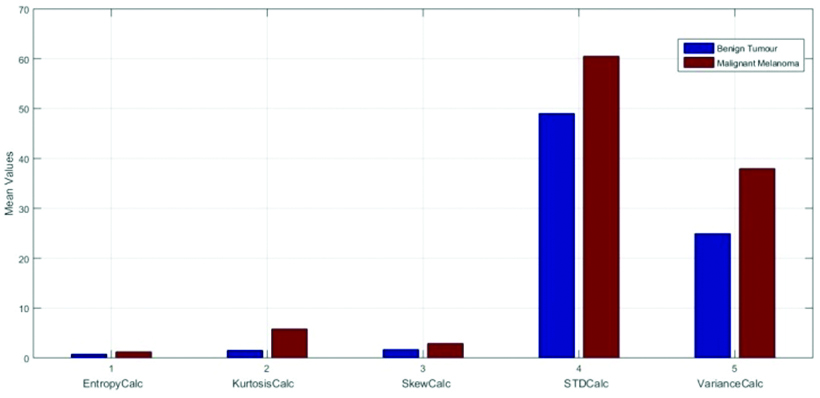
Mean values of statistical and histogram based features.
| Mean | Category | Statistical and Histogram based features |
|---|
| Entropy | Kurtosis | Skewness | StandardDeviation | Variance | p-value |
|---|
| BenignTumour | 0.755 | 2.512 | 1.689 | 49.023 | 24.93 | <0.0001 |
| MalignantMelanoma | 1.214 | 5.791 | 2.896 | 60.506 | 37.97 | <0.0001 |
Graphical representation of standard deviation values of the statistical and histogram based features are shown in [Table/Fig-7] which defines that malignant melanoma possess high range of standard deviation values. The values are described in the [Table/Fig-8] which illustrates that Standard Deviation (SD) was high for malignant melanoma and low for moles. Thus, standard deviation of statistical and histogram based features categorise the two different types of skin lesions. In this table, p-value was significant for statistical and histogram based features obtained from the lesions.
Graphical Representation of standard deviation of statistical and histogram based features.
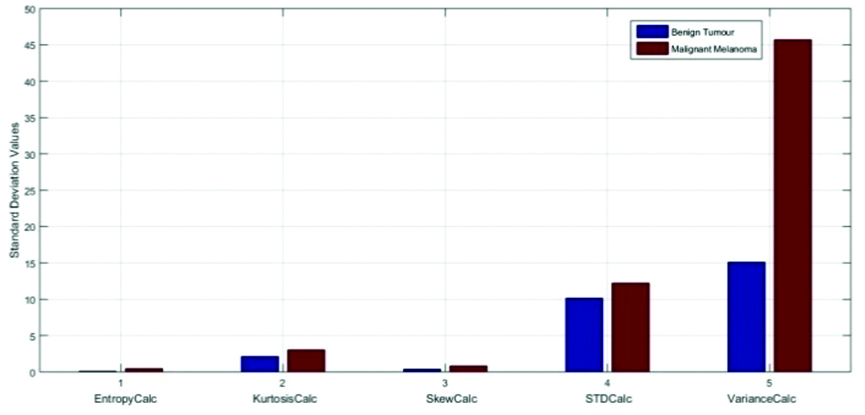
Standard deviation values of statistical and histogram based features.
| StandardDeviation | Category | Statistical and Histogram based features |
|---|
| Entropy | Kurtosis | Skew | StandardDeviation | Variance | p-value |
|---|
| BenignTumour | 0.1084 | 2.1232 | 0.3726 | 10.148 | 15.104 | <0.0001 |
| MalignantMelanoma | 0.4483 | 3.0359 | 0.8125 | 12.225 | 45.704 | <0.0001 |
The variations in Colour Histogram and mean, standard deviation values of Statistical and histogram based features of two different categories of dermal images differentiates it more accurately. Classification process with the help of the feature values defines the confusion matrix. Confusion matrix of a classifier defines the accuracy and efficiency of the classification of two different types of skin tumours is shown in the [Table/Fig-9]. Four different Confusion matrixes define the training, testing, validation and overall percentage of classification of skin tumours. Each matrix explains the accuracy of classification based on the target and output classes.
Confusion matrix of neural network classification.
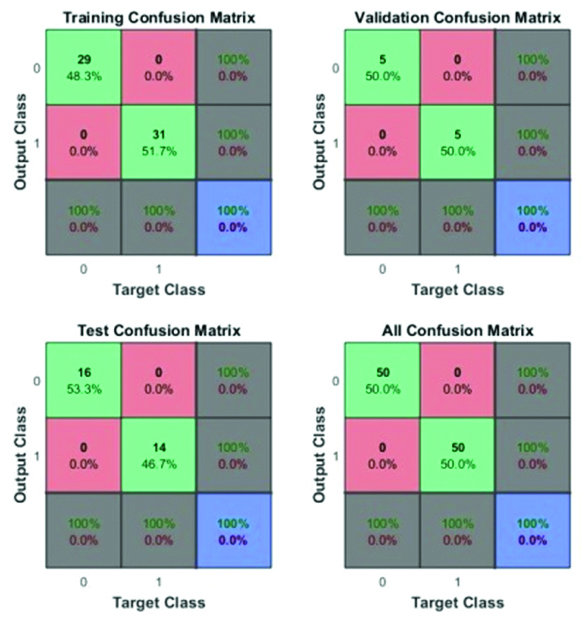
Thus, the results of the neural network classifier describe a further more accurate way of identification of skin tumours. With the help of the colour histogram, mean and standard deviation values of the extracted features and classifier result, identification and categorisation of skin tumours from dermal images were defined to be more absolute and easier.
Discussion
Colour histogram, statistical and histogram based features were used to define the two different categories of skin tumour. Dermal images obtained from the database were used for identification of skin tumours. Different analysis were carried out based on these skin tumours which include development of android application for segmentation and feature detection especially clinical features termed as ABCD features. With the help of this process, detection of different types of skin tumour was made possible. Pixel intensities of RGB colours from the images were illustrated to describe the nature of the lesion which is otherwise described as colour histogram. Colour histogram was used to discriminet melanoma from the dermal images for analysis study. Thus, colour histogram was used to diagnose and characterise melanoma. Statistical and histogram based features derived from the lesions were used for determination of skin tumour types. Histogram based features were used for recognition of various structures in images of different imaging modalities. Histogram based analysis of ultrasound images of placenta where structures of placenta are studied deeply with these features. These features were determined to identify the abnormalities in placenta. Thus histogram and statistical analysis were used to easily determine the different kinds of skin tumour.
Conclusion
Early diagnosis of skin tumours is very much necessary. The determination of skin tumours in dermal images was performed with the help of colour histogram, mean and standard deviation values of statistical and histogram based features. Neural network Classification process further defines the accuracy of the features for identification of two different categories. Classification, with very high accuracy rate describe the extracted features more precisely and classifies the categories of skin tumours from dermal images. Therefore, a simple method for identification of skin tumours from dermal images was defined.