Introduction
Fatty liver is one of the commonly encountered incidental finding in routine ultrasonography practice. The fatty liver has been divided into three grades according to severity based on the degree of increased liver echotexture on ultrasonography. Ultrasonic elastography technique which measures liver stiffness is being used in quantitative and semi-quantitative assessment of various liver conditions with few studies available on its role in fatty liver disease.
Aim
To investigate the correlation of Acoustic Radiation Force Impulse (ARFI) elastography with ultrasound grading of the fatty liver disease.
Materials and Methods
One hundred and nineteen patients were examined using B-mode ultrasonography and ARFI elastography and were divided in grade 0 (control group) and grade 1, 2, 3 according to severity of fatty liver. Ten successive ARFI readings were obtained from right lobe of liver and mean was considered the final ARFI value. Statistical analysis was performed using SPSS software, Version 20.0 with application of ANOVA test and t-test.
Results
Total 119 patients, 68 males and 51 females were included in the study. Out of 79 patients of fatty liver, 39 patients had Grade 1 fatty liver, 29 patients had Grade 2 fatty liver, and 11 patients had Grade 3 fatty liver. Forty patients with normal liver were included in the control i.e., grade 0 group. The mean ARFI was 0.97±0.10 in grade 0, 1.24±0.14 in Grade 1, 1.38±0.16 in Grade 2 and 1.74±0.50 in Grade 3 groups. The difference between mean ARFI values between the control group and fatty liver group and also across various grades of fatty liver was found to be significant (p<0.001). The patients with a higher grade of fatty liver showed higher values on ARFI elastography. The difference between ARFI values in alcoholic and non-alcoholic fatty liver patients were not statistically significant.
Conclusion
There was significant difference in ARFI elastography velocity measurements between normal and fatty liver patients. The difference between the mean ARFI values across the severity grades of fatty liver was also significant with higher ARFI elastography values seen in higher grades of fatty liver.
Fibrosis, Hypertriglyceridemia, Liver stiffness, Steatosis
Introduction
Fatty liver or Steatosis, known as intra-hepatic lipid degeneration occurs due to an impairment of the normal processes of synthesis and elimination of fat leading to abnormal accumulation of triglycerides and other fats within the hepatic cells [1,2]. There are many causative factors such as type II diabetes, obesity, alcohol, hypertriglyceridemia and metabolic abnormalities like galactosemia, glycogen storage diseases, homocystinuria, and tyrosinemia [3,4]. Nutritional status like severe malnutrition, total parenteral nutrition, or starvation diet and diseases like celiac sprue and Wilson disease may also contribute to fatty liver disease. Lipid is even accumulated in normal liver, accounting for 5% of the liver. When the amount of lipid is more than 5% in liver, it is defined as fatty liver, where lipids are mostly in the form of triacylglycerol [5,6]. Fatty liver was once believed to be a benign condition that only rarely progressed to chronic liver disease; however, fatty liver along with hepatic inflammation and liver cell death may result in liver fibrosis and cirrhosis leading to liver-related morbidity and mortality [7].
Role of imaging in fatty liver disease is for confirming the diagnosis, excluding other unsuspected causes of liver disease, assessing the extent of liver damage and defining the prognosis. Although many modalities are available to diagnose fatty liver, ultrasonography is the most preferable diagnostic method for fatty liver as it is quick, readily available, cost effective modality and carries no radiation risk. Liver ultrasonography findings of fatty infiltration of liver vary, depending on the amount of fat deposition and whether deposits are diffuse or focal. The diffuse fatty liver has been divided into three grades according to the severity based on the degree of increased liver echotexture on ultrasonography [8-11]. Mild or Grade 1 fatty liver shows mild diffuse increase in hepatic echogenicity with normal visualisation of diaphragm and walls of portal vein branches. Moderate or Grade 2 fatty liver have moderate diffuse increase in hepatic echogenicity and obscured echogenic walls of portal vein branches with maintained visualisation of diaphragmatic echogenicity. Severe or Grade 3 fatty liver patients show marked increase in hepatic echogenicity with poor penetration, obscuring the periportal as well as diaphragmatic echogenicity.
Ultrasonic elastography technique developed over recent past years is one of the new functional ultrasound imaging techniques which measures liver stiffness [12]. Ultrasound elastography is being used in quantitative and semi-quantitative assessment of focal and diffuse liver conditions [13-15]. The clinical viability of ARFI was investigated by Nightingale K et al., in 2002 [16]. Focused Ultrasound (US) was used to apply localised radiation force to small volumes of tissue for short durations and the resulting tissue displacements were mapped using ultrasonic correlation-based methods. They concluded that the tissue displacements were inversely proportional to the stiffness of the tissue with stiffer region of tissue exhibiting smaller displacements than a more compliant region. Subsequent many studies have established the role of elastography in various hepatic diseases, such as cirrhosis after hepatitis, alcoholic cirrhosis, malignancies and other diseases with few studies being available on its role in the assessment of fatty liver [5,17-21]. The present study was done to investigate the correlation of ultrasonic ARFI elastography with ultrasound severity grading of the fatty liver disease.
Materials and Methods
The hospital based prospective case-control study was carried out in the Department of Radiology of Medical College and tertiary referral hospital from July 2014 to June 2017 over the duration of three years. Written informed consent was obtained from all patients. The local ethics committee approved the study (App/2014/226). The patients who were referred for ultrasound abdomen and found to have fatty liver disease were included in the study. Patients who had liver mass, liver cirrhosis, congestive changes in liver and portal vein pathology, hepatitis, haemochromatosis and heart failure were excluded from the study. The detailed history of patients was documented at the time of initial visit with liver specific history including history of alcoholism, storage disorders, obesity and metabolic diseases. Ultrasonography and sonoelastography (ARFI) was performed with SIEMENS ACUSON S2000 machine using 3.5 MHz curvilinear transducer.
Total 119 patients, 68 (57.14 %) males and 51 (42.86 %) females were included in the study. The four groups were defined as normal (Grade 0) with normal liver echotexture, and mild (Grade 1), moderate (Grade 2), and severe (Grade 3) fatty liver according to the degree of diffuse increase in echotexture of the liver parenchyma on sonography. Seventy-nine patients found to have fatty liver on ultrasonography were graded according to the severity of fatty liver in mild (Grade 1), moderate (Grade 2) and severe (Grade 3) grades based on mild, moderate and marked diffuse increase in hepatic echogenicity respectively [8-11]. Mild diffuse increase in hepatic echogenicity with normal visualisation of diaphragm and walls of portal vein branches was labelled as mild or Grade 1 fatty liver. Moderate or Grade 2 fatty liver was diagnosed in presence of moderate diffuse increase in hepatic echogenicity and obscured echogenic walls of portal vein branches with maintained visualisation of diaphragmatic echogenicity. Patients with marked increase in hepatic echogenicity with poor penetration, obscuring the periportal as well as diaphragmatic echogenicity were categorised into severe or grade 3 fatty liver. Forty patients with normal liver were included in the control i.e., Grade 0 group. Patients were placed in supine position and intercostal and subcostal approach were used for the assessment of the liver. Appropriate depth and gain were adjusted. The Maximum craniocaudal dimension of the liver was obtained in midclavicular line and hepatomegaly was defined as the mid clavicular long axis dimension of the liver being longer than 15.5 cm [22]. The patients were placed in left lateral decubitus for ultrasound ARFI elastography measurement with the right arm extended and placed by the side of head. The right lobe of liver was imaged through intercostal approach and ARFI measurements were performed 1 cm below the liver capsule in the right lobe of liver [23]. The patients were asked to stop breathing for a moment, in order to minimise the breathing motion. The left lobe of liver was avoided due to transmitted pulsations from the heart. Ten successive ARFI readings were obtained from the right lobe of liver and the mean of all these 10 values was considered the final ARFI value.
Statistical Analysis
Statistical analysis was performed using SPSS software, Version 20.0 with application of ANOVA test and t-test. Quantitative data were expressed as mean±SD. The ANOVA test was used to compare the mean values obtained by ARFI for each grade of fatty liver. The t-test was used for intergroup comparison of averages. Value of p-value <0.01 was considered statistically significant. Receiver Operating Characteristic (ROC) curve was used to find the cut off value, sensitivity and specificity of ARFI elastography for fatty liver.
Results
The mean age of Grade 1 fatty liver group patients was 45.00±12.34 years (range 24-68 years), of Grade 2 fatty liver group patients was 40.90±14.26 years (range 23-78 years), of Grade 3 fatty liver group patients was 45.82±11.81 years (range 31-64 years), and the control group patients mean age was 41.88±14.52 years (range 21-75 years). The mean age of fatty liver patients and control groups was not statistically different (p = 0.515). The patients with fatty liver were further divided into alcoholic (Grade 0 - 4, Grade 1- 18, Grade 2- 15, Grade 3 - 6) and non-alcoholic (Grade 0 - 36, Grade 1- 21, Grade 2- 14, Grade 3- 5) groups.
The Mean liver craniocaudal dimension in mid clavicular line was 13.25±1.08 cm in the control group and 14.13±1.73 in Grade 1 fatty liver group, 14.72±1.46 in Grade 2 fatty liver group and 15.55±1.63 in Grade 3 fatty liver group. The relationship between liver size and the degree of fatty liver was evaluated and found that liver size increased with the degree of fatty infiltration (p-value <0.001).
Ten ARFI values were taken in all the patients and the mean was calculated [Table/Fig-1]. The mean ARFI was 0.97±0.10 in the control patients, 1.24±0.14 in Grade 1 fatty liver, 1.38±0.16 in Grade 2 fatty liver and 1.74±0.50 in Grade 3 fatty liver [Table/Fig-2,3]. On comparison, the difference between liver ARFI values in the control group (Grade 0) and fatty liver group (grades 1, 2, 3) was found to be significant (p-value <0.001). The difference between the mean ARFI values across various grades of fatty liver was also significant (p<0.001). The patients with a higher grade of fatty liver showed higher values on ARFI elastography [Table/Fig-1]. The difference between ARFI values in alcoholic and non-alcoholic fatty liver patients was not statistically significant [Table/Fig-4]. The cut off value of ARFI for fatty liver was calculated as 1.12 m/s in our study by plotting the ROC curve. Out of 79 fatty liver patients, 71 (89.9 %) patient had ARFI measurements more than 1.12 m/s and 8 (10.1%) patients showed ARFI values less than the cut off [Table/Fig-5]. Two (5%) patients out of 40 normal patients also showed ARFI measurement more than the 1.12 m/s. The 1.12 cut of value of ARFI measurements in diagnosis of fatty liver revealed sensitivity of 89.87%, Specificity of 95 %, Positive Predictive Value (PPV) of 97.26 % and Negative Predictive Value (NPV) of 82.61 %. This concludes that if ARFI elastography measurement of more than 1.12 m/s speed are obtained in liver elastography, then there were 89.87 % chances of occurrence of fatty liver. The cut off values of ARFI measurements were 1.06 m/s (sensitivity - 92.31%, specificity - 87.50%) for Grade 1 fatty liver, 1.12 m/s (sensitivity - 96.55%, specificity - 95.00%) for Grade 2 fatty liver and 1.18 m/s (sensitivity and specificity -100 %) for Grade 3 fatty liver. However, these ARFI values could not be applied as diagnostic test for grading of fatty liver due to overlap of the ARFI measurements across the grades of fatty liver.
ARFI elastography measurements according to ultrasound grading of the fatty liver. CI - Confidence Interval.
| US grading of fatty liver | No. of Patients(n = 119) | ARFI Sonoelastography Velocity (m/sec) |
|---|
| Mean | Std. Deviation | 95% CI for Mean |
|---|
| Lower Bound | Upper Bound |
|---|
| Grade 0 | 40 | 0.97 | 0.10 | 0.94 | 1.00 |
| Grade 1 | 39 | 1.24 | 0.14 | 1.19 | 1.28 |
| Grade 2 | 29 | 1.38 | 0.16 | 1.32 | 1.44 |
| Grade 3 | 11 | 1.74 | 0.50 | 1.40 | 2.08 |
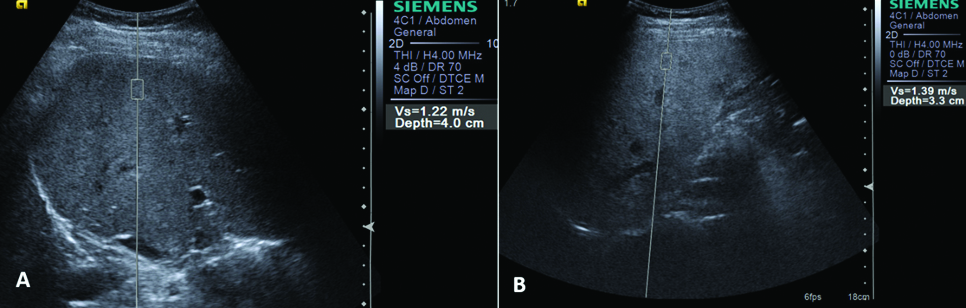
ARFI measurements in patient with grade 1 (A)and grade 2 (B) fatty liver.
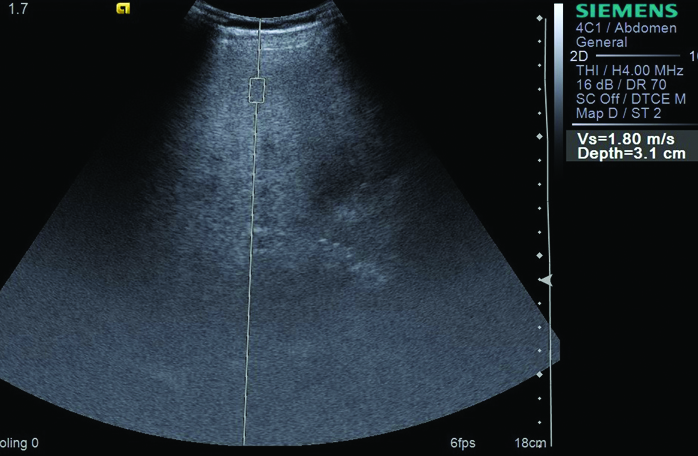
ARFI measurement in patient with grade 3 fatty liver.
ARFI values in alcoholic and non-alcoholic fatty liver patients.
| Fatty liver | Alcoholic/Nonalcoholic | No. of Patients(n=79) | Mean ARFI (m/sec) | SD | p-values |
|---|
| Grade 1 | Alcoholic | 18 | 1.23 | 0.15 | 0.874 |
| Non-Alcoholic | 21 | 1.24 | 0.13 |
| Grade 2 | Alcoholic | 15 | 1.39 | 0.16 | 0.903 |
| Non-Alcoholic | 14 | 1.38 | 0.16 |
| Grade 3 | Alcoholic | 6 | 1.80 | 0.48 | 0.708 |
| Non-Alcoholic | 5 | 1.67 | 0.58 |
Fatty liver diagnosis by USG and ARFI elastography.
| ARFI Values (m/s) | USG Diagnosis | Total |
|---|
| Fatty liver | Normal |
|---|
| >1.12 | 71 | 2 | 73 |
| ≤1.12 | 8 | 38 | 46 |
| Total | 79 | 40 | 119 |
Discussion
In present study, the difference between liver ARFI elastography measurements in the control group (Grade 0) and fatty liver group (Grades 1, 2, 3) was found to be significant (p-value <0.001). The difference between the mean ARFI values across various grades of fatty liver was also significant (p-value <0.001). The patients with a higher grade of fatty liver showed higher values on ARFI elastography [Table/Fig-1]. Yoneda M et al., in their study found significant positive correlation between median velocities measured by using ARFI sonoelastography and severity of fatty liver and reported a stepwise increase in the median velocity measured by using ARFI sonoelastography with increasing histologic severity of hepatic fibrosis in fatty liver disease [24]. In the study by Li Y-Y et al., significant difference was found in the elastography scores between different groups of fatty liver (p-value < 0.05) and the score of ultrasonic elastography increased with the severity of fatty liver [5]. Guerra JA et al., stated that ARFI elastography results in liver disease may differ according to aetiologies since the shear wave velocity changes with the elasticity of the hepatic parenchyma which may be different within aetiologies [25].
The cut off value of ARFI for fatty liver was calculated as 1.12 m/s in our study by plotting the ROC curve. Out of 79 fatty liver patients, 71 (89.9 %) patients had ARFI measurements more than 1.12 m/s and 8 (10.1%) patients showed ARFI values less than the cut off [Table/Fig-5]. Two (5%) patients out of 40 normal patients also showed ARFI measurement more than the 1.12 m/s. The 1.12 cut of value of ARFI measurements in diagnosis of fatty liver revealed sensitivity of 89.87%, Specificity of 95 %, PPV of 97.26 % and NPV of 82.61%. Li Y-Y et al., reported sensitivity of 97.14% and specificity of 91.11% in diagnosis of fatty liver by ultrasonic elastography [5].
It is important to assess the presence and degree of fibrosis in chronic liver diseases for treatment planning and outcome prediction [16]. The METAVIR scoring system based on liver biopsy stages the liver fibrosis into no or mild fibrosis, moderate fibrosis, severe fibrosis and cirrhosis [26]. Liver biopsy is considered the gold-standard for fibrosis assessment and stage classification [27]. However, liver biopsy is an invasive procedure, with potential complications that are severe in up to 1% of cases [28,29]. The specimen represents roughly only 1/50 000 of the liver volume, and there is also intra observer variability at microscopic evaluation [30]. Therefore, non-invasive methods for liver fibrosis assessment have been an intense field of research, including elastography methods using ultrasound. Many studies have established the role of elastography in study of various hepatic diseases, such as cirrhosis after hepatitis, alcoholic cirrhosis, malignancies and other chronic liver diseases [17,21,31,32]. Yoneda M et al., carried out a study to determine the value of liver stiffness measurement with Fibroscan, based on ultrasound transient elastography, in patients with non-alcoholic fatty liver disease (NAFLD) [33]. They found significant positive correlation between liver stiffness and the severity of liver fibrosis in patients with NAFLD. Guerra JA et al., also found that ARFI had good accuracy to distinguish initial fibrosis from advanced fibrosis in hepatitis C virus and non-alcoholic fatty liver disease and suggested that ARFI can replace biopsy in most cases [25]. The optimal cut off value of ARFI elastography for differentiated advanced fibrosis from initial fibrosis given in their study was 1.535 m/s with 83.3% sensitivity and 91.7% specificity. In our study, the mean ARFI was 0.97±0.10 in the control group patients, 1.24±0.14 in Grade 1 fatty liver, 1.38±0.16 in Grade 2 fatty liver and 1.74±0.50 in Grade 3 fatty liver patients. Thus, applying the ARFI cut off value of 1.535 m/s suggested by Guerra JA et al., seven out of 29 patients (24.1%) of grade 2 fatty liver and six out 11 patients (54.5 %) of grade 3 fatty liver in our study were likely to have advanced fibrosis requiring regular follow up and liver biopsy [25]. The major advantages of ARFI sonoelastography, as compared with liver biopsy, are that these techniques are painless, rapid, easy to perform and have no associated complications and are easily accepted by the patients [24].
Limitation
The liver biopsy was not performed to confirm the diagnosis of fatty liver, liver fibrosis and any other coexisting liver disease. However, strict sonography criteria were applied for diagnosis and grading of the fatty liver and measurement of ARFI elastography values in all patients.
Conclusion
There was significant difference in ARFI elastography velocity measurements between normal and fatty liver patients. The difference between the mean ARFI values across the severity grades of fatty liver was also significant with higher ARFI elastography values seen in higher grades of fatty liver. The difference between ARFI values in alcoholic and non-alcoholic fatty liver patients were not statistically significant.
[1]. Ribeiro R, Sanches J, Fatty liver characterization and classification by ultrasoundPattern Recognition and Image Analysis 2009 5524:354-61.10.1007/978-3-642-02172-5_46 [Google Scholar] [CrossRef]
[2]. Caldwell SH, Argo CK, Non-alcoholic fatty liver disease and nutrition. In: Dooley JS et al, editorsSherlock’s diseases of the liver and biliary system 2011 12th editionWiley-Blackwell:546-567.10.1002/9781444341294.ch28 [Google Scholar] [CrossRef]
[3]. Hamer OW, Aguirre DA, Casola G, Lavine JE, Woenckhaus M, Sirlin CB, Fatty liver: imaging patterns and pitfallsRadiographics 2006 26(6):1637-53.10.1148/rg.26606500417102041 [Google Scholar] [CrossRef] [PubMed]
[4]. Völzke H, Multicausality in fatty liver disease: Is there a rationale to distinguish between alcoholic and non-alcoholic origin?World J Gastroenterol 2012 18(27):3492-501.10.3748/wjg.v18.i27.349222826613 [Google Scholar] [CrossRef] [PubMed]
[5]. Li YY, Wang XM, Zhang YX, Ou G-C, Ultrasonic elastography in clinical quantitative assessment of fatty liverWorld J Gastroenterol 2010 16(37):4733-37.10.3748/wjg.v16.i37.473320872976 [Google Scholar] [CrossRef] [PubMed]
[6]. Assy N, Kaita K, Mymin D, Levy C, Rosser B, Minuk G, Fatty infiltration of liver in hyperlipidemic patientsDig Dis Sci 2000 45(10):1929-34.10.1023/A:100566151616511117562 [Google Scholar] [CrossRef] [PubMed]
[7]. Castera L, Forns X, Alberti A, Non-invasive evaluation of liver fibrosis using transient elastographyJ Hepatol 2008 48(5):835-47.10.1016/j.jhep.2008.02.00818334275 [Google Scholar] [CrossRef] [PubMed]
[8]. Mohammadi A, Ghasemi-rad M, Zahedi H, Toldi G, Alinia T, Effect of severity of steatosis as assessed ultrasonographically on hepatic vascular indices in non-alcoholic fatty liver diseaseMed Ultrason 2011 13(3):200-06. [Google Scholar]
[9]. AlShaalan R, Aljiffry M, Al-Busafi S, Metrakos P, Hassanain M, Nonalcoholic fatty liver disease: Noninvasive methods of diagnosing hepatic steatosisSaudi J Gastroenterol 2015 21(2):64-70.10.4103/1319-3767.15381225843191 [Google Scholar] [CrossRef] [PubMed]
[10]. Shin DS, Jeffrey RB, Desser TS, Pearls and pitfalls in hepatic ultrasonographyUltrasound Q 2010 26(1):17-25.10.1097/RUQ.0b013e3181ce153720216191 [Google Scholar] [CrossRef] [PubMed]
[11]. Tchelepi H, Ralls PW, Radin R, Grant E, Sonography of diffuse liver diseaseJ Ultrasound Med 2002 21(9):1023-32.10.7863/jum.2002.21.9.102312216750 [Google Scholar] [CrossRef] [PubMed]
[12]. Wilson LS, Robinson DE, Ultrasonic measurement of small displacements and deformations of tissueUltrason Imaging 1982 4(1):71-82.10.1177/0161734682004001057199773 [Google Scholar] [CrossRef] [PubMed]
[13]. Kim SG, Kim YS, Jung SW, Kim HK, Jang JY, Moon JH, The usefulness of transient elastography to diagnose cirrhosis in patients with alcoholic liver diseaseKorean J Hepatol 2009 15(1):42-51.10.3350/kjhep.2009.15.1.4219346784 [Google Scholar] [CrossRef] [PubMed]
[14]. Di Marco V, Bronte F, Cabibi D, Calvaruso V, Alaimo G, Borsellino Z, Noninvasive assessment of liver fibrosis in thalassaemia major patients by transient elastography (TE) - lack of interference by iron depositionBr J Haematol 2010 148(3):476-79.10.1111/j.1365-2141.2009.07996.x19930183 [Google Scholar] [CrossRef] [PubMed]
[15]. Ferraioli G, Tinelli C, Zicchetti M, Above E, Poma G, Di Gregorio M, Reproducibility of real-time shear wave elastography in the evaluation of liver elasticityEur J Radiol 2012 81(11):3102-06.10.1016/j.ejrad.2012.05.03022749107 [Google Scholar] [CrossRef] [PubMed]
[16]. Nightingale K, Soo MS, Nightingale R, Trahey G, Acoustic radiation force impulse imaging: in vivo demonstration and clinical feasibilityUltrasound Med Biol 2002 28(2):227-35.10.1016/S0301-5629(01)00499-9 [Google Scholar] [CrossRef]
[17]. Ferraioli G, Tinelli C, Dal Bello B, Zicchetti M, Filice G, Filice C, Liver Fibrosis Study Group. Accuracy of real-time shear wave elastography for assessing liver fibrosis in chronic hepatitis C: a pilot studyHepatology 2012 56(6):2125-33.10.1002/hep.2593622767302 [Google Scholar] [CrossRef] [PubMed]
[18]. Sporea I, Sirli R, Deleanu A, Tudora A, Curescu M, Cornianu M, Comparison of the liver stiffness measurement by transient elastography with the liver biopsyWorld J Gastroenterol 2008 14(42):6513-17.10.3748/wjg.14.651319030204 [Google Scholar] [CrossRef] [PubMed]
[19]. Poynard T, Munteanu M, Luckina E, Perazzo H, Ngo Y, Royer L, Liver fibrosis evaluation using real-time shear wave elastography: Applicability and diagnostic performance using methods without a gold standardJ Hepatol 2013 May 58(5):928-35.10.1016/j.jhep.2012.12.02123321316 [Google Scholar] [CrossRef] [PubMed]
[20]. Şirli R, Sporea I, Bota S, Raţiu I, Liver elastography for the diagnosis of portal hypertension in patients with liver cirrhosisMed Ultrason 2012 14(3):225-30. [Google Scholar]
[21]. Chon YE, Jung ES, Park JY, Kim DY, Ahn SH, Han KH, The accuracy of noninvasive methods in predicting the development of hepatocellular carcinoma and hepatic decompensation in patients with chronic hepatitisJ Clin Gastroenterol 2012 46(6):518-25.10.1097/MCG.0b013e31825079f122688146 [Google Scholar] [CrossRef] [PubMed]
[22]. Dick R, Watkinson A, The liver and spleen. In: Sutton D, edTextbook of radiology and imaging 2002 7th edNew YorkElsevier:737-786. [Google Scholar]
[23]. Madhok R, Tapasvi C, Prasad U, Gupta AK, Aggarwal A, Acoustic radiation force impulse imaging of the liver: measurement of the normal mean values of the shearing wave velocity in a healthy liverJ Clin Diagn Res 2013 7(1):39-42.10.7860/JCDR/2012/5070.266523450092 [Google Scholar] [CrossRef] [PubMed]
[24]. Yoneda M, Suzuki K, Kato S, Fujita K, Nozaki Y, Hosono K, Nonalcoholic fatty liver disease: US-based acoustic radiation force impulse elastographyRadiology 2010 256(2):640-47.10.1148/radiol.1009166220529989 [Google Scholar] [CrossRef] [PubMed]
[25]. Guerra JA, Trippia M, Pissaia A, Teixeira BC, Ivantes CA, Acoustic radiation force impulse is equivalent to liver biopsy to evaluate liver fibrosis in patients with chronic hepatitis c and nonalcoholic fatty liver diseaseArq Gastroenterol 2015 52(3):234-38.10.1590/S0004-2803201500030001526486293 [Google Scholar] [CrossRef] [PubMed]
[26]. The French METAVIR Cooperative Study GroupIntraobserver and interobserver variations in liver biopsy interpretation in patients with chronic hepatitis CHepatology 1994 20(1 Pt 1):15-20.10.1002/hep.1840200104 [Google Scholar] [CrossRef]
[27]. Gebo KA, Herlong HF, Torbenson MS, Jenckes MW, Chander G, Ghanem KG, Role of liver biopsy in management of chronic hepatitis C: a systematic reviewHepatology 2002 36(5 Suppl 1):S161-72.10.1053/jhep.2002.3698912407590 [Google Scholar] [CrossRef] [PubMed]
[28]. Seeff LB, Everson GT, Morgan TR, Curto TM, Lee WM, Ghany MG, Complication rate of percutaneous liver biopsies among persons with advanced chronic liver disease in the HALT-C trialClin Gastroenterol Hepatol 2010 8(10):877-83.10.1016/j.cgh.2010.03.02520362695 [Google Scholar] [CrossRef] [PubMed]
[29]. Stotland BR, Lichtenstein GR, Liver biopsy complications and routine ultrasoundAm J Gastroenterol 1996 91(7):1295-96. [Google Scholar]
[30]. Regev A, Berho M, Jeffers LJ, Milikowski C, Molina EG, Pyrsopoulos NT, Sampling error and intraobserver variation in liver biopsy in patients with chronic HCV infectionAm J Gastroenterol 2002 97(10):2614-18.10.1111/j.1572-0241.2002.06038.x12385448 [Google Scholar] [CrossRef] [PubMed]
[31]. Srinivasa Babu A, Wells ML, Teytelboym OM, Mackey JE, Miller FH, Yeh BM, Elastography in chronic liver disease: modalities, techniques, limitations, and future directionsRadioGraphics 2016 36(7):1987-2006.10.1148/rg.201616004227689833 [Google Scholar] [CrossRef] [PubMed]
[32]. Boursier J, Isselin G, Fouchard-hubert I, Oberti F, Dib N, Lebigot J, Acoustic radiation force impulse: a new ultrasonographic technology for the widespread noninvasive diagnosis of liver fibrosisEur J Gastroenterol Hepatol 2010 22(9):1074-84.10.1097/MEG.0b013e328339e0a120440210 [Google Scholar] [CrossRef] [PubMed]
[33]. Yoneda M, Fujita K, Inamori M, Nakajima A, Yoneda M, Tamano M, Transient elastography in patients with nonalcoholic fatty liver disease (NAFLD)Gut 2007 56(9):1330-31.10.1136/gut.2007.12641717470477 [Google Scholar] [CrossRef] [PubMed]