Simple Spectrophotometric Method for Analysis of Serum Catalase Activity
Mahmoud Hussein Hadwan1, Haider Khabt2
1 Assistant Professor, Department of Chemistry, University of Babylon, Hilla City, Babylon, Iraq.
2 Researcher, Department of Chemistry, University of Babylon, Hilla City, Babylon, Iraq.
NAME, ADDRESS, E-MAIL ID OF THE CORRESPONDING AUTHOR: Dr. Mahmoud Hussein Hadwan, Al-Imam Ali St. Hilla, Hilla City, Babil, Iraq.
E-mail: mahmoudhadwan@gmail.com
Introduction
Catalase is a principal constituent of the antioxidant system that attenuates the oxidative stress, which is ubiquitously associated with several types of pathological disorders.
Aim
This paper describes a discontinuous assay for the assessment of catalase activity using the titanium tetrachloride/sulfuric acid reagent.
Materials and Methods
Samples containing catalase are incubated with hydrogen peroxide for three minutes prior to fast mixing of aliquots of the incubation mixtures with titanium tetrachloride/sulfuric acid reagent, which measures remaining hydrogen peroxide (H2O2). Absorbance is then read at 405 nm. Dissociation of hydrogen peroxide is proportional to catalase activity in the used sample. One-way analysis of variance (ANOVA) was used to analyse the resulted data. p-value <0.05 was considered to be statistically significant using SPSS Statistics 17.0 software.
Results
The current method characterizes the use of a correction factor to exclude the interference that arises from the presence of a yellow background colour of serum and/or reducing agents that reduce titanium (IV) to titanium (III). The imprecision of the method was considered by calculating the coefficient of variation, which equals to 3.6% within run and 5.7% between run. The catalase assay measured using the kinetic method produced a good correlation (r=0.9771).
Conclusion
The study explains a simple discontinuous method for catalase activity assessment which can be completed with few steps, and which allows catalase to be measured in the presence of high concentration of other molecules as well as at low levels of H2O2.
Antioxidant, Hydrogen peroxide, Sulfuric acid, Titanium tetrachloride
Introduction
Catalase is exceptional when compared to other enzymes of the peroxidase family since it exhibits both catalase activity and peroxidase as shown below. Usual substrates for peroxidase activity (SH2 in the reaction) consist of ethanol, methanol, formate, nitrite and phenol [1].
2H2O2 ― CAT → 2H2O+O2 (Catalase activity)
2H2O2+SH2 ― CAT → 2H2O + S (Peroxidase activity)
Catalase is a principal constituent of the antioxidant system that attenuates the oxidative stress, which is ubiquitously associated with several types of pathological disorders [2]. Catalase is a widely distributed enzyme and is present in all aerobic microorganisms, plant, and animal cells [3]. Many methods have been elucidated for the assessment of catalase activity. Most depend on the measurement of un-reacted hydrogen peroxide after a period of incubation with the catalase enzyme or the volume of oxygen produced by decay of the substrate [4]. The formation of oxygen can be measured by oxygen electrode [5] or low-flow gas meter [6]. The H2O2 decay at 240 nm can be measured spectrophotometrically [7,8] or by chemiluminiscence [9,10]. Other methods have been used including iodometry [11], titrimetry [12], and polarimetry [13].
The present study reports a simple method which includes the spectrophotometric measurement of hydrogen peroxide with an improved serum catalase assessment. The clinical implication of serum catalase activity is included in assessment of acute pancreatitis. Serum catalase activity is elevated in acute pancreatitis for a significantly longer time than the serum amylase activity and is also documented to be elevated in chronic pancreatitis [14].
Also, the new method is free of the interference that arises from the presence of a strong yellow background found in some types of pathologic sera.
Materials and Methods
The methodology was based on the article by Hadwan MH and Abed HN, [15].
Principle:
Catalase catalyzes the subsequent reaction:

Catalase activity was measured by incubating the enzyme sample in 1.0 mL substrate (20 μmol per ml hydrogen peroxide in 60 mmol/l sodium-potassium phosphate buffer, pH 7.4) at 37oC for three minutes. The reaction was stopped with titanium sulphate. The method quantifies undecomposed hydrogen peroxide by reacting it with a titanium sulphate reagent to produce pertitanic acid. Absorbance of the yellow pertitanic acid was measured at 405 nm against the blank.
Ti4+ + H2O2 + 2H2O = H2TiO4 (pertitanic acid) + 4H+Reagents:
Titanium reagent: 0.1% (v/v) TiCl4 in 20% (v/v) H2SO4.
Sodium, potassium phosphate buffer (50 mM, pH 7.4): this buffer is prepared by dissolving 1.1 gm of Na2HPO4 and 0.27 gm of KH2PO4 in 100 mL distilled water [15].
H2O2 (20 mM) in 50 mmol/L sodium, potassium phosphate buffer: this solution is freshly diluted and standardized daily using a molar extinction coefficient of 43.6 M-1 cm-1 at 240 nm [16].
Instrument: Shimadzu 1800 spectrophotometer was used in the study.
Procedure: shown in [Table/Fig-1].
Illustrates the procedure used for measurement of catalase activity.
| Reagents | Test | Control-test* | Standard | Blank |
|---|
| Serum | 100 μL | 100 μL | - | - |
| Distilled water | - | 1000 μL | 100 μL | 1100 μL |
| Hydrogen peroxide | 1000 μL | - | 1000 μL | - |
| Titanium reagent | 3000 μL | 3000 μL | 3000 μL | 3000 μL |
After that, the tubes were kept at room temperature. Changes in absorbance were recorded at 405 nm against the reagent blank.
Calculation: Therate constant of a first-order reaction (k) equation is used to determine catalase activity:

t: time.
S°: absorbance of standard tube.
S: absorbance of test tube.
M: absorbance of control test (correction factor).
Vt: total volume of reagents in test tube.
Vs: volume of serum.
*The present method uses a correction factor (Control-test) to eliminate the interference that arises from the presence of a strong yellow background colour in the sample containing catalase enzyme. The absorbance of test tube in procedure belong to two types of compounds, undecomposed hydrogen peroxide and interferences that found in the sample. The absorbance of (Control-test) tube in procedure belongs to interference compounds found in the sample only. By subtracting the absorbance of (control-test) tube from the absorbance of test tube; we exclude the interference of a strong yellow background colour. Consequently; the resulting absorbance was related to un-reacted hydrogen peroxide in enzymatic reaction.
Results
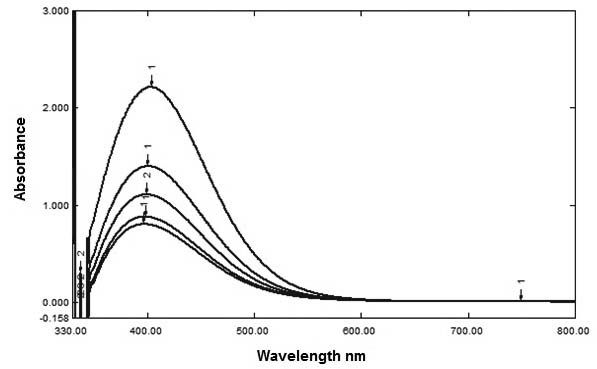
An absorbance spectrum of the colourimetric product was measured from 330 nm to 800 nm and revealed a peak at 405 nm [Table/Fig-2], suggesting the optimum colourimetric wavelength for the yellow reaction product is 405 nm.
Absorption spectra obtained for the colourimetric products of the present assay.
The present method uses a correction factor (Control-test) to remove the interference that arises from the presence of a yellow background colour of serum and/or reducing agents. Sugars and amino acids are the main constituents of the serum. Also, they have the reduction ability to interfere with the reagents that are used for assessment of catalase activity [17]. Possible interferences of compounds that could disturb catalase activity assessment were measured using the methods documented by Hadwan MH and Abed HN, [15]. To determine the effect of interferences that might disturb the catalase measurement, seven volumetric flasks were taken, to each one was added one ml of catalase known activity (500 kU/L) obtained from Himedia (Product Code: TC037). Its activity was calibrated according to Aebi’s method [18] and nine ml of 55.55 μmol/L of one interference only that dissolved in phosphate buffer (50 mM, pH 7.4). The final activity equals to 50 kU/L of catalase with 50 μmol/L of interference. Catalase enzyme activity was measured by the present method (with and without correction factor). [Table/Fig-3] shows the effects of several interferences on the catalase activity. Catalase enzyme activity was not affected significantly by a considerable amount of each interference compound when assayed by the present method. However, interferences affected catalase enzyme activity when method was used without a correction factor. The result established from [Table/Fig-3] proves that the correction factor was necessary to get a precise result.
Shows the effects of various interferences on the catalase assay.
| Substance | Concentration of substance | Observed Catalase activity |
|---|
| Method without correction factor | Recovery% | Present method | Recovery% |
|---|
| - | 0 | 48.87 | - | 49.3 | - |
| Glucose | 50 | 48.72 | 99.6 | 49.1 | 99.5 |
| Cysteine | 50 | 48.1 | 98.4 | 49.2 | 99.7 |
| Histidine | 50 | 46.51 | 95.1 | 48.89 | 99.1 |
| Lysine | 50 | 46.53 | 95.2 | 49.0 | 99.3 |
| Arginine | 50 | 48.1 | 98.4 | 49.0 | 99.3 |
| Methionine | 50 | 48.3 | 98.8 | 48.93 | 99.2 |
Results achieved for serum by the present method were compared with that produced by the method of Aebi H [18]. Matching sample and buffer were used in both methods. The results of the present assay showed a good precision [Table/Fig-4] and a good correlation with the Aebi’s method [Table/Fig-5].
Precision of the assay procedure.
| Variables | n | Mean (±SD): k.U/liter | CV %* |
|---|
| Within-run | 20 | 111.5±4.1 | 3.6 % |
| Between-run | 20 | 108.8±6.3 | 5.7 % |
* CV%: the percentage of ratio of the standard deviation to the mean.
Statistical analysis of the values obtained for catalase by Aebi’s method and present method.
| Method | n (20) |
|---|
| Mean of Aebi’s Method | 116 |
| Mean of the present method | 112 |
| Mean of both methods | 114.5 |
| Regression coefficient B | 0.9781 |
| Regression coefficient A | 0.0219 |
| Correlation coefficient | 0.9769 |
Accuracy of the present assay protocol was determined by recovery of hydrogen peroxide added to the reaction solution after the end of enzymatic reaction detailed in the [Table/Fig-6]. The high accuracy of the present assay protocol was belonging to high molar extinction coefficient and correction factor.
Analytical recovery of hydrogen peroxide added to the reaction solution after the end of enzymatic reactions.
| Present in assay | Equivalents of hydrogen peroxide | Calculated activity kU/L | Observed activity akU/L | Recovery % |
|---|
| Enzymatic sample | - | - | 100 | - |
| Enzymatic sample + hydrogen peroxide | 10 | 110 | 108 | 98.10 % |
| Enzymatic sample + hydrogen peroxide | 25 | 125 | 122 | 97.6 % |
| Enzymatic sample + hydrogen peroxide | 50 | 150 | 146 | 97.33 % |
| Enzymatic sample + hydrogen peroxide | 100 | 200 | 195 | 97.5 % |
| Enzymatic sample + hydrogen peroxide | 200 | 300 | 291 | 97.0 % |
a mean of triplicate determinations
The result concluded from [Table/Fig-6] proves that the linearity of the following method reaches to about 300 kU.
Discussion
This following article elucidates a new method for measuring catalase activity in serum. The method quantifies undecomposed hydrogen peroxide by reacting it with a titanium sulphate reagent to produce pertitanic acid. Absorbance of the yellow pertitanic acid was measured at 405 nm against the blank (as shown in [Table/Fig-2]).
The titanium tetrachloride/sulfuric acid reagent can be represented as a “stop bath” for enzymatic reaction that is regulated by catalase enzyme. When the enzyme solution is mixed with sulfuric acid, its molecules are denatured; any hydrogen peroxide which has not been decomposed by the catalase will react with the titanium to produce a peroxotitanium complex (pertitanic acid), which has a maximum absorbance at 405 nm.
Despite the discovery of the titanium sulfate method for H2O2 estimation by Eisenberg [19] several decades ago, it wasn’t appealing to use in the estimation of serum catalase activity because there are two types of interferences. The interferences include a yellow background colour of serum and/or reducing agents that reduce titanium (IV) to titanium (III). The only exception is the work that is done by Baudhuin and his assistants [20,21] to measure catalase activity in some tissues. Baudhuin and his coworkers did not explain how to remove interferences and did not compare their own method with other methods. The present method uses a correction factor (Control-test) to remove the interference that arises from the presence of a yellow background colour of serum and/or reducing agents. Sugars and amino acids are the main constituents of the serum. Also, they have the reduction ability to interfere with the reagents that are used for assessment of catalase activity [17]. [Table/Fig-3] shows the effects of several interferences on the catalase activity. Catalase enzyme activity was not affected significantly by a considerable amount of each interference compound when assayed by the present method. However, interferences affected catalase enzyme activity when method was used without a correction factor. The result established from [Table/Fig-3] proves that the correction factor was necessary to get a precise result.
The present method has introduced several advantages when compared with Aebi’s method. Catalase activity can be considered by measuring the rate of dissociation of hydrogen peroxide at 240 nm (Aebi’s method). There are practical problems with this method, which is related to using very high and un-physiological concentrations of H2O2 (5-50 mM) for achieving acceptable initial absorbance (the absorbance of H2O2 at 240 nm is only 43.6 M-1 cm-1). These high concentrations of hydrogen peroxide cause direct, but variable auto-inactivation of catalase by transformation of the active enzyme - H2O2 complex I to the inactive complex II [18]. Additionally, many cellular constituents such as proteins absorb intensely at 240 nm so that low activities of catalase often have to be assessed by the continuous method in contrast to a higher background absorbance.
The present method is more accurate (as shown in [Table/Fig-4]) and sensitive than Aebi’s method (as shown in [Table/Fig-5,6]) because of the high molar extinction coefficient for H2TiO4 (ε = 689 M-1 cm-1 at 407 nm) [22] compared with the molar extinction coefficient for H2O2 at 240 nm (ε = 43.6 M-1 cm-1) [16]. Sensitivity is often described in terms of the molar extinction coefficient (ε, M-1 cm-1) of the measured product. The degree of the sensitivity is very significant in the spectrophotometric determination of an analyte [23].
On the other hand, the current method was preferable when compared with some colourimetric methods such as Hadwan MH and Almashhedy LA, and Ou P and Wolff SP, [7,8]. Hadwan MH and Almashhedy LA, presented simple method to measure catalase activity [7]. They used a certified standard enzyme with identified unit activity as an alternative of necessitation to standardize exact hydrogen peroxide concentration to 30 mM in a difficult process. The disadvantage of this method consists of the difficulty to obtain a certified catalase enzyme with identified activity. Ou P and Wolff SP, introduced a simple method to measure catalase activity. Ou P and Wolff SP, did not clarify how to exclude interferences and did not compare their own method they used with other procedures [8].
Limitation
The results of the present study were not compared with that obtained by commercial kits.
Conclusion
The study explains a simple discontinuous method for catalase activity assessment which can be completed with few steps, and which allows catalase to be measured in the presence of high concentrations of other molecules as well as at low levels of H2O2. The titanium tetrachloride/sulfuric acid reagent is a sensitive assay for H2O2 which thus facilitates measurement of catalase at low concentrations of substrate confirming that auto-inactivation of catalase is reduced during the steps of measurement.
After that, the tubes were kept at room temperature. Changes in absorbance were recorded at 405 nm against the reagent blank.
* CV%: the percentage of ratio of the standard deviation to the mean.
a mean of triplicate determinations
[1]. Shivakumar A, Nagaraja P, Chamaraja NA, Krishna H, Avinash K, Determination of catalase activity using chromogenic probe involving iso-nicotinicacidhydrazide and pyrocatecholJ Biotechnol 2011 155(4):406-11.10.1016/j.jbiotec.2011.07.03521839122 [Google Scholar] [CrossRef] [PubMed]
[2]. Kodydková J, Vávrová L, Kocík M, Žák A, Human catalase, its polymorphisms, regulation and changes of its activity in different diseasesFolia Biol (Praha) 2014 60(4):153-67. [Google Scholar]
[3]. Montavon P, Kukic KR, Bortlik K, A simple method to measure effective catalase activities: optimization, validation, and application in green coffeeAnal Biochem 2007 360(2):207-15.10.1016/j.ab.2006.10.03517141173 [Google Scholar] [CrossRef] [PubMed]
[4]. Siqueira AJ, Remião JO, Azevedo AM, Azambuja CR, A gasometric method to determine erythrocyte catalase activityBraz J Med Biol Res 1999 32(9):1089-94.10.1590/S0100-879X199900090000610464384 [Google Scholar] [CrossRef] [PubMed]
[5]. Kroll RG, Frears ER, Bayliss A, An oxygen electrode based assay of Catalase activity as a rapid method for estimating the bacterial contents of foodJ Appl Bacteriol 1989 66:209-17.10.1111/j.1365-2672.1989.tb02471.x [Google Scholar] [CrossRef]
[6]. Guwy AJ, Martin SR, Hawkes FR, Hawkes DL, Catalase activity measurements in suspended aerobic biomass and soil samplesEnzyme Microb Technol 1999 25:669-76.10.1016/S0141-0229(99)00115-5 [Google Scholar] [CrossRef]
[7]. Hadwan MH, Almashhedy LA, Alsalman AS, Precise method for the assessment of catalase-like activity in seminal fluidsInt J Pharm Bio Sci 2013 4:949-54. [Google Scholar]
[8]. Ou P, Wolff SP, A discontinuous method for catalase determination at ‘near physiological’ concentrations of H2O2 and its application to the study of H2O2 fluxes within cellsJ Biochem Biophys Methods 1996 31:59-67.10.1016/0165-022X(95)00039-T [Google Scholar] [CrossRef]
[9]. Maral J, Puget K, Michelson AM, Comparative study of superoxide dismutase, catalase and glutathione peroxidase levels in erythrocytes of different animalsBiochemical and Biophysical Research Communications 1977 77:1525-35.10.1016/S0006-291X(77)80151-4 [Google Scholar] [CrossRef]
[10]. Mueller S, Riedel HD, Stremmel W, Determination of catalase activity at physiological hydrogen peroxide concentrationsAnal Biochem 1997 245(1):55-60.10.1006/abio.1996.99399025968 [Google Scholar] [CrossRef] [PubMed]
[11]. Setlow RB, The inactivation of catalase by deuterons and heatArchives of Biochemistry and Biophysics 1951 34(2):396-408.10.1016/0003-9861(51)90018-5 [Google Scholar] [CrossRef]
[12]. Richardson M, Huddleson IF, Bethea R, Study of catalase in erythrocytes and bacteria. I. Procedure for the determination of the catalase activity of erythrocytesArchives of Biochemistry and Biophysics 1953 42:114-23.10.1016/0003-9861(53)90245-8 [Google Scholar] [CrossRef]
[13]. Rigo A, Rotilio C, Simultaneous determination of superoxide dismutase and catalase in biological materials by polarographyAnalytical Biochemistry 1977 21:157-66.10.1016/0003-2697(77)90609-1 [Google Scholar] [CrossRef]
[14]. Goth L, Meszaros I, Nemeth N, Serum catalase activity in acute pancreatitisClinica Chem 1982 28(9):1999-2000. [Google Scholar]
[15]. Hadwan MH, Abed HN, Data supporting the spectrophotometric method for the estimation of catalase activityData in Brief 2016 6:194-99.10.1016/j.dib.2015.12.01226862558 [Google Scholar] [CrossRef] [PubMed]
[16]. Lei B, Adachi N, Arai T, Measurement of the extracellular H2O2 in the brain by microdialysisBrain Res Brain Res Protoc 1998 3(1):33-36.10.1016/S1385-299X(98)00018-X [Google Scholar] [CrossRef]
[17]. Sinha AK, Colourimetric Assay of catalaseAnalytical Biochemistry 1972 47(2):389-94.10.1016/0003-2697(72)90132-7 [Google Scholar] [CrossRef]
[18]. Aebi H, Catalase in vitroMethods Enzymol 1984 105:121-26.10.1016/S0076-6879(84)05016-3 [Google Scholar] [CrossRef]
[19]. Eisenberg G, Colourimetric Determination of Hydrogen PeroxideInd Eng Chem Anal Ed 1943 15(5):327-28.10.1021/i560117a011 [Google Scholar] [CrossRef]
[20]. Baudhuin P, Isolation of rat liver peroxisomesMethods Enzymol 1974 31:356-68.10.1016/0076-6879(74)31039-7 [Google Scholar] [CrossRef]
[21]. Baudhuin P, Beaufay H, Rahman-Li Y, Sellinger OZ, Wattiaux R, Jacques P, Tissue fractionation studies. Intracellular distribution of monoamine oxidase, aspartate aminotransferase, alanine aminotransferase, D-amino acid oxidase and catalase in rat-liver tissueBiochem J 1964 92:179-84.10.1042/bj09201794378796 [Google Scholar] [CrossRef] [PubMed]
[22]. Machala Z, Tarabova B, Hensel K, Spetlikova E, Sikurova L, Lukes P, Formation of ROS and RNS in water electro-sprayed through transient spark discharge in air and their bactericidal effectsPlasma Process Polym 2013 10(7):649-59.10.1002/ppap.201200113 [Google Scholar] [CrossRef]
[23]. Barney JE, The meaning of “sensitivity” in trace analysisTalanta 1967 14(11):1363-66.10.1016/0039-9140(67)80218-2 [Google Scholar] [CrossRef]