Bipeds’ feet receives the weight of the whole body and stabilises the body in changing postural and environmental conditions [1]. The foot posture varies among infants, children and adults [2]. To facilitate this important function the foot has the medial longitudinal arch, the lateral longitudinal arch and the transverse arch [3]. These arches help in proportional distribution of body weight. Abnormalities in the arches of foot lead to various kinds of foot deformities like pes planus, pes cavus, congenital talipus equinovarus etc. A variation in the foot posture plays an important role in predisposition to injury [4]. The injuries not only depend on the type of foot but also on other factors like the age of the person, the height, weight and BMI of the individuals [5]. The primary aim of treatment also differs according to the type of foot abnormality.
Pes planus (flat foot) has a much higher prevalence compared to other forms of foot deformities. The aetiology of pes planus differs in case of infants, children and adults. Various studies have shown that overweight children tend to have flatter feet [6,7]. In infants the foot appears apparently flat due to presence of fat in the sole of foot [8]. As the age advances the aetiology of flat foot shifts from normal physiological entity to a deformity caused by structural changes in foot anatomy. Previous studies have shown that a lower height of foot arch is more prevalent in obese children. This occurs not because of excessive fat pad in obese children but because excess weight bearing brings structural changes in foot architecture [6]. When this persists into adulthood, it leads to gait problems which can be disabling [9].
Many studies regarding the various types of foot in children have been reported in literature [9-11] but it lacks data in young adults. As the anthropometric measurements like height; weight and BMI are also age dependent, their correlation with different types of foot postures should also be done in different age groups so as to ascertain whether the same factors which affect them in childhood persist in adult life also.
The present study therefore, aimed to find the relation of different types of foot with height; weight and BMI if any in young individuals of 18-24 years of age.
Materials and Methods
The present cross-sectional study was conducted on 250 first year medical students of Mahatma Gandhi Medical College and Research Institute; within the age group of 18-24 years between 2013-14 after getting approval from Institutional Human Ethics Committee. Participants with foot deformities were excluded from the study. The volunteers were made to sit on a chair and the foot brought in contact with the foot impression ink pad. Each individual foot impression of both right and left feet was taken on white sheets while standing. Height (in cm), weight (in kg) and BMI of the volunteers were noted according to standard protocols [12].
Footprints of the 250 volunteers were analysed by a single examiner for plantar Arch Index (AI) using Staheli’s method. First a line was drawn from the medial forefoot edge to the mid-heel region. The midpoint of this line was calculated by scale and noted up to 1 decimal. From this midpoint, a perpendicular line was drawn, crossing the foot print. This was taken as the mid-foot width (A). From the mid-heel point another perpendicular line was drawn crossing the foot print. This was the measurement of the mid-heel width (B). AI=A/B [Table/Fig-1] [13].
Calculation of Staheli’s Arch Index in 1a. Normal, 1b. Low and 1c. High arch feet.
A: mid foot width, B: mid heel width
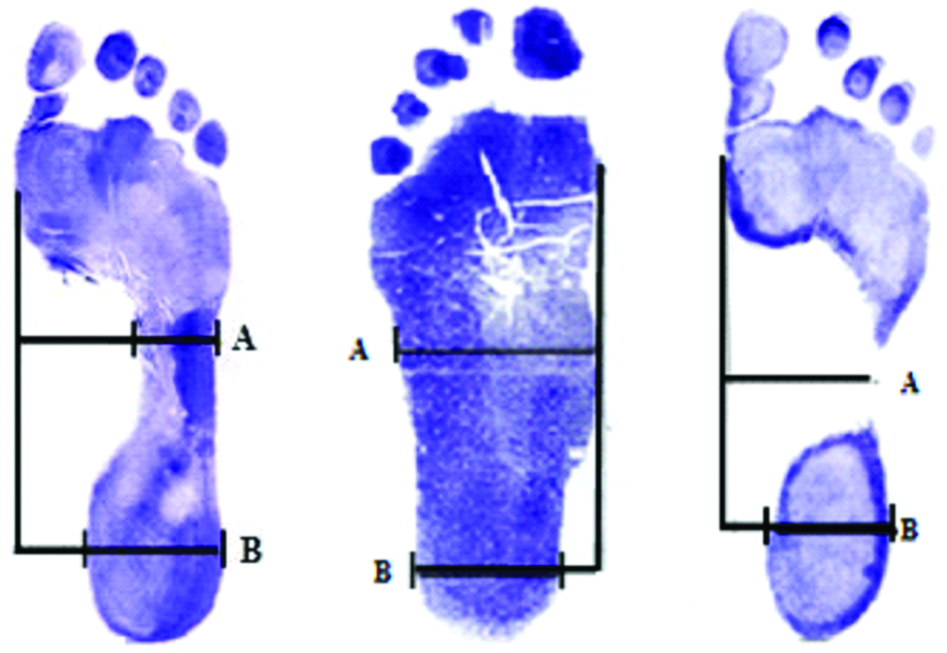
Range of arch index between 0.34–0.56 was considered normal arch, >0.56 considered as flat foot and 0-0.33 as high arch foot [14].
Statistical Analysis
The data collected was analysed using SPSS software version 16.0.
Relation of the study group with height, weight and BMI was done using Kruscal Wallis H test, Chi-square test and ANOVA for calculating the statistical significance.
Results
Foot prints of the participants were examined for different types of foot. Out of the 250 participants, 232 (92.8%) participants had normal foot, 13 (5.2%) had bilateral flat foot and five participants (2%) had bilateral high arch foot. Unilateral flat foot or high arch foot was not observed in the study group.
Relation of individuals’ height with different types of foot: The mean height of participants in the normal arch foot group (n=232, M=99, F=133) was 164.05±8.58 cm while those who had flat foot (n=13, M=8, F=5), it was 168.07±9.09 and in the high arch group (n=5, M=2, F=3), the mean height was 158.02±5.58 cm. This difference in height of the individuals and different types of foot was not statistically significant (p-value=0.07) [Table/Fig-2].
Height of the individuals (in cm).
| Different Foot Types | Height of the individuals (in cm) |
|---|
| MEAN | SD | MIN | MAX | p-value |
|---|
| Normal (232) | 164.05 | 8.58 | 140 | 186 | 0.07 |
| Flat (13) | 168.07 | 9.09 | 156 | 184 |
| High Arch (5) | 158.02 | 5.58 | 154 | 168 |
p-value calculated by ANOVA
An interesting finding noted in the present study was that the participants in the flatfoot group had a mean height of 168.07 (±9.09) cm which was much higher than the participants in high arch foot group 158.02 (±5.58) cm, though the difference was not statistically significant (p=0.07).
Relation of weight of individuals with different types of foot: The mean weight of the participants who had normal foot (n=232, M=99, F=133) was 61.93±12.46 kg. Out of 13 (M=8, F=5) participants who had flat foot, the mean weight was 65.38±13.56 kg and in the high arch group (n=5, M=2, F=3), it was 49±15.39 kg. The relation of weight of the individuals with different types of foot was statistically significant (p-value=0.05) [Table/Fig-3].
Weight of the individuals (in kg).
| Different Foot Types | Weight of the individuals (in kg) |
|---|
| MEAN | SD | MIN | MAX | p-value |
|---|
| Normal (232) | 61.93 | 12.46 | 34 | 121 | 0.05 |
| Flat (13) | 65.38 | 13.56 | 42 | 88 |
| High Arch (5) | 49 | 15.39 | 38 | 76 |
p-value calculated by ANOVA
This implies that individuals having more weight tend to have flat feet and those with less weight are prone to have high arch feet.
Relation of BMI of individuals with different types of foot: On analysing the mean BMI of the participants in normal foot group (n=232, M=99, F=133), was 22.99±4.28 while individuals of flat foot group (n=13, M=8, F=5) showed a mean of 23.02±3.78. In the high arch group (n=5, M=2, F=3), mean was found to be 19.32±4.46. The BMI correlation with different types of foot was not statistically significant (p-value=0.16) [Table/Fig-4].
| Different Foot Types | BMI of the individuals |
|---|
| MEAN | SD | MIN | MAX | p-value |
|---|
| Normal (232) | 22.99 | 4.28 | 14.52 | 46.10 | 0.16 |
| Flat (13) | 23.02 | 3.78 | 16.82 | 28.40 |
| High Arch (5) | 19.32 | 4.46 | 15.61 | 26.92 |
p-value calculated by ANOVA
Comparison of the above mentioned parameters with males and females separately did not show any statistical significance.
Discussion
Different types of foot are associated with differences in foot function [15]. This is one of the important factors contributing for development of different types of foot pathologies like gait abnormalities, pain in sinus tarsi etc., [16]. Adults with flat foot are also more prone to develop osteoarthritis [17]. Weight of an individual is an important factor for development of various foot types as the main function of an arched foot is to transmit the load from body weight to different parts of the foot during different stages of the walk cycle [15]. The anthropometric measurements like height, weight and BMI are age dependent. Age specific representation of association of foot types with the different parameters is therefore important.
In the present study, the mean weight of the participants with flatfoot (65.38±13.56 kg) was significantly higher than those with high arch (49±15.39 kg), p-value=0.05. Since BMI is as better index than weight alone to delineate overweight and obese from non-overweight subjects [17], in the present study we tried to find any significant association between BMI and different types of foot.
The relationship between BMI and different types of foot has been described in literature but the results shown in different studies are highly variable. Redmond AC et al., have done a meta-analysis to find the relation of BMI with foot posture [18]. Observations of 1648 participants from 16 studies were analysed. BMI data was available for 1101 participants. The classification into different types of foot was done using another index called the Foot Posture Index (FPI). Analysis of the data for any relationship between BMI and FPI revealed no significant correlation (r=0.026, p-value- 0.574).
In the present study, the mean BMI of the normal, flat foot and high arch foot group were 22.99±4.28, 23.02±3.78 and 19.32±4.46 respectively. Similar to the above mentioned study, no significant correlation could be established between BMI and different types of foot (p-value- 0.16).
Evan AM et al., in their study on 140 children observed that 31 had flat foot [19]. Out of them five children were overweight. A negative correlation was observed between BMI and flat foot (it implies that the prevalence of flat foot decreases with increase in BMI). Classification of different types of foot was done by them using FPI. They have attributed this negative correlation to sample size, subject ethnicity and assessment method of foot type, but this warrants the need for further studies to find the exact reason.
Unlike the above mentioned studies others have shown positive correlation of BMI with foot type [Table/Fig-5].
Different studies showing significant positive correlation of BMI with foot posture [20-23].
| Study | Place of Study | Age Group | No. of Subjects | Result |
|---|
| AlAbdulwahab SS et al., [20] | Saudi arabia | 24.3±6.4 years | 39 | Overweight BMI influences foot posture alignment and body stability (p=0.001) |
| Enrrique VA et al., [21] | Bogotta, Barranquilla | 3-10 yrs | 940 | Overweight is a risk factor for development of flatfeet (p=0.003) |
| Nieto ML et al., [22] | Spain | 11.6±0.5 yrs | 26 | Overweight girls showed flatter feet than normal weight ones (p=0.06) |
| Mickle MJ et al., [6] | Australia | 4.3±0.9 yrs | 19 | Overweight and obese children displayed a significantly lower plantar arch height (p=0.04) |
| Pfeiffer M et al., [7] | Austria | 3-6 yrs | 835 | Prevalence of flat feet is highly significant in overweight children (p<0.05) |
| Present study (2014) | India | 18-24 yrs | 250 | Prevalence of different foot types did not significantly relate with BMI |
This is in contrast to the present study where no such significant relation was observed between BMI and foot type. This difference in observation could be attributed to the age group studied. Most of the above mentioned studies were done on children. Influence of BMI on types of foot is observed more significantly in younger age as it is established in a study done by Deshmandi H et al., on 1180 students [23]. In a footprint based analysis, they showed significant correlation between BMI and flat foot in age group of 12-15 years but in 16-17 years age the correlation was insignificant. This difference was attributed to increase in temporary body mass which usually occurs during pubertal age group (12-15 yrs) causing the significance in the prevalence of flat foot and BMI in 12-15 years age group and the lack of significance in 16-17 years of age.
In the present study, the overweight and non-overweight subjects were not evenly distributed. Only 27% of the subjects were overweight or obese. This could be another factor for the non-significant relation of BMI with types of foot apart from the age group of study subjects. Future studies can be done in various age-matched groups having a specific deformity of foot.
Conclusion
Based on the data in the present study it could be concluded that there is a significant effect of weight of an individual in development of different types of foot posture. That is, individuals with more weight had a tendency of low arch foot in young adult age group. Such data carry very important significance in designing of foot wear for different foot types and also during treatment of symptomatic foot types. It was also noted that types of foot may not be significantly influenced by the BMI of an individual. But as the foot posture depends on factors like ethnicity and age, further studies with a larger sample size in the same age group is warranted.
p-value calculated by ANOVA
p-value calculated by ANOVA
p-value calculated by ANOVA