The most chronic inflammatory arthropathy worldwide is Rheumatoid Arthritis (RA). According to National Health Interview Survey (NHIS) survey 15% of world population is suffering from arthritis [1]. In India 4 to 6% of population (mostly women) over the age of 50 are affected by this disorder. Even children up to 17 years of age are affected by RA. It is the third most common type of arthritis [2]. RA progression may lead to functional disorders due to joint deformation if left untreated. Therefore, early diagnosis of the disease is helpful to prevent joint damages by initiating the treatment at an early stage. The primary rheumatoid arthritis signs include: joint swelling, stiffness, pain and redness [3,4].
The clinical signs are observed via physical inspection, Blood test and imaging techniques like X-ray, MRI, CT and ultrasound. The technological advancement in imaging modalities has reported that MRI shows good response in detection of RA, but need more acquisition time and the procedure is expensive. It can be avoided by ultrasound imaging modality. Out of all, Ultrasound (US) imaging is most preferred due to low cost, less harmful and ease of availability [5,6].
The gray scale ultrasound imaging aids in assessing activity of disease condition through classification of synovitis and able to estimate synovial proliferation, initial synovitis or an existing one, degree of effusion and even signaling the abnormality stage [7]. The variation of gray shades in ultrasound image represents soft tissues, bone and synovial region.
In the search for literature, few works were found which utilized histogram as a tool to detect, analyse and measure different musculoskeletal diseases in different imaging modalities. To quote a few, the work by Mendonça JA states the usage of colour histogram for assessing the joint damages, Stachowiak GW et al., used histogram as a tool to detect and predict osteoarthritis in knee [8,9]. In 2017, Chandran S used histogram to identify knee attrition in MRI images [10]. Tiulpin A et al., have localized the joint region automatically using histogram [11]. Gornale SS et al., determined osteoarthritis using histogram and SVM [12].
The main aim of this study was to apply histogram as a technique to classify the synovial region into different grades like Grade 0, Grade 1, Grade 2 and Grade 3 based on the severity of the disease.
The classification using histogram as a single tool is not specified in the literature, true to our knowledge. There is literature where histogram along with other technique was used for classification.
Materials and Methods
In this study data was used from the MEDUSA database which has 273 gray scale ultrasound images. The images in the dataset contain finger joints with different severity of rheumatoid arthritis. The MEDUSA database is obtained from Pol-Nor/204256/16/2013 which is a funded project from Norway Grants in the Polish-Norwegian Research Programme operated by the National Centre for Research and Development [13,14]. The dataset has annotated images in which the anatomical features like bone, joints and synovium are marked by a medical expert and test images (raw images without any annotations).
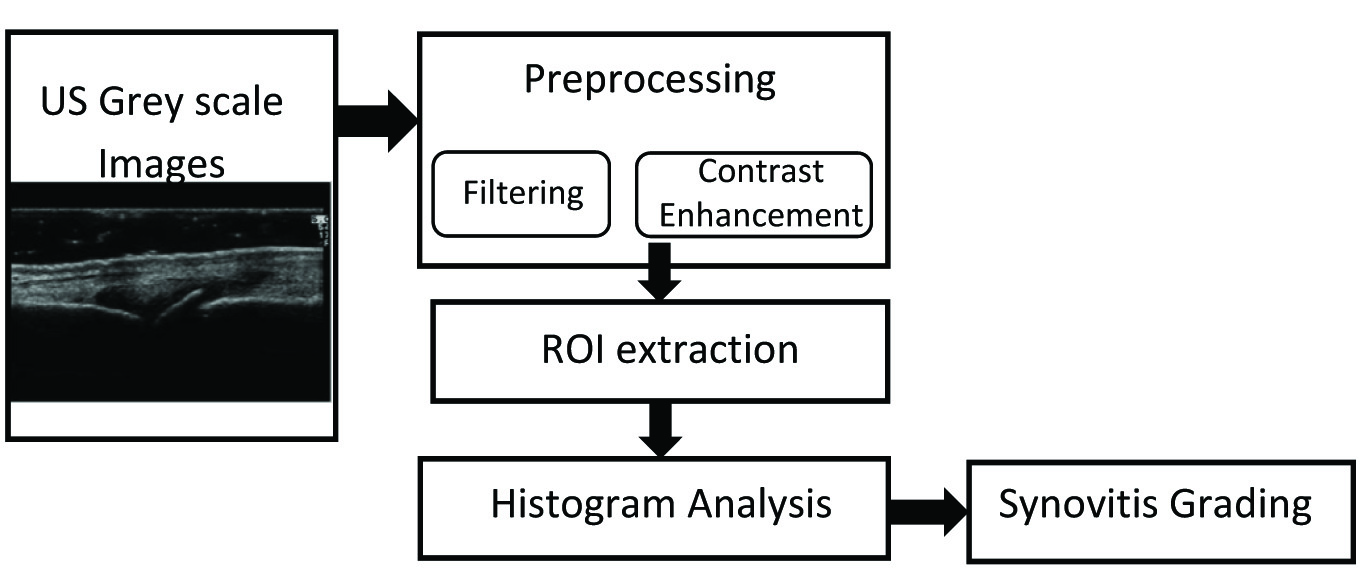
The methodology comprises of the following steps. First is Preprocessing and image enhancement where the speckle noise in the ultrasound image is removed by applying different filtering functions and the filtered image is further enhanced using Contrast Limited Adaptive Histogram Equalization (CLAHE) algorithm. Histogram analysis and feature extraction is performed to classify the images into different grades. All these steps were applied to annotated images and test images and a final comparison analysis was performed between these images. The flowchart is shown in [Table/Fig-1].
Process flow diagram.
ROI: Region of interest
Preprocessing
The preprocessing is the elementary and primary stage in image processing. The preprocessing section comprises both filtering and contrast enhancement. In ultrasound imaging the quality of the images are limited by speckle noise which is multiplicative in nature. The echogenic areas in ultrasound have granular appearance due to speckle which affects the visual observation and interpretation of the image [15,16].
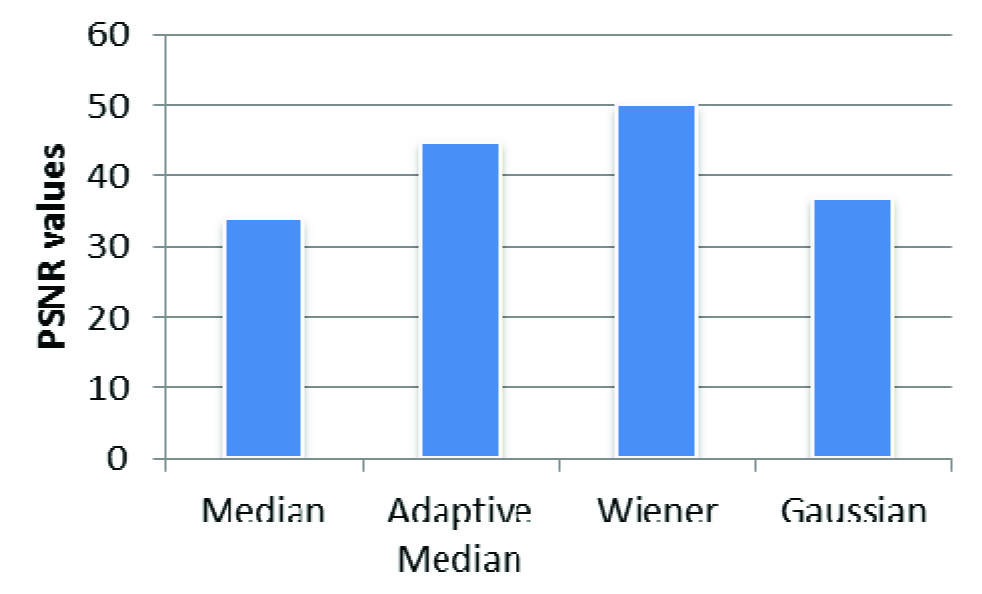
Image filtering helps in filtering the noises present in the image. Different filters such as median, average, Gaussian, wiener and adaptive median filter are applied to US images. Median filter is a nonlinear filter which calculates median value of nearby pixels and replaces each pixel with that value. This filtering technique has merit that it eliminates noise and mean while preserve edges where as Gaussian is a linear filter which removes noise but does not preserve the image details. The average filter is one of the simplest filtering methods which replace each pixel with average value of nearby pixel. Adaptive median is advanced version of median filter. Wiener filter is efficient in additive noise reduction [17]. By comparing all the filters based on PSNR (signal to noise ratio) value Wiener filter is best suited to remove speckle noise from US images. After noise removal the contrast of the image is enhanced using Contrast Limited Adaptive Histogram Equalization (CLAHE) method for better visual appearance and further analysis [18]. Using contour segmentation, the region of interest was extracted. Further histogram was applied to the extracted region.
Histogram
Histogram of an image shows frequency of intensity values of pixels. Histogram is graphical illustration of tonal delivery in an image and provides information about each tonal value. In a histogram the right side of horizontal axis indicates pure white areas; middle indicates grey and left indicates black or dark areas. Thus, histogram for very bright image has data points on right side and vice versa. In ultrasound arthritis image histogram represents number of occurrence of gray levels in synovitis region against gray level values of the image [19,20]. Histogram provides summary of intensities in particular area and understanding related to brightness and contrasts of synovial region, joint and bone. In the study, histogram was applied to reference image (images annotated by medical expert) and the test image images without annotation, the features extracted was compared for grading the image.
Histogram Features
Features such as mean, median and standard deviation were extracted from the histogram.
Performance Index
The results were evaluated by means of performance measures such as accuracy, specificity and sensitivity. These measures can be calculated on the basis of False Positive - are the negative results that were incorrectly labeled as positive (FP), False Negative- the positive results that were mislabeled as negative (FN), True Positive- the positive results that were correctly labeled by the classifier (TP) and True Negative- the negative results that were correctly labeled by the classifier (TN). Sensitivity indicates proportion of true positive- TP rate, while specificity indicates proportion of true negative – TN rate. Accuracy is percentage of correctly classified instances. Using the following formula Sensitivity, Specificity and Accuracy was calculated.
Sensitivity = TP/ (FN+TP) *100%
Specificity = TN/ (FP+TN) *100%
Accuracy = (TN+TP)/ (TN+TP+FN+FP)*100 %
Results
Preprocessing Results
The US images are more prone to speckle noise and of low contrast thereby preprocessing section plays significant role in image processing. Different types of filters such as mean, median, adaptive median and wiener are applied over the image data set. The performance of the filters are analysed by calculating PSNR value as shown in [Table/Fig-2]. The wiener filter provides promising results compared to other filters.
PSNR analysis for different filters.
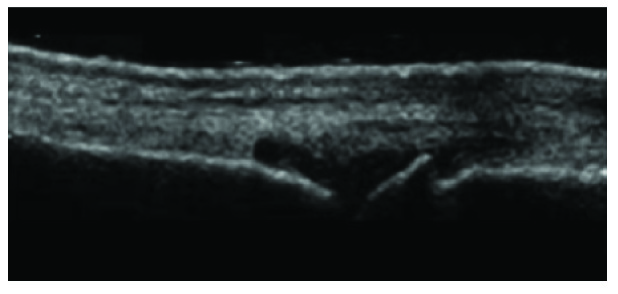
CLAHE contrast enhancement technique was applied to US image after Wiener filtering as shown in [Table/Fig-3]. It enhances contrast of synovitis region and the quality of the image is improved.
US image after filtering and contrast enhancement.
Histogram Analysis
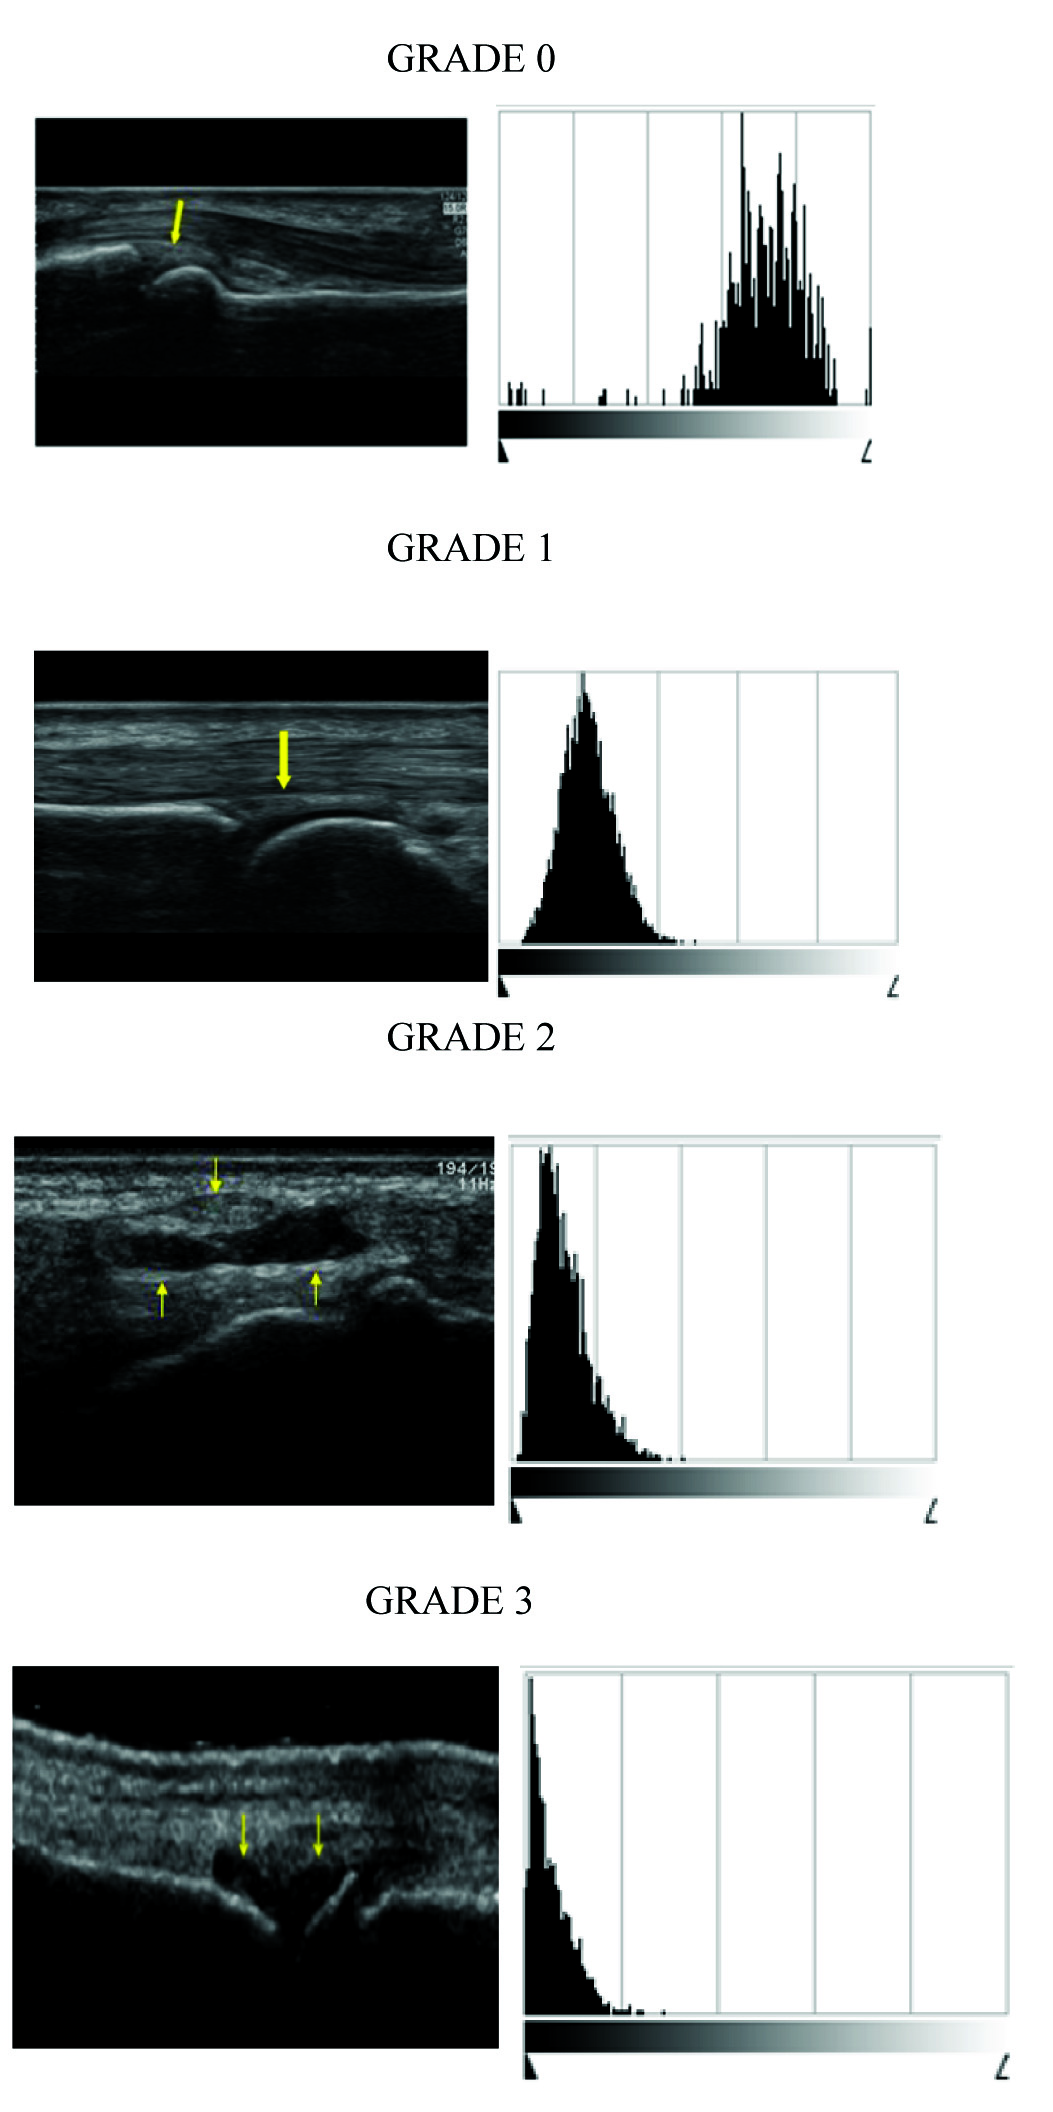
The histogram was applied to the preprocessed image and the respective histograms are shown in [Table/Fig-4]. The vertical axis indicates number of pixels and horizontal axis indicates tonal variations. The histogram is varying for different grades where Grade 0 has data points on right side and Grade 3 has data points on left side. This analysis leads to the conclusion that brightness of synovitis region gets reduced from Grade 0 to Grade 3.
US image and histogram for synovial thickness.
The yellow colour arrow shows the synovial region. The histogram for respective grades is shown. In each histogram the scale ranges from 0 to L (255). For grade 0 the histogram shows the distribution of pixels is more in the higher range. When the grade increases the distribution of pixel moves towards 0 range (lower level). This represents the severity of the disease.
The histogram feature parameters such as mean, median and standard deviation were calculated to identify the variation in different grades. The average values of histogram features are as shown in [Table/Fig-5]. Mean, median and standard deviation values are plotted for both annotated and test US images. The calculated features were almost matching for both datasets.
Histogram Average values for annotated and test US grey scale images.
| Grade | Annotated US images | Test US images |
|---|
| Mean | Median | Standard Deviation | Mean | Median | Standard Deviation |
|---|
| GRADE 0 | 148 | 148 | 27 | 152 | 150 | 30 |
| GRADE 1 | 71 | 72 | 22 | 72 | 70 | 23 |
| GRADE 2 | 25 | 31 | 16 | 23 | 30 | 18 |
| GRADE 3 | 16 | 16 | 10 | 14 | 18 | 12 |
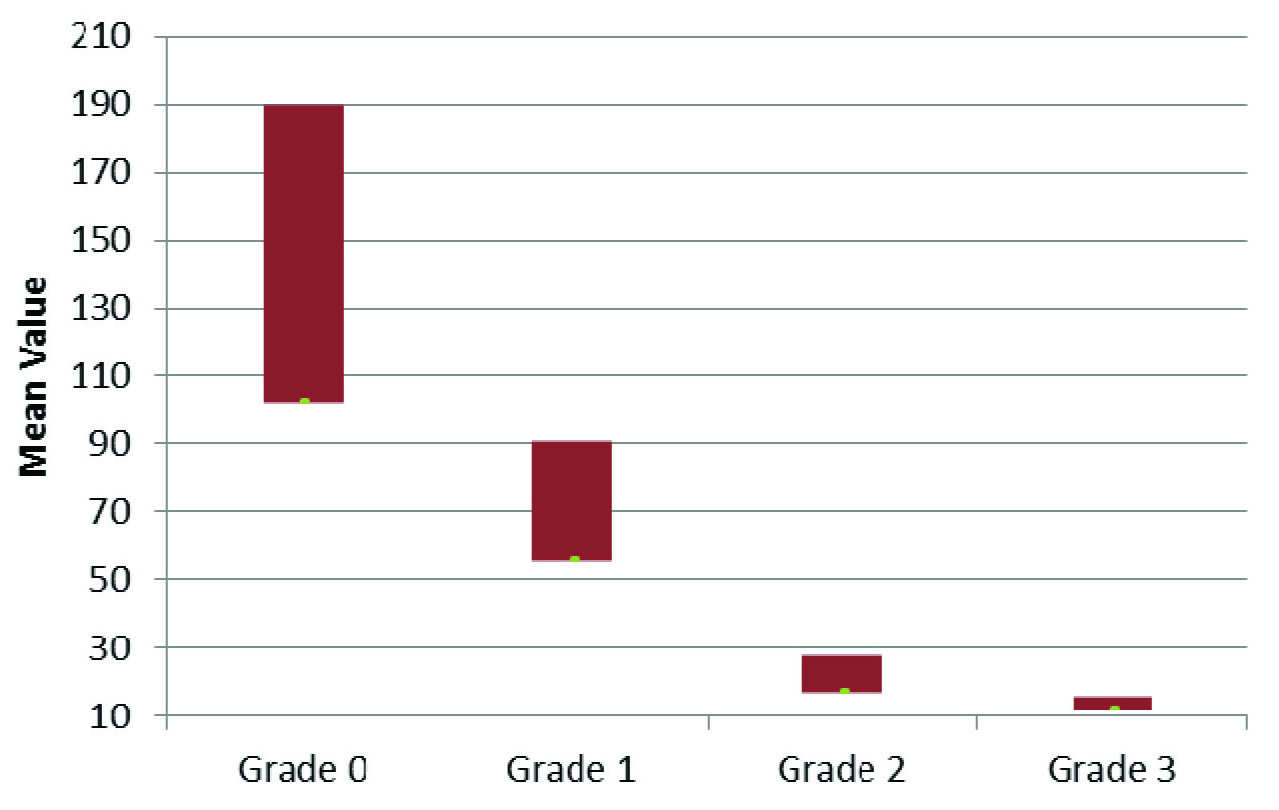
The mean value for different grades are shown in [Table/Fig-6]. For each grades mean variations are explained. Almost all images in particular grade have peculiar characteristics and mean value. Grade 0 shows high mean value compared to all and Grade 3 have low mean value. The mean value is exponentially decreasing from Grade 0 to Grade 1. The obtained mean ranges for Grade 0 is 190-102. Grade 1: 91-56, Grade 2 : 28-17, Grade 3: 16-12.
Mean value comparison for differrent grades.
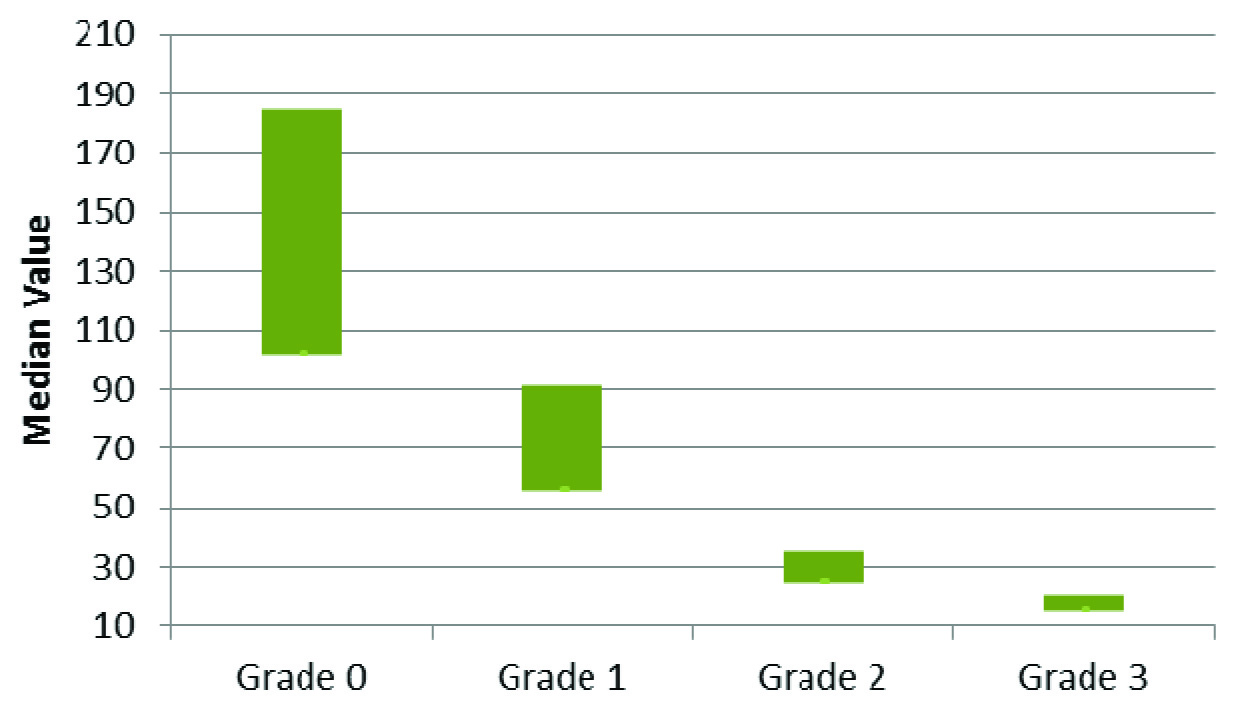
The median values were also calculated for different grades as shown in [Table/Fig-7]. These values ranges for Grade 0 is 185-102, Grade 1: 91-56, Grade 2: 35-25, Grade 3: 20-15. The above results shows that median is also a factor in synovitis scoring because it is varrying specifically for different grades. Grade 3 shows very low median value and indicates severe case of arthritis, but Grade 0 have high median values which is most probably taken as normal.
Median value comparison for differrent grades.
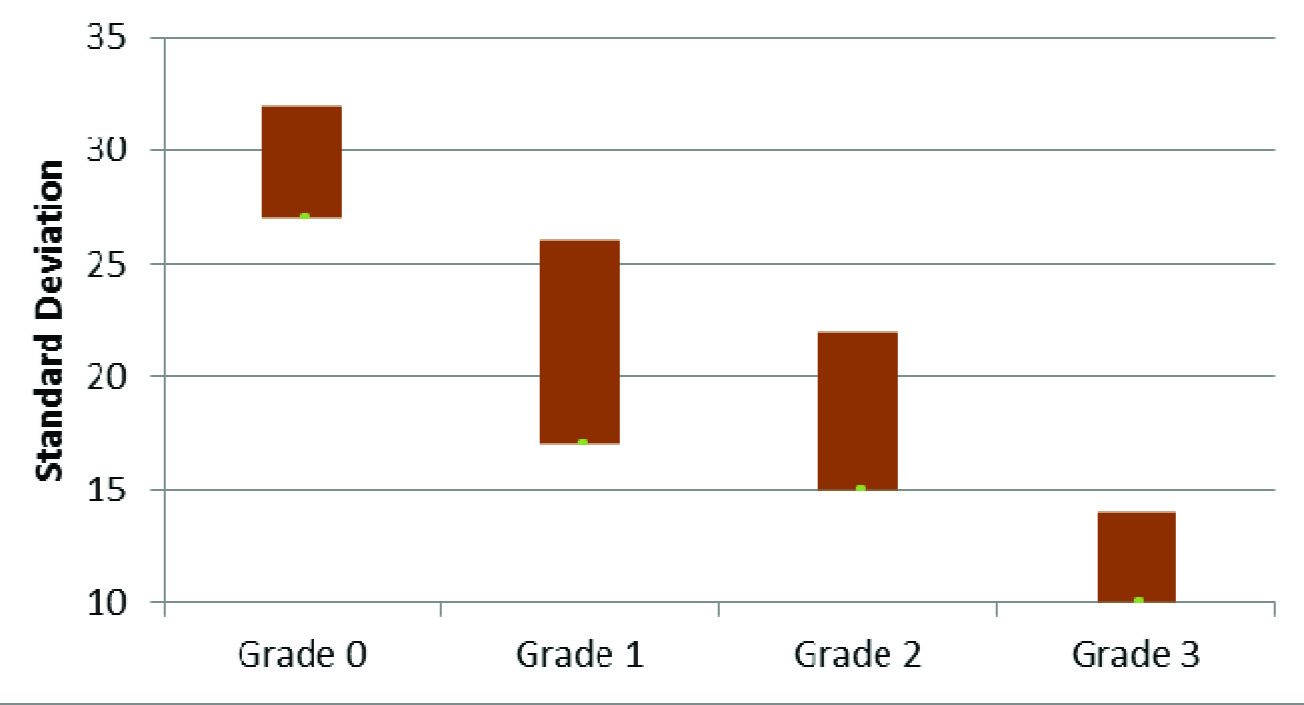
[Table/Fig-8] shows standard deviation comparison for various grades. Dissimilar synovitis images are checked for analysis and observed that standard deviation is less for Grade 3. The obtained outcomes are, Grade 0: 32- 27, Grade 1: 26-17, Grade2: 22-15, Grade 3: 14-10.
Standard Deviation value comparison for differrent grades.
Perfomance Evaluation
The perfomance of suggested system was evaluated by applying it on both annotated and test dataset. [Table/Fig-9] shows confusion matrix of system, in which TP, TN, FP and FN are calculated. The system provides 94% TP rate and 93% TN rate. The perfomance measures such as accuracy, specificity and sensitivity are obtained from the confusion matrix. The accuracy of system is 93.5%, specificity is 94% and sensitivity is 93%.
Confusion Matrix for proposed system.
| Actual | Predicted |
|---|
| Positive | Negative |
|---|
| Positive | True Positive (TP)94 % | False Positive (FP)6% |
| Negative | False Negative (FN)7 % | True Negative (TN)93 % |
Discussion
Compared to other imaging modalities, several studies have showed that ultrasound is a useful and safe imaging modality for assessing the abnormalities in the musculoskeletal diseases. The musculoskeletal ultrasound is extensively used for investigating the rheumatoid arthritis. US has more advantages like being safe, cost-effective and well received by patients. In future this technology has the potential to be used for diagnosing and monitoring the musculoskeletal diseases.
The assessment of the disease condition is based on the scoring system using histogram technique. Histogram reveals the distribution of the intensity levels in the region of interest. It has the potential to differentiate the inflammatory changes in the synovial region. There are several scoring techniques to grade the synovitis. Histogram is not only used for grading but it is used as segmentation tool, feature descriptor by calculating the gradients which is (HOG- histogram oriented gradients)
In the study, by Chandran S on Identification of Knee Bone Attritions in a DICOM MRI Using Histogram oriented gradients, Histogram Oriented Gradients (HOG) model was used for segmenting knee bone attritions in the MRI DICOM image. The proposed model has used HOG as a segmentation tool for extracting the knee bone attrition [10]. A similar technique (HOG) was used by Tiulpin A et al., to describe the knee joint shape features in a radiographic image. The author has combined HOG and SVM based scoring to localize joint area in plain radiographs [11].
In the study by Mendonça JA, a colour histogram was used to evaluate the structural damages in hand and knee joints [8]. The results of the colour histogram was not significantly correlating with the results of gray scale imaging. In 2016 Stachowiak GW has used X ray images to predict osteoarthritis in knee and hand [9].
Nakayama T et al., used histogram as an analysing tool for muscle CT images in patients with Duchenne muscular dystrophy. The peaks in the histogram showed a clear shift from muscle to fat region. Nakayama T et al., concluded that, procedure may be used as a simple method to evaluate fat substitution and motor disability of patients with Duchenne muscular dystrophy using CT [20].
Yang ZX et al., worked on feasibility of histogram analysis of susceptibility-weighted MRI for staging of liver fibrosis states that Susceptibility-Weighted Imaging (SWI) histogram analysis holds promise to provide a noninvasive quantitative method for staging liver fibrosis in patients with Chronic Liver Disease (CLDs). The histogram-derived parameters on susceptibility-weighted images (in particular, variance) as potentially useful biomarkers for predicting stages of liver fibrosis [21].
The previous works showed that histogram has been used as a technique to grade, segment, and as a feature descriptor. The histogram was applied to different modality of images like radiographs, MRI, CT for different disease conditions in different organs. In the present study the histogram as single tool to grade the synovial region of the finger joint affected by rheumatoid arthritis in ultrasound images was used. With a simple technology approach the images were graded based on the degree of inflammation in the joint region.
Limitation
The musculoskeletal ultrasound scanning system includes high degree of operatory dependency which highly affects the quality of the images obtained. This in turn leads to issues in acquiring and interpreting scans. As the MSUS involves high frequency sound waves for imaging the musculoskeletal details at a depth of more than 5 cm cannot be captured. This becomes a disadvantage for imaging deeply seated joints in obese patients. In clinical practice there is a possibility for intermachine variability issue which is not addressed in the current study. This issue mainly prevails in multicenter trials as the quality of machines varies. This can be minimized by examining the patients with same equipment.
Conclusion
Ultrasound image of synovial thickness is an important tool in identifying early stages of rheumatoid arthritis. The thickening is different for various stages of disease. An effective scoring system can aid in diagnosis of RA. The proposed system, first preprocess the synovitis image using different filtering techniques, compared and observed that wiener shows better performance. The histogram based scoring approach gives gray level variations in US image. Based on this mean, median and standard deviations are calculated. Average value of all these parameters are very high in case of Grade 0 (which indicates normal) and very low for Grade 3. The outcome of suggested system demonstrates effective and satisfactory performance for different set of synovitis images of RA patients. The performance evaluation of system shows 93.5% accuracy results, 94% specificity and 93% sensitivity which imply the system can be applicable in early detection of RA.