Osteoporosis has probably existed throughout human history but only recently it has become a major clinical problem due to lifestyle modification and dietary habits [1,2]. In the early 19th century, Sir Astley Cooper, an English surgeon, noted that bones acquire “the lightness and softness during the advanced stages of life” [3]. In western countries, women suffering from osteoporosis are more than men, probably due to the effect of menopause [2]. But in Indians the occurrence of osteoporosis in men is higher than in women. This is probably due to the likelihood of men seeking hospital attention and lack of awareness in postmenopausal alterations among women [4]. Apart from financial costs, fracture often affects mobility, leading to loss of confidence, quality of life and increasing the risk of premature death [5,6].
The major factors contributing to the deficiency of Vitamin D are inadequate dietary consumption, decreased synthesis from the skin, interference in the pathway of active vitamin D production and mutation in the receptor leading to poor bone health [7,8]. The serum 25 (OH) vitamin D status were categorised as deficient- <20 ng/mL, insufficient- 20 to 30 ng/mL, sufficient- >30 ng/mL and Toxic- >100 ng/mL [9]. The BMD by DEXA [10] determination is the advanced technology used in the diagnosis of osteoporosis. A very low BMD is considered as possible element for fracture but it is also useful in identifying those people with high risk of fractures. The WHO criteria for screening of osteoporosis in postmenopausal women based on DEXA T-score of BMD, “as normal bone mass=above -1 SD, osteopenia=between -1 and -2.5 SD and Osteoporosis=below -2.5 SD” [11,12]. The main aim of the study was to determine the efficacy of vitamin D in identifying the stratification of the disease as well as stage of BMD in both sexes.
Materials and Methods
The case control study was carried out in the Department of Biochemistry, Sri Ramachandra Medical College and Research Institute during the period of August 2016 to September 2017. The study was approved by the institutional ethics committee. The written informed consent was obtained from all the study participants.
Study Participants
The individuals attending orthopaedics, endocrinology, geriatrics OPD and master health check-up programme who were referred further for BMD measurements to the DEXA scan were enrolled in the study.
Study Design
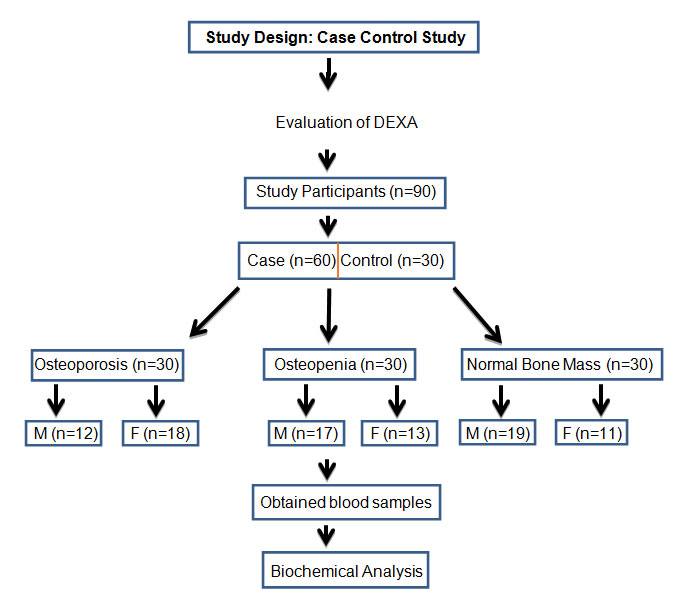
[Table/Fig-1] shows the schematic representation of study design and sample distribution. The suspected patients and controls voluntarily participated for BMD measurement of lumbar spine and neck of femur bone by DEXA scan. The total number of study participants (n=90) were categorised according to the DEXA T score of BMD. They were grouped as group I-Normal bone mass (n=30), group-II Osteopenia (n=30) and group-III Osteoporosis (n=30). The blood samples were subsequently collected and analysed for biochemical parameters.
Study design and sample distribution.
Exclusion Criteria
Patients with malignancy, stroke, hemi/paraplegia, chronic kidney and liver disease, rheumatoid arthritis, ankylosing spondylitis, hyperparathyroidism, thyroid disease, chronic smokers, cases of organ transplantation and bed ridden patients, patients on drugs-steroids, Immunosuppressive therapy, antiepileptic’s, bisphosphonates, vitamin-D, calcitonin and teriparatide.
Detailed history of demography, diet, exercise, smoking, menstrual history, medication and history of previous fractures and family history of bone disease were taken.
BMD Measurement
The BMD was determined at the neck of femur (left hip) and lumbar spine (L1-L4) by DEXA densitometer (GE Lunar Prodigy., Advance Bone Densitometer., US). BMD values were expressed as the amount of bone mineral content per cm2 area. The T-score was determined based on WHO definition of osteoporosis and osteopenia for Caucasian women: Normal=T-score at or above -1.0 SD; Osteopenia=-1.0 to -2.5 SD; Osteoporosis=T- score at or below -2.5 SD.
Anthropometric Characteristics: Body Mass Index (BMI), Weight in kg, Height in m2 and waist-to-hip ratio, waist circumference in cm, hip circumference in cm was determined according to the standard procedure.
Biochemical Analysis: The venous blood (5mL) was collected after overnight fasting. The serum was separated and analysed for the biochemical parameters-25(OH) vitamin D by chemiluminescence microparticle enhanced immunoassay (CMIA) method (Unicel DXI 600., Access Immuno Assay system., BECKMAN COULTER., US) and the CRP by particle enhanced turbidimetric immunoassay (PETIA) method, calcium by O-Cresolphthalein complexone method, phosphorus by Fiske and Subbarow method and ALP by pNPP-AMP method (AU680., Chemistry system BECKMAN COULTER., US).
Statistical Analysis
The obtained data were analysed by one way ANOVA using SPSS software, version 20 (IBM SPSS Statistics, 20., US). The p-value <0.05 is considered significant.
Results
The characteristics (anthropometric, biochemical and DEXA findings) of group I, II and III are shown in [Table/Fig-2]. The mean age of group-I, group-II and group-III participant were 59, 55 and 56 years respectively. In the anthropometric data, the BMI of Group-II (osteopenia) was highest with mean value (26.8±5.2) compared with group-I (24.2±3.6) and group-III (23.5±4.9) and the BMI demonstrated a statistically significant (p=0.013) difference among the three groups. There was not much difference in waist hip ratio in group-I (1.01±0.04), group-II (1.04±0.06) and group-III (1.0±0.06). The serum calcium (p=0.003) and 25(OH) vitamin D (p=0.009) levels were statistically significant when compared between the three groups. There was no statistical significance difference observed in CRP, ALP and phosphorous. The mean level of BMD, T-score of neck of femur and lumbar spine showed a statistically significant difference (p<0.001) between the groups.
Shows the mean, SD and significance levels of anthropometric, biochemical and DEXA findings compared among the three groups and one-way ANOVA is used to identify the p-value.
| Characteristics | Group I (N=30)Mean±SD | Group II (N=30)Mean±SD | Group III (N=30)Mean±SD | p-value |
|---|
| Age (Years) | 59±10 | 55±11 | 56±9 | 0.190 |
| BMI(kg/m2) | 24.2±3.6 | 26.8±5.2 | 23.5±4.9 | 0.013* |
| WHR | 1.01±0.04 | 1.04±0.06 | 1.0±0.06 | 0.085 |
| CRP (mg/dL) | 0.4±0.5 | 0.39±0.63 | 0.57±0.3 | 0.304 |
| ALP (U/L) | 95.7±18.9 | 90.6±29.8 | 100.1±38.6 | 0.477 |
| Calcium (mg/dL) | 9.5±0.3 | 9.2±0.33 | 9.03±0.5 | 0.003* |
| Phosphorus (mg/dL) | 4.1±0.2 | 3.8±0.27 | 3.7±0.4 | 0.079 |
| Vit. D (25OH) (ng/mL) | 23.5±6.6 | 21.9±8.9 | 17.3±8.1 | 0.009* |
| NF-BMD(g/cm2) | 1.07±0.1 | 0.87±0.09 | 0.82±0.06 | <0.001* |
| NF-BMD T score | +0.07±0.8 | -1.3±0.6 | -2.7±0.5 | <0.001* |
| LS-BMD (g/cm2) | 1.27±1.1 | 1.07±0.1 | 0.82±0.07 | <0.001* |
| LS-BMD T score | +0.6±0.8 | -1.0±1.1 | -2.9±0.32 | <0.001* |
The p<0.05 was significant*
BMI: Body mass index; WHR: Waist to hip ratio, CRP: C reactive protein; ALP: Alkaline phosphatase; Vit.D: Vitamin D; NF-BMD: Neck of femur bone mineral density; LS-BMD: Lumbar spine bone mineral density
In our study population females had high prevalence of osteoporosis i.e., 18(60%) and male to female ratio was 0.7:1. In osteopenia the prevalence rate was increased in males 17(56.7%) and male to female ratio was 1.3:1 as presented in [Table/Fig-3].
Shows the distribution of male and female among the three groups.
| Category | Malen (%) | Femalen (%) | M/F ratio |
|---|
| Group-I | 19 (63.3) | 11 (36.7) | 1.7:1 |
| Group-II | 17 (56.7) | 13 (43.3) | 1.3:1 |
| Group-III | 12 (40) | 18 (60) | 0.7:1 |
[Table/Fig-4] summarises the 25(OH) vitamin D status in normal bone mass, osteopenia and osteoporosis group. The percentage of 25(OH) vitamin D deficiency was found to be higher 19(63.3%) in osteoporosis group. While the percentage of insufficiency rate 13(43.3%) was higher in osteopenia.
Shows the 25(OH) vitamin D status among the three groups.
| 25(OH) Vitamin D Status | Group-In (%) | Group-IIn (%) | Group-IIIn (%) |
|---|
| Sufficiency (30-100ng/mL) | 13 (43.3) | 6 (20) | 2 (6.7) |
| Insufficiency(20-30ng/mL) | 12 (40) | 13 (43.3) | 9 (30) |
| Deficiency (<20ng/mL) | 5 (16.7) | 11 (36.7) | 19 (63.3) |
Discussion
This study focuses mainly on comparison of BMD with 25(OH) vitamin D status in male as well as female adult population with osteoporosis. We found that the 25(OH) vitamin D deficiency rate was higher in osteoporosis 19(63.3%) when compared with the other groups.
In a previous study it was observed that the maximum bone mass was obtained at the age of 30 years beyond which the bone demineralization rate is increased [6]. In contrast to the above study, in our study population maximum bone mass was observed at the age of 36 years.
Vitamin D and calcium are essential to maintain BMD and good bone health [13,14]. The established reports indicate that severe deficiency of vitamin D reduces the absorption of calcium which leads to low bone mass [15]. We found that low baseline levels of serum calcium (9.03 mg/dL±0.5) and 25(OH) vitamin D (17.3 ng/mL±8.1) were potentially associated with very low BMD (NF = 0.82±0.06, LS = 0.82±0.07) in osteoporosis. In osteopenia group we observed that mean levels of serum calcium (9.2 mg/dL±0.33) and 25(OH) vitamin D (21.9 ng/mL±8.9) levels were significantly associated with low BMD (NF = 0.87±0.09, LS = 1.07±0.1). Sahota O et al., reported that calcium and vitamin D supplementation reduces the age related bone loss, improves the good bone health and prevents the risk of fractures [16]. In our study findings it was reported that calcium and vitamin D deficiency decreases the BMD. Therefore, our study gives an additional support to the report of Sahota O. There was no significant association in serum phosphorus levels between the groups. The ALP and CRP mean levels are slightly elevated in osteoporosis than other groups but there is no statistical significant difference.
Various epidemiological studies [17-19] have reported vitamin D deficiency in post-menopausal women, female population and elderly people [20]. Hence, our study focuses the relation of BMD with vitamin D in the male population as well.
Deng W-M et al., reported that insufficiency of vitamin D is common in postmenopausal women but no one has to monitor the insufficiency level, which is the major health problem in women [9]. Gill TK et al., has found that the prevalence of Vitamin D (25OH) deficiency in women was 26.8% and in men it was 18.5% [20]. According to our study, the 25 (OH) vitamin D insufficiencies in osteopenia were found to be higher 13(43.3%) and the deficiency was higher in osteoporosis group 19(63.3%).
Bandeira F et al., reported that vitamin D (25 OH) deficiency was associated with lower BMD at neck of femur [21]. Labronici PJ et al., found that 91.1% of patients (osteopenia) have low BMD associated with least vitamin D levels and 19(62.5%) of patients with osteoporosis have low BMD associated with vitamin D deficiency [11]. In concordance with above studies the low BMD and 25 (OH) vitamin D insufficiencies is highly associated in osteopenia. The deficiency of 25(OH) vitamin D was found to be higher in osteoporosis.
The findings of our study reveal that BMI was higher in osteopenia group (26.8±5.2) when compared with the other two groups, whereas group III (23.5±4.9) showed least BMI.
Limitation
The vitamin D and BMD assessment were done on a single visit and follow up of the patients who are on treatment was not carried out.
Conclusion
Decreased BMD is the principal factor in the development of osteoporosis. The serum calcium and vitamin D may suggest their link with bone remodelling process. Any alteration in these two may affect bone remodelling in the pathogenesis of osteoporosis. Hence monitoring the insufficiency of 25(OH) vitamin D would provide a better insight into the progression of disease. The 25 (OH) vitamin D status suggest the stage of BMD. Therefore, routine screening of vitamin D deficiency along with the insufficiency may be helpful in identifying the osteoporosis at an earlier stage.
The p<0.05 was significant*
BMI: Body mass index; WHR: Waist to hip ratio, CRP: C reactive protein; ALP: Alkaline phosphatase; Vit.D: Vitamin D; NF-BMD: Neck of femur bone mineral density; LS-BMD: Lumbar spine bone mineral density