Sleep is a physiological process considered essential for life. It is important for growth, repair, learning and consolidation of memory [1,2]. Sleep duration is a significant determinant of body composition besides conventional factors like physical activity, dietary habits and genetic inheritance [3,4]. On an average, adults need 7-9 hours of sleep each night whereas teenagers and infants need 9.5 hours and 16 hours per day respectively [5]. Studies have reported that obesity, from sleep deprivation, is a result of interplay of several factors like changes in the eating pattern with a stronger preference for fatty foods, increased opportunities for snacking and late-night meals [6,7].
How sleep curtailment may interact with body weight is unknown, but hormones regulating appetite and energy expenditure may be involved. Ghrelin and leptin are two hormones that may play a significant role in interaction between short sleep and high BMI [8].
Longer sleep duration is seen to be associated with lower adiposity indicators, better emotional regulation, better academic achievement and better quality of life [9].
An important barrier to healthy sleep hygiene is the fact that sleep generally is perceived as a waste of time [10]. Our socio-cultural environment does not promote healthy sleep habits and people living in a 24/7 society place sleep low on their priority [10].
Few studies have examined the association in a representative sample of young adults [11-13]. This age -group merits attention, as the transition to adulthood is associated with important changes in personal circumstances and behaviour that may impact both sleep and BMI such as changes in level of physical activity, diet and social structures [11].
Hence in this study, an attempt was made to study the effect of duration of sleep and physical activity on various anthropometric parameters.
Materials and Methods
The study was conducted at the Department of Physiology of a Government Medical College over a period of two months between July-August 2017. It was conducted following approval from ICMR under their STS program for MBBS students.
It had total 408 subjects of both sexes aged between 18-25 years. The purpose of the study was explained to all the subjects and written informed consent was taken from each of them. The project was started after taking clearance from the Institutional Ethical Committee following approval from ICMR. The subjects were selected from the staff and students of the college.
Inclusion criteria: Healthy young adults of both the sexes aged between 18 to 25 years.
Exclusion criteria:
History of any chronic metabolic or debilitating disease
History of alcoholism, hypertension
Genetic predisposition towards obesity
Eating disorders like anorexia nervosa
History of abnormal thyroid status-including both hypothyroidism and hyperthyroidism.
Sleep Duration: A standard sleep questionnaire was used to obtain information about the different parameters of sleep. The subjects were asked about the usual time they went to bed and woke up on weekdays and weekends separately. They were also questioned on the number of minutes they spent napping on weekdays and weekends separately. Average sleep duration was calculated (in hours) as the difference between self-reported bedtime and wake-up time for weekdays and weekends separately.
Average sleep duration = weekday duration X 5/7 + weekend duration X 2/7
The participants were divided into two groups based on their average sleep duration:
Group 1 (IASD-Inadequate sleep duration) – Those having average sleep duration of < 7 hours/ day (n=254)
Group 2 (ASD-Adequate sleep duration) -Those having average sleep duration of ≥ 7 hours /day (n=154)
Epworth Sleepiness Scale:
Daytime sleepiness was assessed using the Epworth Sleepiness Scale [14]. It is a simple, self-administered questionnaire having total 8 items. The maximum score possible is 24, with higher scores reflecting higher levels of sleepiness.
Sleepiness is assessed using a 4-point Likert scale referring to an individuals’ likelihood of dozing off in that situation
0 = would never doze off
1= slight chance of dozing
2= moderate chance of dozing
3= high chance of dozing
General Practice Physical Activity Questionnaire (GPPAQ)
The GPPAQ is used as a brief measure of physical activity in adults aged between 16-74 years [15]. It is designed to take less than a minute to complete and groups subjects into four categories:
Inactive;
Moderately inactive;
Moderately active;
Active.
Anthropometry:
The following anthropometric measurements were done in each of the subjects:
1) Height (in cm) – height was measured using a standard meter scale in the standing position without footwear to the nearest 0.5 cm
2) Weight (in Kg)- weight was measured with minimum clothes using an electronic scale to the nearest 0.5 kg
3) Waist Circumference (WC) – it is the minimum circumference between the costal margin and the iliac crest, measured in the horizontal plane with the subject standing
4) Hip Circumference (HC) – it is the maximum circumference in the horizontal plane measured over the buttocks
5) Waist/Hip ratio (W/H ratio) – ratio of the waist and hip circumference
6) Body Mass Index (BMI) – using the Quetlet Index - weight (Kg)/ height (in m)2
The revised BMI cut-off for Asians recommended by WHO was used to classify the subjects as normal weight, overweight and obese [Table/Fig-1] [16].
Cut-offs of obesity and abdominal obesity for Asian Indians [16].
| Variable | Consensus guidelines for Asian Indiansa |
|---|
| Generalized obesity | Normal: 18.0-22.9 |
| BMI cut-offs in kg/m2 | Overweight:23.0-24.9 |
| Obesity > 25 |
| Abdominal obesity (Waist circumference cut-offs in CMS) | Men > 90bWomen>80b |
a-From consensus guidelines for Asian Indians
b-According to Modified National Cholesterol Education Program, Adult Treatment Panel III guidelines
Statistical Analysis
All statistical analysis was done using SPSS software version 21 for windows (SPSS, INC, Chicago, IL). The results have been presented as mean±SD and in percentages. ‘t- test’ and ‘Chi-Square test’ were used to compare the data between the two groups. Correlation was done between the average sleep duration and the ESS score along with the anthropometric parameters – waist circumference, hip circumference, waist-hip ratio and BMI. ‘p value’ ≤ 0.05 was considered as significant whereas ‘p value’ ≤ 0.01 was highly significant.
Results
Total 408 subjects were included who were divided into two groups based on their sleep duration. [Table/Fig-2] depicts the mean sleep duration among the two groups. There was a statistically significant difference of sleep duration between two groups (p<0.001).
Mean sleep duration of the two groups.
| Groups | Sleep duration in hours | p-value |
|---|
| Mean | Std. Deviation |
|---|
| Group 1 (N=254) | 5.49 | 1.12 | <0.001** |
| Group 2 (N=154) | 7.79 | 0.48 |
| Total (408) | 6.36 | 1.45 |
** - p< 0.01 (Highly significant)
The age and sex distribution of the subjects can be seen in [Table/Fig-3]. Out of total 408 subjects in the study, 198 were males and remaining 210 were females.
Age and sex distribution of the subjects.
| Age (years) |
|---|
| Mean | Std. Deviation |
|---|
| Group 1 (N = 254) | 19.86 | 1.51 |
| Group 2 (N = 154) | 21.55 | 2.91 |
| Total (N = 408) | 20.50 | 2.29 |
| Sex | Total |
| | Male | Female | |
| Group 1 | No. | 132 | 122 | 254 |
| % | 52.0% | 48% | 100% |
| Group 2 | No. | 66 | 88 | 154 |
| % | 42.9% | 57.1% | 100% |
| Total | 198 | 210 | 408 |
| % | 48.5% | 51.5% | 100% |
The results of General Practitioners Physical Activity Questionnaire (GPPAQ) have been depicted in [Table/Fig-4]. The percentage of inactive participants among Group 1 was slightly higher as compared to group 2. This distribution was statistically non-significant (p>0.05).
Physical activity level of the subjects in the two groups.
| | GPPAQ – General practice physical activity questionnaire | Total |
|---|
| Inactive | Moderately inactive | Moderately active | Active |
|---|
| Group 1 | No. (%) | 20(7.9%) | 106(41.7%) | 122(48.0%) | 6(2.4%) | 254 |
| Group 2 | No. (%) | 14(9.1%) | 62(40.3%) | 68(44.2%) | 10(6.5%) | 154 |
| Total | No. (%) | 34(8.3%) | 168(41.2%) | 190(46.6%) | 16(3.9%) | 408 |
The ESS score of the two groups can be seen in [Table/Fig-5]. There was no significant difference between the two values (p-value > 0.05).
Epworth Sleepiness scale (ESS) scores among the two groups.
| Epworth Sleepiness Scale score |
|---|
| Mean | Std. Deviation | p-value |
|---|
| Group 1 (N = 254) | 8.83 | 3.85 | 0.48 |
| Group 2 (N=154) | 8.55 | 3.91 |
| Total | 8.72 | 3.88 |
NS – p> 0.05 (not – significant)
The distribution of subjects based on their BMI can be seen in [Table/Fig-6]. A much higher percentage in Group 1 was in the category of overweight and obese compared to Group 2.
Distribution of subjects based on their BMI in the two groups.
| | Body Mass Index | Total |
|---|
| <18.00 | 18.00-22.99 | 23.00-24.99 | ≥25.00 |
|---|
| Group 1 | No. (%) | 8(3.1%) | 134(52.8%) | 38(15.0%) | 74(29.1%) | 254 |
| Group 2 | No. (%) | 4(2.6%) | 94(61.0%) | 24(15.6%) | 32(20.8%) | 154 |
| Total | No. (%) | 12(2.9%) | 228(55.9%) | 62(15.2%) | 106(26.0%) | 408 |
All the anthropometric parameters were higher in Group 1 as compared to Group 2 except the W/H ratio [Table/Fig-7]. However, this difference was found to be statistically significant for the waist circumference, hip circumference, W/H ratio and BMI (p-value< 0.05)
Comparison of anthropometric parameters between the two groups.
| | Weight (Kg) | Height (cm) | WC (cm) | HC (cm) | W/H Ratio | BMI(Kg/m2) |
|---|
| Group 1(N=254) | Mean | 63.12 | 164.46 | 78.01 | 92.80 | .83 | 23.59 |
| SD | 13.60 | 9.32 | 10.90 | 9.18 | .05 | 4.90 |
| Group 2(N=154) | Mean | 62.09 | 163.43 | 75.83 | 88.19 | .85 | 22.44 |
| SD | 13.20 | 13.06 | 9.04 | 9.04 | .05 | 3.45 |
| Total(N=408) | Mean | 62.76 | 164.07 | 77.19 | 91.06 | .84 | 23.16 |
| SD | 13.45 | 10.88 | 10.28 | 9.38 | .05 | 4.44 |
| -value | 0.44 (NS) | 0.36(NS) | 0.04* | <0.01** | <0.01** | 0.01** |
NS – p> 0.05 (Not significant)
*- p< 0.05 (Significant)
** - p< 0.01 (Highly significant)
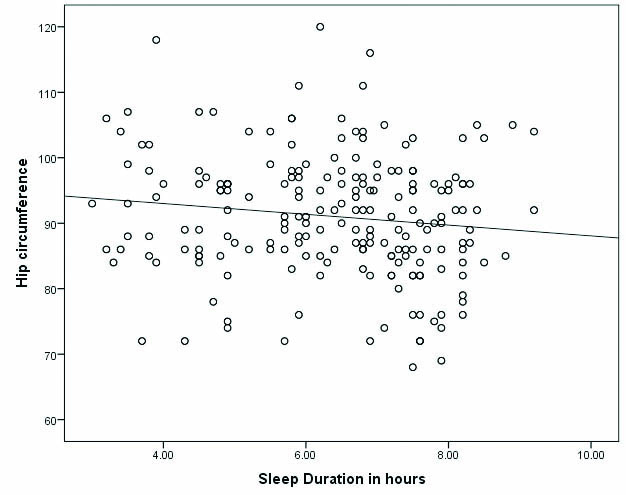
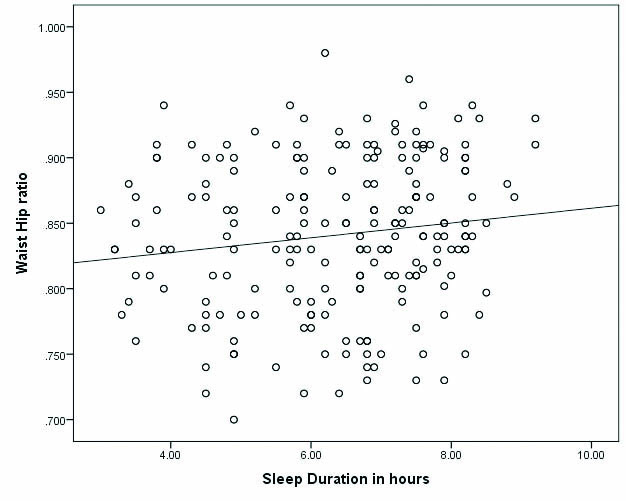
Correlation was done between the duration of sleep and ESS along with the various anthropometric parameters as can be seen in [Table/Fig-8]. Significant findings were seen for HC and W/H ratio only as has been depicted in [Table/Fig-9,10].
Correlation of sleep duration with ESS and anthropometry.
| ESS | WC | HC | W/H ratio | BMI |
|---|
| r-value | p-value | r-value | p-value | r-value | p-value | r-value | p-value | r-value | p-value |
| Sleep Duration | -0.01 | 0.86 (NS) | -0.04 | 0.45 (NS) | -0.13 | 0.01** | 0.14 | 0.004** | -0.08 | 0.10 (NS) |
NS – p >0.05 (Not significant)
** - p < 0.01 (Highly significant
Correlation between hip circumference and sleep duration.
Correlation between waist hip ratio and sleep duration.
Discussion
The aim of our study was to see how duration of sleep affects various anthropometric parameters in young Indian adults aged between 18-25 years. Total of 408 subjects were divided into two groups based on their average sleep duration per day. All the anthropometric parameters except the W/H ratio was found to be higher in Group 1 (inadequate sleep duration) in comparison to Group 2 (adequate sleep duration), however its statistical significance was seen for HC and W/H ratio.
Recent studies done on medical students in the context of sleep and its parameters have shown that medical students are at a higher risk of developing chronic insomnia and irregular sleep-wake cycles. They follow an erratic lifestyle and the time-consuming demands of medical studies tends to make them overweight and obese [17]. Similar findings have also been reported by Gopalkrishna et al., [12]. Modi et al., conducted a survey on medical students and found that sleep duration is a significant determinant of anthropometric parameters besides conventional factors like physical activity, dietary habits and genetic inheritance [13].
Our findings are in accordance with findings of other cross-sectional studies from diverse locations all over the world. Hairston et al., proposed that a sleep duration of five hours or less was associated with an increase in BMI along with visceral and abdominal fat accumulation [18].
Sleep curtailment is associated with decreased leptin levels and elevated ghrelin levels along with increased hunger and appetite. A link is also seen between sleep deprivation with insulin resistance and Diabetes Mellitus with which obesity shares so many risk factors [19].
Some of the factors contributing to inadequate sleep include societal and technological changes, increase in shift work, cable television, use of internet, 24-hour stores and dual income families. It is therefore possible that an even stronger association now exists between short sleep duration and obesity compared to earlier times [3].
In results from the “National Sleep Foundation 2012” poll, inadequate sleep was associated with irritability, pessimism and feeling of being tired and stressed [20]. These feelings and emotional state could lessen, one’s resolve and will-power to follow a diet and exercise regimen predisposing an individual to obesity.
Sleep deprivation due to voluntary bedtime restrictions has become a hallmark of modern societies which are rapidly getting imported to countries such as India [21]. Similar findings have been reported in similar age groups, as ours and in other countries as well [22,23]. It is well known that regardless of the fact whether sleep deprivation is acute or chronic in nature, both lead to appetite dysregulation and weight gain which in turn leads to insulin resistance causing Diabetes Mellitus [20].
A study conducted in Korea by Simon SL et al., stated that sleep restriction effects adolescents by increasing appetite for sweets/desserts that may contribute to weight gain [24]. In addition, students who sleep less tend to skip breakfast, leading to obesity. Hence, disturbance in the circadian rhythm may be another factor linking BMI and sleep duration [25].
Longer sleep duration reduces night time eating habits and helps the metabolism to function well, that may explain the association between duration of sleep and BMI. Insufficient sleep heightens the activity of the stress mechanism [26], which may influence eating behaviour and increase the secretion of cortisol, a hormone related to obesity [27]. Similar findings have also been reported in a Korean study conducted in the year 2017 [28].
Another study on medical students stated that self-imposed sleep curtailment is potentially important and a novel risk factor for obesity [29]. Sleep restriction has also been linked with altered food preferences in the absence of hormonal changes. Moreover, there are fast food restaurants around most of the educational institutions that also negatively impact eating behaviour [30]. Sleep restriction has also been linked to macronutrient intake and meal frequency. Students who sleep for less than 8 hours consume a higher proportion of calories from fat and a lower proportion from carbohydrates [31].
It has been seen that sleep, sedentary behaviour, physical activity and diet all interact and ultimately impact health [7]. Several studies have demonstrated an association between obesity and sleepiness [26,32]. Vgontzas AN et al., examined nocturnal sleep in the obese vs non-obese individuals, a group in which obstructed sleep apnoea, obesity hypoventilation, narcolepsy and other sleep disorders had been excluded [26]. The ESS score did not show any difference in the two, nocturnal sleep latencies did not differ and the obese subjects at night only had slightly greater wake after sleep onset time and slightly less REM sleep.
There are many potential explanations for sleepiness in obesity including co-morbidities, medication and metabolic derangements which render identification of factors contributing to excessive sleepiness more difficult [33].
A study was conducted in Pakistan to assess daytime sleepiness in medical students and to correlate the ESS with their mean sleep duration having similar findings as ours [34]. Similar findings have also been reported in an Indian study conducted in the year 2017 [35].
The present study did not show any significant correlation between sleep duration and BMI. One explanation could be that students who are enrolled in a professional course are likely to be physically active to meet the demands of everyday classes, practical work and all the shuttling between various classrooms and locations [36].
Limitation
The study sample size consisted of a representative sample of a single medical school which is not generalisable to the whole student population in all medical colleges of India. The use of self-administered questionnaire is an important limitation that may lead to a recall bias.
Our measure of sleep was based on a single self-report, which has shown to underestimate sleep duration, in comparison to maintaining sleep diaries and polysomnography.
Conclusion
Our study shows that the duration of sleep was significantly different between the two groups. Majority of the subjects were found to be moderately active in both the groups. All the anthropometric parameters except W/H ratio were higher in those getting inadequate sleep in comparison to those having adequate sleep; however its statistical significance could be established for WC, HC, W/H ratio and BMI. Duration of sleep was found to be negatively co-related with most of the parameters, but its significance could be established only for the HC and W/H ratio.
a-From consensus guidelines for Asian Indians
b-According to Modified National Cholesterol Education Program, Adult Treatment Panel III guidelines
** - p< 0.01 (Highly significant)
NS – p> 0.05 (not – significant)
NS – p> 0.05 (Not significant)
*- p< 0.05 (Significant)
** - p< 0.01 (Highly significant)
NS – p >0.05 (Not significant)
** - p < 0.01 (Highly significant