One of the main function of health care system lies in the provision of services based on the principles of equity, opportunity, effectiveness and safety for those using them. This is why guaranteeing quality fosters good care [1].
Hence, the concept of quality in health has become a subject of study, acquiring a special connotation for both individual and collective health services. This, in-turn led to the provision of services based on the best scientific evidence available and which seek to obtain desirable results in terms of health [2,3].
In this sense, health service quality refers to complying with a set of established regulations, which implies operation excellence and meeting the needs of those who demand such care, thus improving their health determinants [3,4].
Thus, quality management has increasingly become a constant challenge for health organisations, since it plays a key role in their development, success and sustainability [5]. Therefore, it is highly important to consider the fact that healthcare quality has two dimensions that make it possible to understand its complexity as a concept. The first dimension is technical quality; the second, functional quality [6]. The former refers to the processes related to patient clinical care, while the latter discusses aspects that are not associated with healthcare per se, i.e. the administrative elements involved in the provision of the service. Nevertheless, it must be noted that users, who do not know the difference between these concepts, normally perceive service quality from a purely functional perspective, which hinders their ability to perform an accurate assessment of the health services received [7].
Thus, after the contributions of Donabedian A, considered the greatest promoter of quality applied to health services [8], there have been other authors in recent years who are concerned with the approach to the concept of health service quality and consider the history, daily life and subjectivity of the users as variables of interest in their research [9].
Given the previously described scenario, building a bibliometric analysis is relevant, as it is considered a field of documentary science and an emerging research field that enjoys great credibility, thanks to its supporting mathematical and statistical tools. Furthermore, bibliometrics provides methods and techniques that generate detailed knowledge on the studied subject [10-12].
Bibliometric analyses can be grouped into two basic categories: those employing activity indicators, whose goal is to provide information on the volume and impact of research activities; and those using relationship indicators focused on analysing links and interactions between researchers and knowledge areas, which generate relevant information on the subject being studied [12].
Therefore, this was the context in which a bibliometric study of the scientific papers available in the SCOPUS database was conducted to analyse the existing scientific literature on service quality in healthcare institutions between 1994 and 2015.
Materials and Methods
A bibliometric study was conducted based on the data from academic publications indexed in the SCOPUS database between 1994 and 2015. SCOPUS was chosen because of its data management tools and compliance with other criteria such as its accessibility and the fact that the papers indexed by it, are among the most cited, so that makes it the most used tool for this kind of analysis [13].
In addition, the search equation was based on the subject of analysis of the bibliometric study. To achieve this, a combination of terms meaning “service quality in healthcare organisations” (i.e. hospitals, health * system, clinical service*) [14] were searched for, in the title and keyword fields with the temporal restriction between 1990 and 2015, but only articles related to specific issue since 1994 were reported. The following search equation was produced (* represents any type of characters, even zero, for example, health* returns healthy, health, healthiness): [TITLE {(service quality)} AND TITLE {(healthcare organisation*) OR hospitals OR (health* system) OR (clinical service*)}] OR [KEY {(service quality)} AND KEY {(healthcare organisation*) OR hospitals OR (health* system) OR (clinical service*)}].
Statistical Analysis
This equation retrieved 256 records of academic publications related to present topic, which were later processed and interpreted using Microsoft Excel and Data Analyser (a software by Thomson Reuters) to identify quantity and quality indicators. Furthermore, the CYTOSCOPE free software tool was used to calculate structure indicators [15].
Among the indicators calculated in this study, activity (quantity) indicators were found, which made it possible to visualise the actual state of art. Among these, the following indicators stand out: number, distribution, dispersion, productivity and collaboration in publications. On the other hand, there are impact indicators (quality), which aim to assess the incidence of authors, studies and/or academic sources in a specific area or discipline. Finally, there are structure indicators, which measure the connections between the different authors and publications [16, 17].
Results
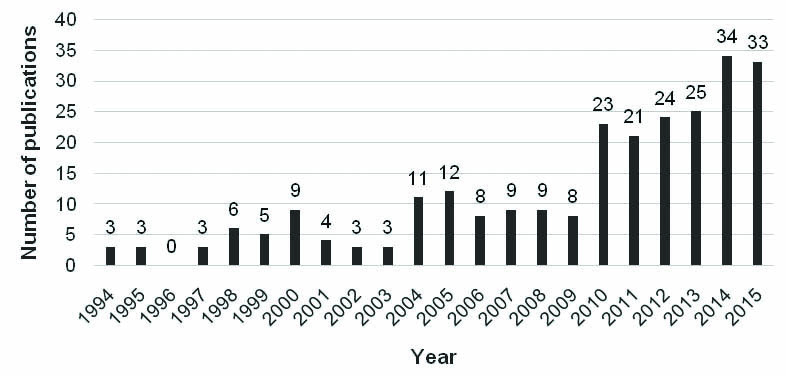
It was found that interest in present topic has been increasing in recent years, reaching its highest productivity point in 2014 with 34 publications. Furthermore, the trend line shows exponential growth.
Additionally, it is worth noting that the publications have focused on quality and satisfaction. To justify this approach, Berenguer MC et al., proposed that service experiences are the result of different cultural, historical, subjective and scientific interactions that arise in the services provided to the people; in this context, health services have a number of challenges to ensure the quality of service provided to people, including the establishment of control systems [18].
Based on this approach, and according to the first publication on this field, the key elements of a quality control system focus on communication links, technical supervision processes and the quality auditing procedures. The reason for this is that service encounters may be the most important factor influencing the client’s assessment of the received service, which may in turn increase the service quality results indicator.
Accounts of these claims, as it shows the growth of publications and the distribution of publications over the years are shown in [Table/Fig-1].
Number of publications per year.
Regarding academic source productivity (after reviewing 195 publications, including books, journals and event memories indexed in SCOPUS), [Table/Fig-2] shows the 10 academic sources with the most publications on the specific topic. The top 10 sources were the most widely used journals to disseminate and publish results in the present area of knowledge. It is observed that the most important academic source in the topic in terms of number of publications is International Journal of Health Care Quality Assurance, with 28 publications, followed by Total Quality Management and Business Excellence with eight publications, and Health Marketing Quarterly with five publications.
Academic sources with the highest amount of publications in the field of healthcare institution quality.
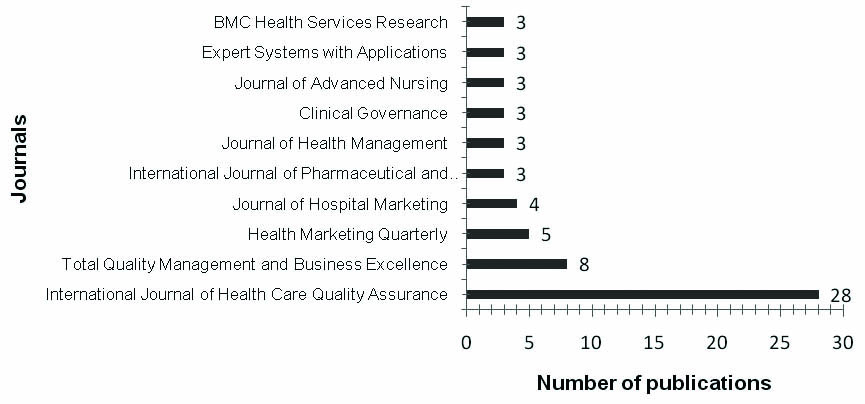
For the accumulated percentage of publications by academic sources, it clearly shows that the Pareto’s Law is not fulfilled, as 72.31% of the academic sources publish 80% of the papers [19]. This means, the distribution of documents was uniform because there was no single predominant academic source for all the records retrieved from the database. Therefore, there are no specialised and positioned sources (journals/publications/books/event memories), in the academic context, healthcare service quality. It makes the authors send their research to other interdisciplinary academic sources.
Moreover, none of the 10 authors with the highest amount of publications appears on the list of the 10 authors with the strongest impact [Table/Fig-3]. Adversely, this shows that the publications of authors with a high participation in the generation of knowledge on present topic do not have a great impact on the community and research networks, thus showing a lack of balance between knowledge generation and its impact.
Amount of citations for the first ten authors.
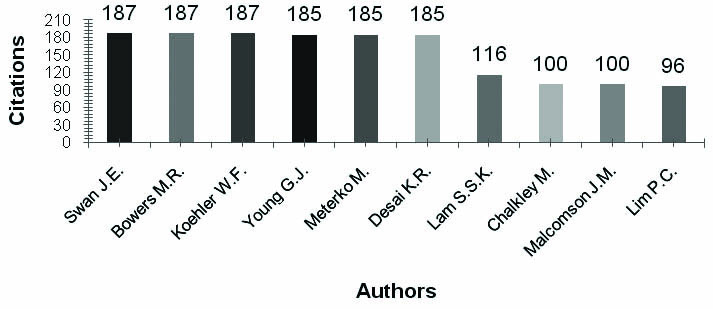
Bowers MR et al., has the highest number of citations, thanks to the paper entitled “What attributes determine quality and satisfaction with Healthcare delivery?” with 187 citations in the database [Table/Fig-3] [20]. These authors are followed by Young GJ et al., in the paper “Patient satisfaction with hospital care: Effects of demographic and institutional characteristics”, which has 185 citations in SCOPUS [21]. The following publication with the third highest number of citations was proposed by Lam S, entitled “SERVQUAL: A tool for measuring patients’ opinions of hospital service quality in Hong Kong” with 116 citations [22]. The research of Chalkley M and Malcomson J, entitled “Contracting for health services when patient’s demands do not reflect quality” with 100 citations was in fourth position [23]. The fifth publication is by Cheng Lim P and Tang N, entitled “A study of patients’ expectations and satisfaction in Singapore hospitals” with 96 citations [24]. The above correspond to authors of the five most cited publications in the field of Healthcare Service Quality.
The results of the indicators for the network of authors in the studied field appear in [Table/Fig-4]. These data show that there were 578 authors in the field and that, on average, each author has published together with three co-authors. Additionally, network density approaches zero (0.005), which means that the intensity of the links between authors from the entire network was very low. In order to properly understand the structure indicators, it is necessary to consider the following definitions of the calculated indicators [25]:
| Indicator | 1994-2002 | 1994-2015 |
|---|
| Amount of nodes | 91 | 578 |
| Network density | 0.022 | 0.005 |
| Network diameter | 2 | 7 |
| Expected characteristic distance | 1.042 | 1.873 |
| Number of affected components | 37 | 176 |
| Average number of neighbours | 2.022 | 3.152 |
| Network clustering | 0.589 | 0.727 |
| Network centralisation | 0.034 | 0.028 |
| Network heterogeneity | 0.672 | 0.886 |
| Number of isolated nodes | 8 | 18 |
| Components connected by nodes | 40.65% | 30.44% |
| Components isolated by nodes | 8.79% | 3.11% |
Network diameter: measure that determines the degree of ligament or connection between its members,
Expected characteristic distance: allows to assess the interaction speed of an agent with the rest of the network agents,
Number of affected components: the “compatibility of members”, which corresponds to the levels of congruence of values and concordance on objectives,
Average number of neighbours: evaluates the extent to which an agent is located in the middle or among other network agents, allowing its interconnection,
Network clustering: indicates the number of different agents with which a given author or institution is directly connected,
Network centralisation: this is the average number of signatures per job, and
Network heterogeneity: percentage of agreement of the knowledge areas by researchers
The indicator’s structure across two periods (1994-2002 and 1994-2015) in a cumulative manner in order to conduct an analysis of the evolution of the author network over time. One can see an increase in the number of authors (number of nodes), the number of independent authors (number of isolated nodes) and the number of isolated sub-networks (number of isolated components). However, the growth rate of the nodes was much greater than that of the isolated nodes and the nodes connected by components. This points to a decrease in the dispersion of the isolated networks (shown by the variation in the “components isolated by nodes” indicator) and an increase in the number of independent publications (shown by the variation in the “components connected by nodes” indicator).
Thus, it is possible to infer that authors who first approach the topic do so through networks that are already in place. In this sense, the sub-networks have experienced an increase in size and a decrease in density, as shown by the evolution of the degree of clustering and the diameter of the network. Despite this, a slight increase in network density means that new authors are linked to few authors from the subnetwork to which they are connected. Consequently, the expected characteristic distance has no variations.
Additionally, these results contribute to the field of public health by pointing out the emerging and growing subjects of research on healthcare service quality. These are shown in [Table/Fig-5].
Emerging and growing subjects by periods.
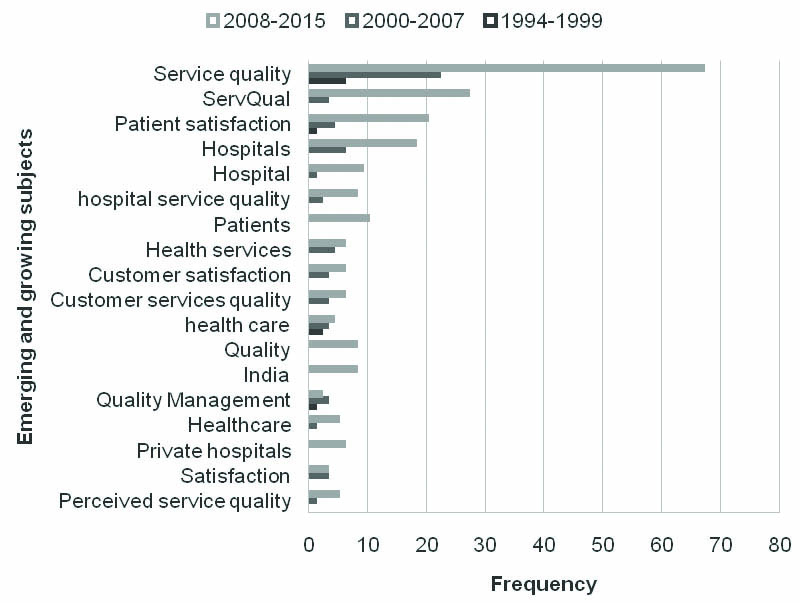
[Table/Fig-5] was created from the normalised keywords used in the searches performed in this study. First, the concepts with the same meaning were merged, and a thesaurus was built with the words obtained from the search. Subsequently, a count was performed in three separate steps, corresponding to three periods: 1994 to 1999; 2000 to 2007 and 2008 to 2015.
Discussion
In the recent decades, a growing interest in achieving patient satisfaction has been observed, leaving healthcare management under increasing pressure. Accordingly, healthcare management has become the main means to measure, assess or show the quality of the health services provided to the patients. Hence, it is important to understand and measure the expectations of the patients themselves [26].
This growing interest is shown in [Table/Fig-1], where the R-squared value is close to 1, thus complying with the law of exponential growth formulated by price, which proposes that scientific information grows exponentially [27,28]. As for the co-efficient of determination (R2), it can be observed that the exponential trend line is reliable. Therefore, it describes the distribution of the amount of publications.
Given the above, research on healthcare providing institutions have progressively realised that patients are actual clients of their organisations; therefore, all processes related to their care must be performed in compliance with strict quality standards. Furthermore, the user’s viewpoint must also be taken into consideration, as they are at the centre of all healthcare actions [29-31].
Hence, tending to measure health service quality, several studies were conducted between 1994 and 2015. These projects consider the constant dynamics to which modern societies are subjected, and thus vary the demographic profile of the users along with their preferences and lifestyles. Consequently, measuring quality and user satisfaction becomes one of the main functions of those managing organisations in the field of healthcare [32].
These dynamics in the studies can be observed in the structure indicator’s measure and the connectivity between publications, authors and fields of knowledge are shown in [Table/Fig-4], which are usually associated with the construction and analysis of social networks. Nodes (vertices) and links are the components of such networks. In the case of a bibliometric analysis, nodes represent authors (individuals who conduct research and publish their results), while links represent co-authorships [17]. This study indicates that the dispersion of the scientific production is significant, as shown by the quantity and impact indicators mentioned above. Likewise, the nodes (authors) in the formed sub-networks have a significant degree of clustering: 0.727.
In this sense, authors like Bowers MR et al., [Table/Fig-3] have established five attributes of Healthcare delivery that define the perception of quality and patient satisfaction and can be used as input for applied research on the subject [20]. They found that characteristics such as age, health status, race, and hospital size have significant effects on the measurement of satisfaction given by patients.
Likewise, we must consider the influence of the competitive nature of today’s markets, since it has been necessary for health services to adapt to those dynamics by gradually adding quality-measuring models for continuous process improvement. Such is the case of the SERVQUAL scale, which was adapted for the domain of healthcare to allow the assessment of hospital services via the expectations and perceptions sub-scales [33, 34].
Similarly, the follow-up actions, based on the various existing models, not only make it possible to plan effective strategies, but also allow the control of any response to these actions, thus encouraging scientific and technological progress [35].
Accordingly (and regarding the growing interest on this subject), the following fields of research were identified: the concept of quality, organisation measurement, leveraging technical innovation and the means to improve healthcare through economic strategies. Likewise, discussed topics include quality epidemiology, projects, implementation and assessment of monitoring systems inside and outside companies and, finally, studies on human behaviour [36].
Other authors have suggested that while the previously mentioned fields of research are relevant for measuring health service quality, it is necessary to measure not only the satisfaction of the clients - called patients in the healthcare domain, but also consider their expectations, since these determine how they will assess the provided services [37].
Therefore, as part of future research projects applicable to health service quality, it is of utmost importance that these works not only generate a more robust body of knowledge in the field, but also encourage the development of accurate measurement models designed in accordance with the characteristics of the context-in this case, the dynamics of the healthcare sector. Particularly in Latin America, where production has been scarce in the last 30 years, which makes it possible to infer that this issue is in development for countries with low and medium income [36].
The outstanding fact about the last period is the increasing interest in subjects associated with service quality, application of SERVQUAL models, and patient satisfaction. Faced with the emergence of new subjects, satisfaction is no longer studied as an individual factor and has rather been included into measurement models that provide a holistic understanding of the phenomenon. Likewise, research on customer service quality has seen a shift towards qualitative approaches backed by quantitative models.
Conclusion
Finally, the network research is becoming increasingly decentralised and heterogeneous. There are no central authors common to the whole field. However, there are central authors common to the subnetworks. There is a possibility that these sub-networks are associated with the disaggregation of the field of knowledge, and therefore may represent the fragmentation of knowledge. This fragmentation allows researchers in the field to generate greater knowledge in the gaps generated in the previous research in order to contribute to health sector organisations to provide a better service and thus, will mitigate the fragmentation of research found in the field.
This situation brings to light the emerging interest on quality measurement and its importance in healthcare organisations, which makes it possible to understand the research trends presented as the results of this bibliometric analysis.