Introduction
Gestational Diabetes Mellitus (GDM) and obesity are both independent and associated risk factors that complicate pregnancy. There has been a worldwide increase in the incidence of GDM. This has been explained by the global epidemic of obesity which has, in turn, resulted in an increase in number of pre-obese and obese women of reproductive age group. Both conditions are associated with metabolic and functional disturbances that affect the placenta. The gross morphologic alterations in gestational diabetic placentae have been extensively studied. The morphopathologic impact of obesity on the gestational diabetic placenta is yet to be explored.
Aim
The aim of the present study was to evaluate the changes in placental morphology of GDM pregnancies as compared to placentae from normoglycaemic, normal prepregnancy Body Mass Index (BMI) pregnancies and to further assess the effect of high prepregnancy BMI on the placentae of GDM in comparison with the placentae of GDM with normal prepregnancy BMI.
Materials and Methods
The observational cross-sectional comparative study was carried out among women who attended three specialty obstetric clinics in an urban city in central Tamil Nadu, India. The study was carried out between May to August 2016. A total of 95 women, of whom 65 were gestational diabetic participated in the study. The control group comprised of 30 women who had normal prepregnancy BMI and who were normoglycaemic throughout pregnancy. BMI was calculated from the prepregnancy weight and height. Using Indian standards of BMI classification, the GDM women were grouped into Lean GDM (LG; n=30) and Obese GDM (OG; n=35). At term, the placentae were collected after the delivery from both study and control groups and analysed for gross morphological parameters including placental weight, volume, thickness, diameter, shape and size, number of cotyledons and site of cord insertion. Statistical test ANOVA with post-hoc analysis was used to compare the groups and Pearson’s coefficient was used to correlate BMI with placental parameters, using the Statistical Package for Social Sciences (SPSS) version 21.0.0, IBM.
Results
Placental weight, volume, thickness and diameter showed a significant increase in the GDM group as compared to control group. There were a higher proportion of irregular placental shapes and marginal and velamentous cord insertion among gestational diabetic placentae. Placental weight, volume and thickness were significantly increased in OG placentae as compared to LG. Pearson’s r showed a weak however, significant positive correlation between maternal prepregnancy BMI and placental weight, volume and thickness.
Conclusion
Maternal prepregnancy BMI influences gross morphological features of the placenta. The finding is relevant in the context of understanding the response of the placenta to obesity and GDM and in evolving ultrasonographic placental examination criteria that can be used to monitor and safeguard against adverse pregnancy outcomes.
Introduction
The placenta plays a role in mediating foetal growth and viability and it is involved in hormonal and metabolic alterations during pregnancy [1]. Changes in maternal metabolism influence the placental function and morphology, based on the type and timing of the insult [2]. Both GDM and obesity complicate the pregnancy. GDM has been associated with adverse pregnancy outcomes and changes in the normal placental morphology [3,4]. Ultrasonographic studies on the placenta, during pregnancy, report changes in the placental volume, area and perimeter along with altered vascular indices in GDM [5]. It has been proposed that while placental pathology is not diagnostic of GDM, it is nevertheless one of the indicators of abnormal pregnancy environment and foetal growth [6,7]. The changes in the morphology have traditionally been considered pathologic, however, recent research attempts to attribute these changes to adaptive response of the placenta in an effort to offset the adverse metabolic effects [8]. The abnormal placental growth may be construed as compensatory or adaptive to accommodate different maternal risk factors.
There is widespread prevalence of obesity which could explain the worldwide increase in incidence of GDM [9,10]. Obesity and GDM are independent and associated risk factors for the adverse pregnancy outcomes [11]. The effect of obesity and GDM on pregnancy outcomes is well-documented [12]. Abnormal biochemical and molecular changes in both these conditions cause endothelial dysfunction and a hypoxic condition of the placenta [13,14]. The changes induced by GDM in the placenta have been extensively studied by gestational age, timing of onset of GDM, glycaemic control and other factors [7,15,16]. However, the gross morphologic alteration in the placenta due to obesity alone or the compounding effects of obesity, if any, on the gestational diabetic placenta is under reported in literature.
Antenatal ultrasound examination which evaluates the placental parameters such as the weight, volume and cord insertion has been proven to be of predictive value in the pregnancy outcomes such as foetal weight and adverse effects [5,17,18]. In this context, we sought to examine the gross morphological effects of increasing BMI with the GDM on placental morphology.
Materials and Methods
The observational cross-sectional comparative study was carried out among women who attended three specialty obstetric clinics in an urban city in central Tamil Nadu, India. The study was carried out between May to August 2016. 65 women with singleton pregnancies who had been diagnosed as GDM, based on DIPSI criteria, of more than 140 mg/dL of glucose two hours after a 75 gm oral glucose load at 24-28 weeks were included in the study [19]. Of the 65 women with GDM, 35 were obese (OG group) and 30 had a normal prepregnancy BMI (LG group). Normoglycaemic women with a normal prepregnancy BMI were specifically chosen for control group (n=30). The WHO proposed lower action cut-off points for BMI in Asian populations [20]. Accordingly, the BMI cut-off values that were recommended by the Indian Health Ministry were used to classify participants [21]. BMI of 18.5 to 21.9 is defined as normal BMI (LG and control groups) and above 25 is considered to be obese (OG group) [20,21]. Pregnancies complicated by pre-existing diabetes mellitus, chronic hypertension, other co-morbidities such as anaemia, pre-eclampsia, and substance abuse were excluded. Participants with a total pregnancy weight gain of more than 16 kg in control and LG groups and more than 11.5 kg in OG group were excluded from the study [22]. The level of glycaemic control was considered adequate if the mean fasting glucose levels were ≤90 mg/dL and two hour postprandial glucose levels were ≤120 mg/dL [23].
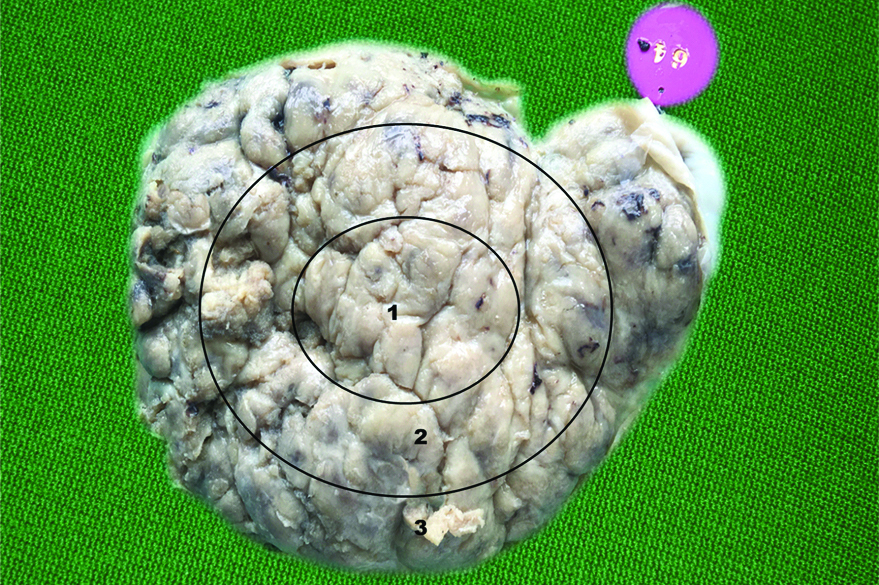
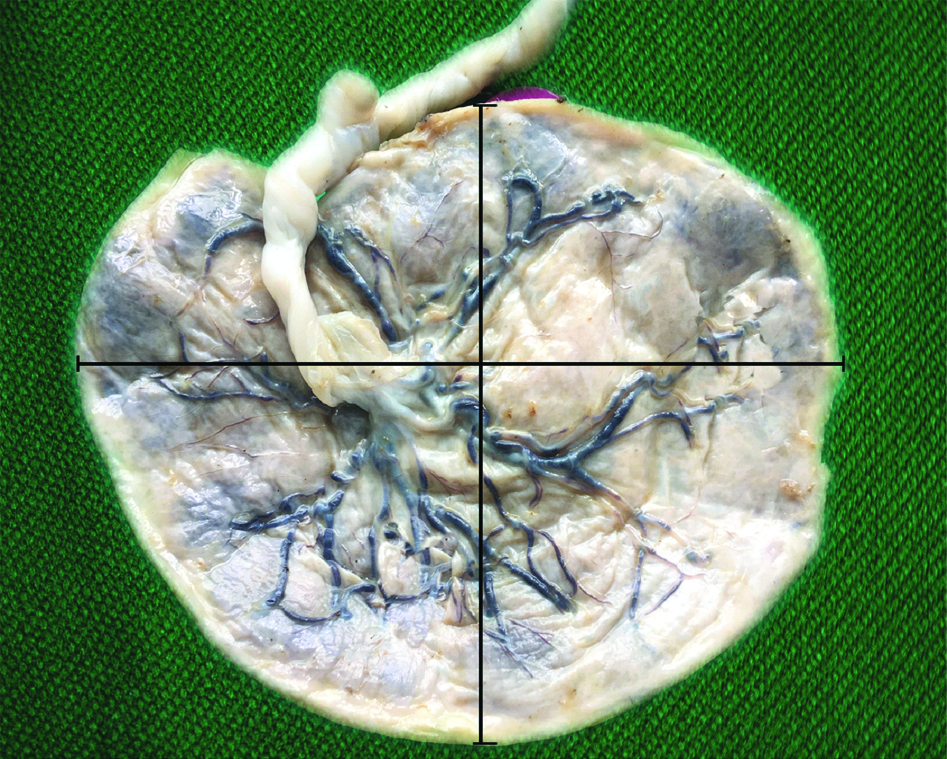
Placentae were collected immediately after delivery. The placenta was washed in running tap water and fixed in 10% formal saline for 2-3 days. Placental membranes were trimmed close to the periphery and the umbilical cord was sectioned 5 cm away from the site of insertion. Placentae were weighed on an electronic scale and the volume was estimated by fluid displacement method [24]. Placental shapes were classified as discoid, ovoid, and irregular, based on modification from previous descriptions of placental shape [25]. The site of cord insertion was noted. The site of cord insertion was categorised into central, eccentric, marginal and velamentous. The different types of placental shapes and cord insertion per group were expressed as percentages. The placenta was categorised into three concentric areas from the centre towards the periphery and thickness was measured by passing a needle through three representative areas [Table/Fig-1]. The mean thickness was calculated [26]. The largest diameter of the placenta was measured (major axis) on the foetal surface. A measurement perpendicular to the largest diameter was taken at the bisection of the major axis (minor axis). The placental diameter was calculated as the mean of the major and minor axes [Table/Fig-2] [26]. The maternal surface was examined for the presence of clots, number of cotyledons, discolouration, calcification, areas of haemorrhage and necrosis. The foetal surface was examined for abnormalities and discolouration. The maternal prepregnancy weight and height and demographic details were obtained from hospital records. The prepregnancy weight was defined as the weight recorded during the first antenatal visit during the first trimester. The study was carried out after obtaining prior approval from the Institutional Ethical committee (CMCH and RC/IEC-No:19/15.04.2016). Informed consent was obtained prior to delivery for collection of data and placenta.
Maternal surface of placenta with cotyledons, showing the three zones (1,2,3). from which thickness was measured.
Foetal surface of placenta showing measurement of diameter along two axes.
Statistical Analysis
Data was tabulated and statistical tests of ANOVA with Tukey post-hoc analysis and Pearson’s correlation were performed using the SPSS version 21.0.0, IBM. Data on weight, volume, thickness and diameter are expressed as mean±standard deviation.
Results
Maternal Demographic Characteristics
As given in [Table/Fig-3], the age range of the participants of the study was from 20 to 34 years. There was no significant difference in mean age between the three groups. The LG and OG groups differed only by BMI.
Demographic features of the selected sample and the percentage of gestational diabetic who had maintained good glycaemic control.
| Characteristic | Control (n=30) | Lean GDM (n=30) | Obese GDM (n=35) |
|---|
| Age |
| Mean±standard deviation | 28.83±3.333 | 26.83±3.668 | 28.49±2.894 |
| Minimum | 24 | 20 | 22 |
| Maximum | 34 | 34 | 33 |
| Prepregnancy BMI |
| Mean±standard deviation | 21.73±0.97 | 20.968±1.38 | 32.45±4.20 |
| Minimum | 19.3 | 18.8 | 27.3 |
| Maximum | 22.9 | 23.9 | 42 |
| Well controlled glycaemic levels |
| Percentage of subgroup (number of participants) | 100% (30) | 86.67% (26) | 85.71 %(30) |
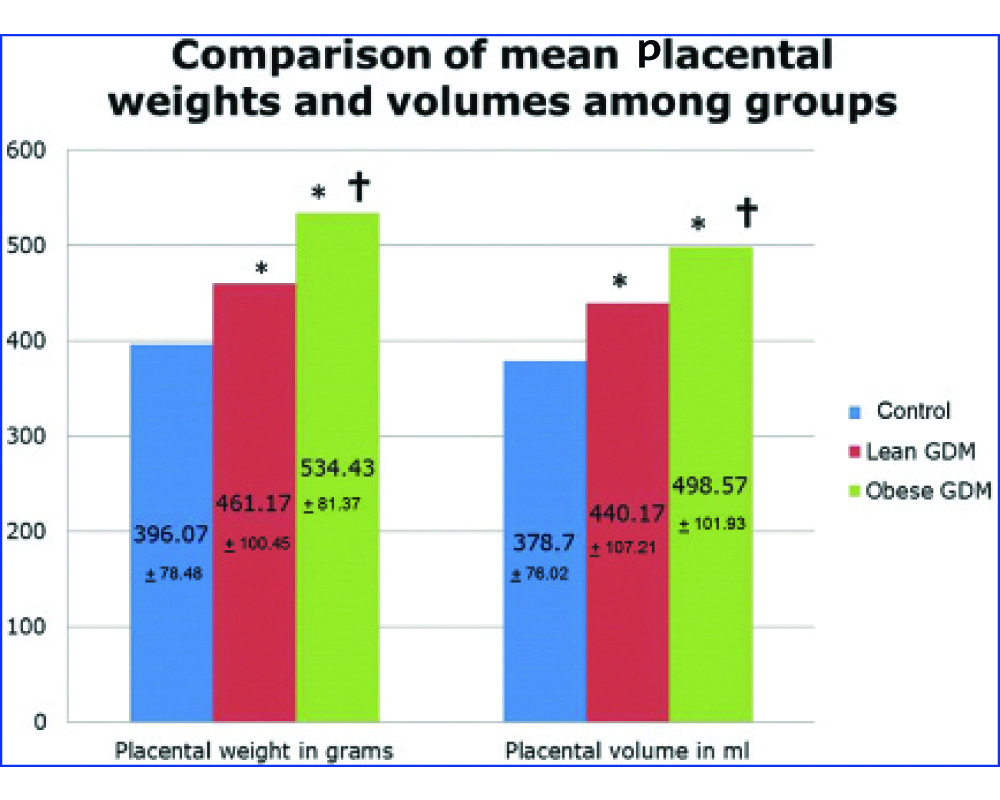
Placental Weight, Volume, Thickness and Diameter
ANOVA results on comparison between the mean placental weight, volume, thickness, diameter and number of cotyledons showed significant differences between the groups (p<0.001).
The mean placental weight in grams in the control group, LG and OG groups was 396.07±78.48, 461.17±100.45 and 534.43±81.37 respectively [Table/Fig-4]. The placental weight in the GDM groups was significantly increased from the control group. Post-hoc analysis using the Tukey Honest Significant Difference (HSD) test shows that the difference in mean placental weight between that of control and LG and between that of control and OG groups was significant at a level of p<0.05. There was a significant difference between the LG and OG groups (p<0.05).
In the placenta of the diabetic, the placental volume was increased (440.17±107.21 mL in the LG group and 498.57±101.93 mL in the OG group) compared to the control (378.70±76.02 mL) group (p<0.05). The placentae in the LG group had a significantly lesser volume than the placentae in the OG group (p<0.05) [Table/Fig-4].
Comparison of the placental mean placental weights and volume among groups.
*indicates values significantly different from control
†indicates significant difference between the lean GDM and obese GDM groups. ANOVA with post-hoc analysis was used to test for differences between means of groups
The mean thickness and the mean diameter of placenta from the LG and OG groups were significantly increased compared to the mean thickness and the mean diameter of placentae of the control group (p<0.05). While the mean thickness of placenta was increased in the OG group as compared to the LG group, the difference was not statistically significant. The mean diameter of the placentae of the OG group did not show statistically significant difference from that of the LG group [Table/Fig-5].
Comparison of the placental mean thickness and diameter between groups.
| Group | Mean placental thickness in cm | Significance (p<0.05) by post hoc analysis | Mean placental diameter in cm | Significance (p<0.05) by post hoc analysis |
|---|
| Control | 2.38+0.26 | | 15.95+1.64 | |
| Lean GDM | 3.18+0.60* | LG and CL; p=0.001*LG and OG; p=0.431 | 17.95+2.82* | LG and CL; p=0.001*LG and OG; p=0.991 |
| Obese GDM | 3.34+0.61* | OG and CL; p=0.001* | 17.87+3.09* | OG and CL; p=0.001* |
*indicates values significantly different from control. ANOVA with post-hoc analysis was used to test for differences between means of groups
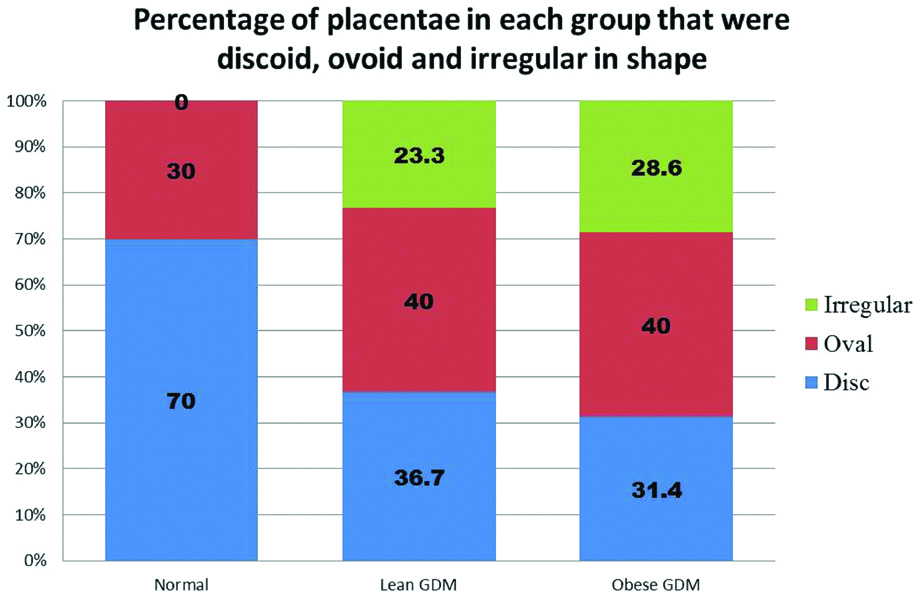
Morphological Features of Placenta: Shape and Umbilical Cord Attachment
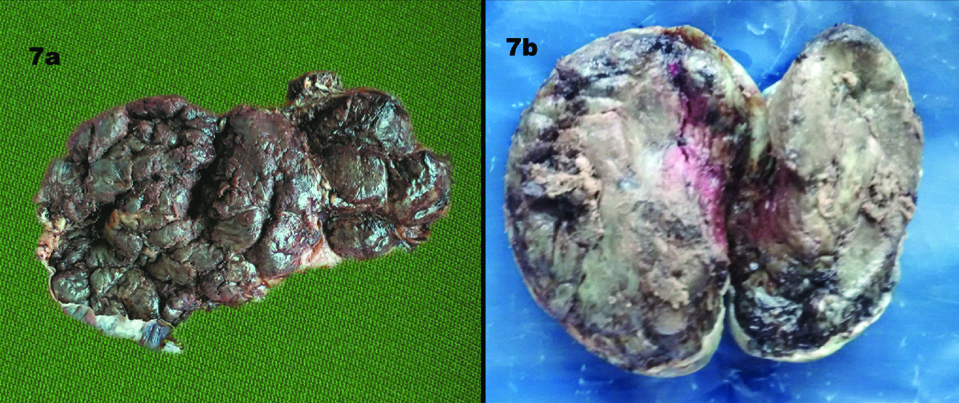
The GDM group had a higher percentage of ovoid and irregular placentae than the control group [Table/Fig-6]. Irregular placentae were noted to be higher in the OG group than the LG group [Table/Fig-7a]. There were two placentae each in the LG and OG group that were lobed [Table/Fig-7b].
Increased incidence of irregular and oval shaped placentae in the GDM groups compared to control.
a) An irregularly shaped placenta; b) Lobed placenta.
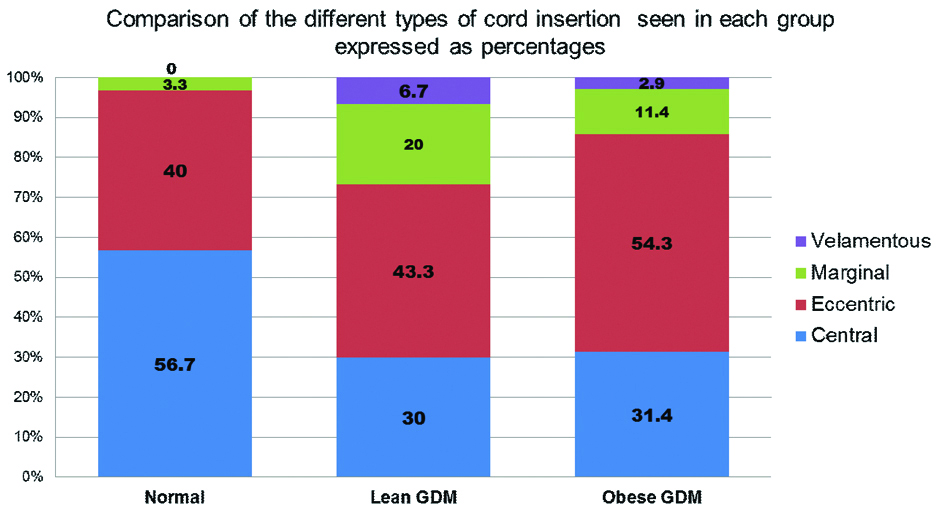
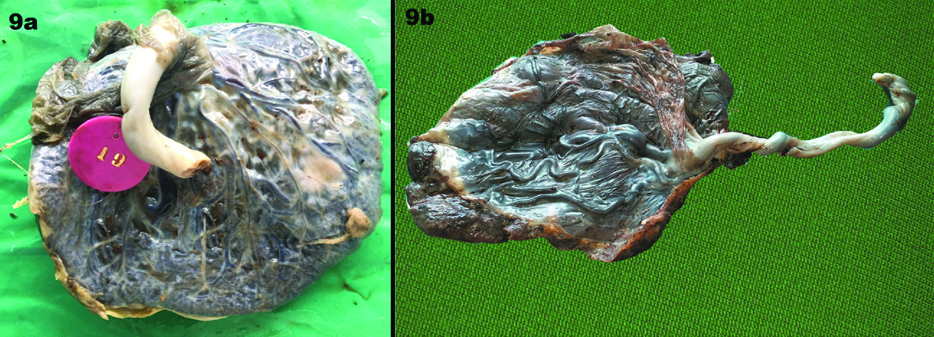
Higher incidence of marginal and eccentric umbilical cord insertion were noticed in the GDM group [Table/Fig-8,9a]. Velamentous insertion was also seen [Table/Fig-9b]. Among the placenta from OG group, one showed velamentous insertion and four had marginal insertions. Among the LG group, there were two velamentous insertions and six placentae with marginal insertion of umbilical cord. In comparison, there were no velamentous insertions of the umbilical cord in the control group and a single placenta had marginal insertion. The mean number of cotyledons in LG, OG, control groups were 17.47±2.46, 17.06±2.43 and 14.87±1.14 respectively. The number of cotyledons was increased in the GDM group. There was a significant difference (p<0.05) between the control and LG and between the control and OG groups (p<0.05).
Different types of umbilical cord insertion in each group.
a) Marginal insertion of cord; b) Velamentous or membranous insertion.
Correlation with Increased BMI
As given in [Table/Fig-10], the Pearson’s co-efficient r, showing association of BMI with weight, volume and mean thickness of placenta, was 0.382, 0.324 and 0.305 respectively. There was a significant yet weak positive correlation between the increasing maternal BMI and the placental parameters such as weight, volume and thickness (p<0.01, two tailed).
Pearson’s coefficient of correlation of placental parameters that showed significant association with BMI.
| Parameters | Pearson’s coefficient | Significance (p<0.05) |
|---|
| Placental weight | 0.382 | p=0.001 |
| Placental volume | 0.324 | p=0.001 |
| Mean placental thickness | 0.305 | p=0.003 |
Discussion
Metabolic derangements cause morphological and functional changes in the placenta. Based on the timing of the onset of GDM, the changes in the placenta may be functional and morphological or only functional [2]. These changes, that are seen in a placenta, have been attributed by researchers as an attempt to compensate for the abnormal metabolic and cellular derangements [8,27].
GDM has been associated with increased weight, central thickness and diameter of the placenta along with increased volume [2,3,15,28-30]. Along with the above mentioned changes, studies also report an increase in the number of cotyledons and circumference [30,31]. The findings in present study corroborate with these studies, in that GDM placentae were heavier and thicker with an increased volume and diameter. A study reported increased placental hypertrophy in overweight and obese pregnancies and found that higher placental weight was associated with higher rates of caesarean section, post dates and increased foetal weight [32]. Increased or decreased placental weight was found to be an independent risk factor for adverse pregnancy outcome [33]. A study found an increase in mean placental weight over the years [34]. The authors hypothesised that this change in standard normal placental weights could be correlated to the increasing BMI trends [34]. The present study shows increase in placental weight, thickness and diameter along with volume in GDM pregnancies. There was significant increase in placental weight and volume in the OG group as compared to the LG group.
GDM might cause vascular dysfunction by means of the hyperglycaemia and hyperinsulinemia [35]. Placentae with increased weight were found to be associated with adverse neonatal clinical outcomes [36]. The placental thickness has a weak positive correlation with birth weight [37]. GDM and obesity are involved in hypoxic stress generation in the placenta [14]. The increase in placental weight is accompanied by an increase in surface area for diffusion [38]. These changes may be interpreted as pathologic changes caused due to the increased metabolic insult in obese GDM pregnancies. They may also be interpreted as an attempt by the placenta to increase placental function in order to compensate for metabolic derangement. The increase in weight might reflect an attempt in increasing placental efficiency.
The placental shape is commonly described as discoid or ovoid [25]. A study shows that irregularities in the placental shape, measured quantitatively, had significant correlation with uteroplacental and fetoplacental vascular pathology [39]. A study on foetal programming states that, while placental weight can be correlated with foetal weight, placental shape cannot be correlated with the foetal weight [40]. The altered placental shape can be considered as an adaptive change to the altered maternal and uterine environment [40]. Studies on placental shape in GDM pregnancies report variable findings. Placenta from GDM pregnancies were found to be more ovoid than round [29]. There was incidence of lobed placenta [41]. A study reported that there were no differences in shape [42]. Present study shows that approximately one-fourth of placentas belonging to the GDM groups were irregular in shape. Along with the increased weight and thickness of GDM placentas, this irregularity in shape might reflect an underlying vascular and surface area adaptation. Given the high occurrence of irregular shaped placenta associated with GDM, it could be presupposed that an irregular shaped placenta on ultrasound examination might be indicative of underlying pathology and this would warrant further evaluation and close monitoring of maternal and foetal health.
Insertion of umbilical cord is commonly central or eccentric [25]. Marginal insertion of umbilical cord is seen in approximately 7% of placentas and 1% of them show velamentous or membranous insertion [25]. It has also been stated that the site of insertion of the umbilical cord is often eccentric than central [43]. A study found no difference in umbilical cord insertion in GDM pregnancies [43]. A study reports that deviation from non central or near central insertion site of the umbilical cord negatively impacted transfer capability across the placenta [44]. This was because of disturbances in the chorionic vasculature, despite a discoid placental shape [44]. Velamentous insertion has been associated with increased foetal risk and ante-natal ultrasonographic evaluation has been of value to provide necessary information about type of umbilical cord insertion [17,18,45,46]. It is significant to note that our results show an increase in both the marginal and velamentous insertion among the GDM placentae compared to controls. This indicates a deviation in normal placental vascularisation. This feature might be taken in combination with other commonly associated placental findings in GDM such as increased weight and thickness, irregularity in shape, and serve to signal an underlying disorder of pregnancy.
The influence of glycaemic control during pregnancy on the clinical outcomes, gross morphological and microscopic features of the placenta, is debated [3,28]. In present study, the majority of the cases had optimal glycaemic control. Several studies have stated that disturbances in placenta do exist independent of the glycaemic control.
Placental weight is a predictor of foetal birth weight and risk of adverse effects [6,33,36]. Placental weight plays a role in mediating the effects of maternal obesity, GDM and gestational weight gain [7]. Placental volume in the second trimester is dependent on maternal weight at first ante-natal visit and pregnancy weight gain [47]. This is, in turn, associated with foetal growth indices [47]. Velamentous and marginal insertion of the umbilical cord are considered abnormal and is evaluated during antenatal ultrasound examination due to their relation with adverse outcomes [48]. The gross morphologic placental changes in association with GDM and obesity might aid in understanding the placental mechanisms at play in response to the metabolic changes in these conditions. These features may be relevant in ultrasonography as a surveillance feature to identify the possible presence of underlying disease.
Increasing BMI and increased placental weight are independent risk factors for adverse pregnancy outcomes [32]. The placental weight and thickness, along with diameter and thickness was increased in the GDM group compared to controls. There is a significant increase in placental weight and volume in the OG group compared to the LG group. Present study results show significant but weak positive correlation of placental weight, volume, thickness with maternal prepregnancy BMI. It can be argued that this feature is more in favor of an attempt at adaptation by the placenta to increase its efficiency in the presence of factors that affect it. The complicating factor of obesity may either exacerbate or dampen this response. However, to definitively comment on such a response, we will require a larger sample size and a study of the foetal and maternal outcomes, microscopic, ultrastructural and molecular mechanisms involved.
The results of the study show changes in the gestational diabetic placentas which are more marked in OG group than in the LG group.
Limitation
The effect of poorly controlled GDM was not studied. Further study on the associated histopathological changes that accompany the gross morphological changes of placenta and the biochemical alterations that are associated with the placental changes will shed light on the mechanisms of placental changes seen in GDM and in obesity.
Conclusion
The present study shows increased placental parameters in the obese GDM group compared to the lean GDM group. Further research is needed to elucidate the underlying pathologic and adaptive changes of the placenta to metabolic insult. Viewed as a combination of findings, these changes may alert the physician or sonographer to the complications of pregnancy and enable more efficient monitoring of such pregnancies to ensure safe pregnancy outcomes.
[1]. Fowden AL, Forhead AJ, Coan PM, Burton GJ, The Placenta and Intrauterine ProgrammingJ Neuroendocrinol 2008 20(4):439-50.10.1111/j.1365-2826.2008.01663.x18266944 [Google Scholar] [CrossRef] [PubMed]
[2]. Desoye G, Mouzon SH, The human placenta in gestational diabetes mellitus: the insulin and cytokine networkDiabetes Care 2007 30(2):S120-26.10.2337/dc07-s20317596459 [Google Scholar] [CrossRef] [PubMed]
[3]. Vambergue A, Fajardy I, Consequences of gestational and pregestational diabetes on placental function and birth weightWorld J Diabetes 2011 2(11):196-203.10.4239/wjd.v2.i11.19622087356 [Google Scholar] [CrossRef] [PubMed]
[4]. Crowther CA, Hiller JE, Moss JR, McPhee AJ, Jeffries WS, Robinson JS, Effect of treatment of gestational diabetes mellitus on pregnancy outcomesN Engl J Med 2005 352(24):2477-86.10.1056/NEJMoa04297315951574 [Google Scholar] [CrossRef] [PubMed]
[5]. Malathi G, Shanthi V, Statistical measurement of ultrasound placenta images complicated by gestational diabetes mellitus using segmentation approachJournal of Information Hiding and Multimedia Signal Processing 2011 2(4):332-43. [Google Scholar]
[6]. Taricco E, Radaelli T, Santis MSN de, Cetin I, Foetal and placental weights in relation to maternal characteristics in gestational diabetesPlacenta 2003 24(4):343-47.10.1053/plac.2002.091312657507 [Google Scholar] [CrossRef] [PubMed]
[7]. Ouyang F, Parker M, Cerda S, Pearson C, Fu L, Gillman MW, Placental weight mediates the effects of prenatal factors on fetal growth: the extent differs by preterm statusObes Silver Spring Md 2013 21(3):609-20.10.1002/oby.2025423592670 [Google Scholar] [CrossRef] [PubMed]
[8]. Desoye G, Shafrir E, Placental metabolism and its regulation in health and diabetesMol Aspects Med 1994 15(6):505-682.10.1016/0098-2997(94)90004-3 [Google Scholar] [CrossRef]
[9]. Ferrara A, Kahn HS, Quesenberry CP, Riley C, Hedderson MM, An increase in the incidence of gestational diabetes mellitus: Northern California, 1991-2000Obstet Gynecol 2004 103(3):52610.1097/01.AOG.0000113623.18286.2014990417 [Google Scholar] [CrossRef] [PubMed]
[10]. Ferrara A, Increasing prevalence of Gestational Diabetes Mellitus: a public health perspectiveDiabetes Care 2007 30(2):S141-46.10.2337/dc07-s20617596462 [Google Scholar] [CrossRef] [PubMed]
[11]. Catalano PM, McIntyre HD, Cruickshank JK, McCance DR, Dyer AR, Metzger BE, The hyperglycaemia and adverse pregnancy outcome study: associations of GDM and obesity with pregnancy outcomesDiabetes Care 2012 35(4):780-86.10.2337/dc11-179022357187 [Google Scholar] [CrossRef] [PubMed]
[12]. Wahabi HA, Fayed AA, Alzeidan RA, Mandil AA, The independent effects of maternal obesity and gestational diabetes on the pregnancy outcomesBMC Endocr Disord 2014 14:4710.1186/1472-6823-14-4724923207 [Google Scholar] [CrossRef] [PubMed]
[13]. Stewart FM, Freeman DJ, Ramsay JE, Greer IA, Caslake M, Ferrell WR, Longitudinal assessment of maternal endothelial function and markers of inflammation and placental function throughout pregnancy in lean and obese mothersJ Clin Endocrinol Metab 2007 92(3):969-75.10.1210/jc.2006-208317192290 [Google Scholar] [CrossRef] [PubMed]
[14]. Li HP, Chen X, Li MQ, Gestational diabetes induces chronic hypoxia stress and excessive inflammatory response in murine placentaInt J Clin Exp Pathol 2013 6(4):650-59. [Google Scholar]
[15]. Gauster M, Desoye G, Tötsch M, Hiden U, The placenta and Gestational Diabetes MellitusCurr Diab Rep 2012 12(1):16-23.10.1007/s11892-011-0244-522102097 [Google Scholar] [CrossRef] [PubMed]
[16]. Madazlı R, Tuten A, Calay Z, Uzun H, Uludag S, Ocak V, The incidence of placental abnormalities, maternal and cord plasma malondialdehyde and vascular endothelial growth factor levels in women with gestational diabetes mellitus and nondiabetic controlsGynecol Obstet Invest 2008 65(4):227-32.10.1159/00011304518196904 [Google Scholar] [CrossRef] [PubMed]
[17]. Pretorius DH, Chau C, Poeltler DM, Mendoza A, Catanzarite VA, Hollenbach KA, Placental cord insertion visualization with prenatal ultrasonographyJ Ultrasound Med 1996 15(8):585-93.10.7863/jum.1996.15.8.5858839406 [Google Scholar] [CrossRef] [PubMed]
[18]. Di Salvo DN, Benson CB, Laing FC, Brown DL, Frates MC, Doubilet PM, Sonographic evaluation of the placental cord insertion siteAm J Roentgenol 1998 170(5):1295-98.10.2214/ajr.170.5.95746059574605 [Google Scholar] [CrossRef] [PubMed]
[19]. Seshiah V, Fifth National Conference of Diabetes in Pregnancy Study Group, IndiaJAPI 2010 58:329 [Google Scholar]
[20]. WHO Expert ConsultationAppropriate body-mass index for Asian populations and its implications for policy and intervention strategiesLancet Lond Engl 2004 363(9403):157-63.10.1016/S0140-6736(03)15268-3 [Google Scholar] [CrossRef]
[21]. Misra A, Chowbey P, Makkar BM, Vikram NK, Wasir JS, Chadha D, Consensus statement for diagnosis of obesity, abdominal obesity and the metabolic syndrome for Asian Indians and recommendations for physical activity, medical and surgical managementJ Assoc Physicians India 2009 57:163-70. [Google Scholar]
[22]. Nutrition During Pregnancy: Part I Weight Gain: Part II Nutrient Supplements. Washington (DC): National Academies Press (US); 1990. 1, Summary. Available from: https://www.ncbi.nlm.nih.gov/books/NBK235235/ [Google Scholar]
[23]. Seshiah V, Sahay BK, Das AK, Shah S, Banerjee S, Rao PV, Gestational diabetes mellitus-Indian guidelinesJournal of the Indian Medical Association 2009 107(11):799 [Google Scholar]
[24]. Scherle W, A simple method for volumetry of organs in quantitative stereologyMikroskopie 1970 26(1):57-60. [Google Scholar]
[25]. Benirschke K, Burton GJ, Baergen RN, Pathology of the Human Placenta 2012 6th edBerlin HeidelbergSpringer-Verlag10.1007/978-3-642-23941-0PMC3381679 [Google Scholar] [CrossRef] [PubMed]
[26]. Akhter F, Ferdousi R, Sultana R, Gross morphological variation in preterm placenta in gestational diabetes mellitus and pregnancy induced hypertensionJ Enam Med Col 2011 1(2):71-75.10.3329/jemc.v1i2.11466 [Google Scholar] [CrossRef]
[27]. Hayward CE, Lean S, Sibley CP, Jones RL, Wareing M, Greenwood SL, Placental adaptation: what can we learn from birthweight: placental weight ratio?Frontiers in Physiology 2016 7:2810.3389/fphys.2016.00028 [Google Scholar] [CrossRef]
[28]. Edu AN, Teodorescu C, Dobjanschi CG, Socol ZZ, Teodorescu VA, Matei A, Placenta changes in pregnancy with gestational diabetesRom J Morphol Embryol 2016 57(2):507-12. [Google Scholar]
[29]. Elsennawy TM, Effect of gestational diabetes on gross morphology, histology and histochemistry of human placentaEndocrinol Metab Syndr 2016 5(5):1-3. [Google Scholar]
[30]. Saini P, Pankaj JP, Jain A, Agarwal GC, Effect of gestational diabetes mellitus on gross morphology of placenta: a comparative studyInt J Anat Res 2015 3(1):889-94.0.16965/ijar.2015.111 [Google Scholar] [CrossRef]
[31]. Saha S, Biswas S, Mitra D, Adhikari A, Saha C, Histologic and morphometric study of human placenta in gestational diabetes mellitusItalian Journal of Anatomy and Embryology 2014 119(1):1 [Google Scholar]
[32]. Wallace JM, Horgan GW, Bhattacharya S, Placental weight and efficiency in relation to maternal body mass index and the risk of pregnancy complications in women delivering singleton babiesPlacenta 2012 33(8):611-18.10.1016/j.placenta.2012.05.00622695104 [Google Scholar] [CrossRef] [PubMed]
[33]. Hutcheon JA, McNamara H, Platt RW, Benjamin A, Kramer MS, Placental weight for gestational age and adverse perinatal outcomesObstet Gynecol 2012 119(6):125110.1097/AOG.0b013e318253d3df22617591 [Google Scholar] [CrossRef] [PubMed]
[34]. Swanson LD, Bewtra C, Swanson LD, Bewtra C, Increase in normal placental weights related to increase in maternal body mass indexJ Matern Fetal Neonatal Med 2008 21(2):111-13.10.1080/1476705070186696318240079 [Google Scholar] [CrossRef] [PubMed]
[35]. Leach L, Taylor A, Sciota F, Vascular dysfunction in the diabetic placenta: causes and consequencesJ Anat 2009 215(1):69-76.10.1111/j.1469-7580.2009.01098.x19563553 [Google Scholar] [CrossRef] [PubMed]
[36]. Naeye RL, Do placental weights have clinical significance?Hum Pathol 1987 18(4):387-91.10.1016/S0046-8177(87)80170-3 [Google Scholar] [CrossRef]
[37]. Afrakhteh M, Moeini A, Taheri MS, Haghighatkhah HR, Correlation between placental thickness in the second and third trimester and fetal weightRev Bras Ginecol E Obstetrícia 2013 35(7):317-22.10.1590/S0100-7203201300070000624080844 [Google Scholar] [CrossRef] [PubMed]
[38]. Desoye G, Shafrir E, The human placenta in diabetic pregnancyDiabetes Rev 1996 4(1):70-89. [Google Scholar]
[39]. Salafia CM, Yampolsky M, Misra DP, Shlakhter O, Haas D, Eucker B, Placental surface shape, function, and effects of maternal and fetal vascular pathologyPlacenta 2010 31(11):958-62.10.1016/j.placenta.2010.09.00520933281 [Google Scholar] [CrossRef] [PubMed]
[40]. Haeussner E, Schmitz C, Koch F von, Frank HG, Birth weight correlates with size but not shape of the normal human placentaPlacenta 2013 34(7):574-82.10.1016/j.placenta.2013.04.01123672847 [Google Scholar] [CrossRef] [PubMed]
[41]. Al-Mamori RH. Morphopathology of human placenta in diabetic pregnancy. 2014 Accessed from https://s3.amazonaws.com/academia.edu.documents/34229413/Morphopathology_of_human_placenta_in_diabetic_pregnancy.pdf [Google Scholar]
[42]. Pathak S, Sebire NJ, Hook L, Jessop F, Murdoch E, Hackett GA, Placental weight, cord insertion, shape and cord coiling in pregnancies with gestational diabetes mellitus (GDM)Ultrasound Obstet Gynecol 2010 36(1):20610.1002/uog.8439 [Google Scholar] [CrossRef]
[43]. Pathak S, Hook E, Hackett G, Murdoch E, Sebire NJ, Jessop F, Cord coiling, umbilical cord insertion and placental shape in an unselected cohort delivering at term: Relationship with common obstetric outcomesPlacenta 2010 31(11):963-68.10.1016/j.placenta.2010.08.00420832856 [Google Scholar] [CrossRef] [PubMed]
[44]. Yampolsky M, Salafia CM, Shlakhter O, Haas D, Eucker B, Thorp J, Centrality of the umbilical cord insertion in a human placenta influences the placental efficiencyPlacenta 2009 30(12):1058-64.10.1016/j.placenta.2009.10.00119879649 [Google Scholar] [CrossRef] [PubMed]
[45]. Heinonen S, Ryynänen M, Kirkinen P, Saarikoski S, Perinatal diagnostic evaluation of velamentous umbilical cord insertion: Clinical, doppler, and ultrasonic findingsObstet Gynecol 1996 87(1):112-17.10.1016/0029-7844(95)00339-8 [Google Scholar] [CrossRef]
[46]. Hasegawa J, Matsuoka R, Ichizuka K, Sekizawa A, Okai T, Velamentous cord insertion: significance of prenatal detection to predict perinatal complicationsTaiwan J Obstet Gynecol 2006 45(1):21-25.10.1016/S1028-4559(09)60185-6 [Google Scholar] [CrossRef]
[47]. Thame M, Osmond C, Bennett F, Wilks R, Forrester T, Fetal growth is directly related to maternal anthropometry and placental volumeEur J Clin Nutr 2004 58(6):894-900.10.1038/sj.ejcn.160190915164110 [Google Scholar] [CrossRef] [PubMed]
[48]. Ismail KI, Hannigan A, O’Donoghue K, Cotter A, Abnormal placental cord insertion and adverse pregnancy outcomes: a systematic review and meta-analysisSystematic reviews 2017 6(1):24210.1186/s13643-017-0641-129208042 [Google Scholar] [CrossRef] [PubMed]