Introduction
The overall incidence of the renal masses is on the rise. With better imaging modalities more of these masses are picked up earlier. Most of the times, the diagnosis is confirmed after radical nephrectomy. More often there is an inherent tendency to offer overtreatment in cases of benign renal masses. Renal biopsy to discriminate benign from malignant masses can be very useful in such instances but are more invasive. Grey Level Co-Occurence Matrix (GLCM) is recognized as the most representative radiological parameter to define the heterogeneity of solid renal masses.
Aim
To identify certain radiological parameters that might help us to differentiate the benign from malignant renal masses, obviating the need for a biopsy.
Materials and Methods
This was a prospective study done over three years from June 2014 to May 2017. A total of 188 patients were included. These patients were equally divided into two broad groups of 94 patients each: Group 1 was patients with renal mass, of which 67 were malignant and 27 were benign. The group 2 was the control group. We used the active contour method to delineate the renal mass and study the features in them. Data analysis for each feature was individually calculated with the help of Sigma Stats 4.0 software and one-way ANOVA analysis.
Results
Six CT parameters showed significant data that helped the clinician to differentiate the benign from the malignant renal masses. From the study it was evident that the parameters namely, entropy, energy, sum average, sum variance, inertia and low gray level emphasis were found to be statistically significant which helps the clinician to differentiate the benign from the malignant renal masses.
Conclusion
Our data shows that GLCM parameters are crucial tool for the determination of the solid mass composition of tumour. This obviates the need for an invasive procedure like Ultrasound or a CT guided biopsy of the mass.
Introduction
Renal biopsy is considered as a GOLD STANDARD technique to confirm or rule out the possibility of renal malignancy. Computed Tomography (CT) scan can to a great extent help us to make a diagnosis of renal malignancies, but the findings seen are not always pathognonomic of renal cell carcinoma. Most of the times, nephrectomy is done as the treatment for such masses and the specimen is sent for biopsy studies to confirm the nature of the disease. In patients who are unfit or unwilling to undergo surgical procedure, or in whom a preoperative diagnosis is mandatory to initiate a neo adjuvant chemotherapy, a tissue diagnosis is mandatory. Renal biopsy, though confirmative, may not be possible in all settings due to patient’s poor general condition. In such settings, a need for advanced imaging techniques that can predict malignancy with a high degree of accuracy arises and becomes the need of the hour. The overall incidence of the renal masses is on the rise. With better imaging modalities more of these masses are picked up earlier, more often as incidentalomas. Most of the times, the diagnosis is confirmed after radical nephrectomy. More often there is an inherent tendency to offer overtreatment in cases of benign renal masses. Renal biopsy to discriminate benign from malignant masses can be very useful in such instances but are more invasive. With the availability of better imaging modalities and ever increasing health awareness amongst the public, solid renal masses are becoming increasingly diagnosed in earlier stages these days, especially when the size of the mass is very small [1,2].
Small renal masses are defined as tumours less than 4 centimeters [3]. About 60 to 80% of small renal masses are malignant, while the rest could be cystic or benign solid renal masses [4]. They are more complex to manage, as distinguishing them as benign or malignant is extremely difficult. CT aided classification systems have, to a certain extent, helped us in pre operative diagnosis and differentiation of benign and malignant renal masses [5].
Texture analysis in CT images of the pathological kidney is an intricate task. This requires appropriate textural descriptors that reflect the biological properties of the pathological tissue. The study aims at developing a new software approach to analyse CT texture features, which would facilitate detecting changes in solid renal masses. As not much of literature evidence is available on this research on solid renal masses, this study was different from previous other works in that we performed 3D texture features of all renal masses and also made a comparison with a control group of normal renal parenchyma.
Most of the previous works related to texture analysis were done on small renal masses. Linguraru applied semi-automatic segmentation with manual point seeding and geodesic active contours to obtain renal tumours from CT images [6]. Kim suggested an automated method for (Selected Reaction Monitoring) SRM detection and segmentation from CT images, including mass seed detection with texture analysis [7]. CT scan has been widely used to confirm the diagnosis of renal masses. About 85% of expansive solid masses in the kidney are malignant [8,9]. Any solid mass in the kidney is considered to be malignant unless proved otherwise [10,11]. But still, sometimes there will be a diagnostic dilemma in making a definitive diagnosis from these CT images. In such instances, in order to enhance the quality of these images, various image processing techniques may be applied for a better understanding of hidden information as well as for extracting some parameters or features that will be useful for making a definitive diagnosis from these images.
Computer Aided Diagnostic (CAD) systems are being widely used for the segmentation of kidney and its neighboring organs. The input RGB (Red, Green, and Blue) image is converted into gray scale image and resized into 512 X 512 pixels [12]. The purpose of gray scale image is to give the anatomical information, illuminates the abnormalities and lesions.
In order to more accurately segment the kidney images, several types of segmentation methods, such as image-based, model-based and hybrid methods are employed. Ultrasound imaging test is a screening test that is non invasive with no exposure to radiation and safer in pregnancy, but speckle noise occurs. Noise free scanning CT images have high Signal-to-Noise Ratio (SNR) and provide an accurate anatomical structure [13]. The quality of noble image, and the advanced Digital image techniques, inspires the researcher to develop the computerized methods for the anatomical automated renal analysis [14]. Kobashi and Shapiro described the anatomical information, identification and extraction of renal segment from normal CT image [15]. Tsagaan and Shimizu et al., proposed a deformable model approach for automatic renal segmentation [16], represented by the gray level appearance of renal segmentation. Manually or semi- automatically produced images were used because of the similarities between the gray levels in adjacent organs, contrast media effect and relatively high variation of organ’s positions and shapes in abdominal CT images and uses labeling method [17,18]. Medical image segmentation through tissue surface analysis and maximum dispersal directions were also being studied by various authors [19,20].
Need for this Study
Image classification is one of classical problems of concern in image processing. The goal of image classification is to expect the categories of the input image using its features. One of the most important features is the Gray-Level Co-Occurrence Matrix (GLCM). The GLCM is recognized as the most representative algorithm in spatial texture-related research. Kim et al., applied a 3D GLCM to organs of the human body in CT images [21,22].
The purpose of this manuscript was to try and analyse various parameters by feature extraction of CT images and see whether they would aid in differentiating benign and malignant renal masses.
Materials and Methods
This was a prospective study done over the past three years from June 2014 and May 2017, conducted at a single teaching medical institution. The study was approved by the Institutional Review board and Ethics committee clearance was also obtained.
About 188 contrast enhanced CT images of the whole abdomen were interpreted in our study. All solid renal masses, either appearing benign or malignant in CT scan were included in our study. Those patients with cystic renal masses, indeterminate renal masses and those in whom a tissue confirmation was not obtained either by percutaneous biopsy or by nephrectomy were all excluded from our study. The 188 patients were equally divided into two broad groups of 94 patients each: Group 1 was patients with renal mass, of which 67 were malignant and 27 were benign. The group 2 was the control group, where kidneys from normal persons who were scanned for other ailments were studied for comparison. In group 1, of the 67 patients with malignant mass, 49 had undergone radical nephrectomy. The remaining 18 patients were either unfit for the surgical procedure or were unwilling or were metastatic or needed targeted therapy and hence underwent ultrasound or CT guided biopsy. The 27 patients with benign masses were either found to have angiomyolipoma or adenomas or complex solid/cystic masses.
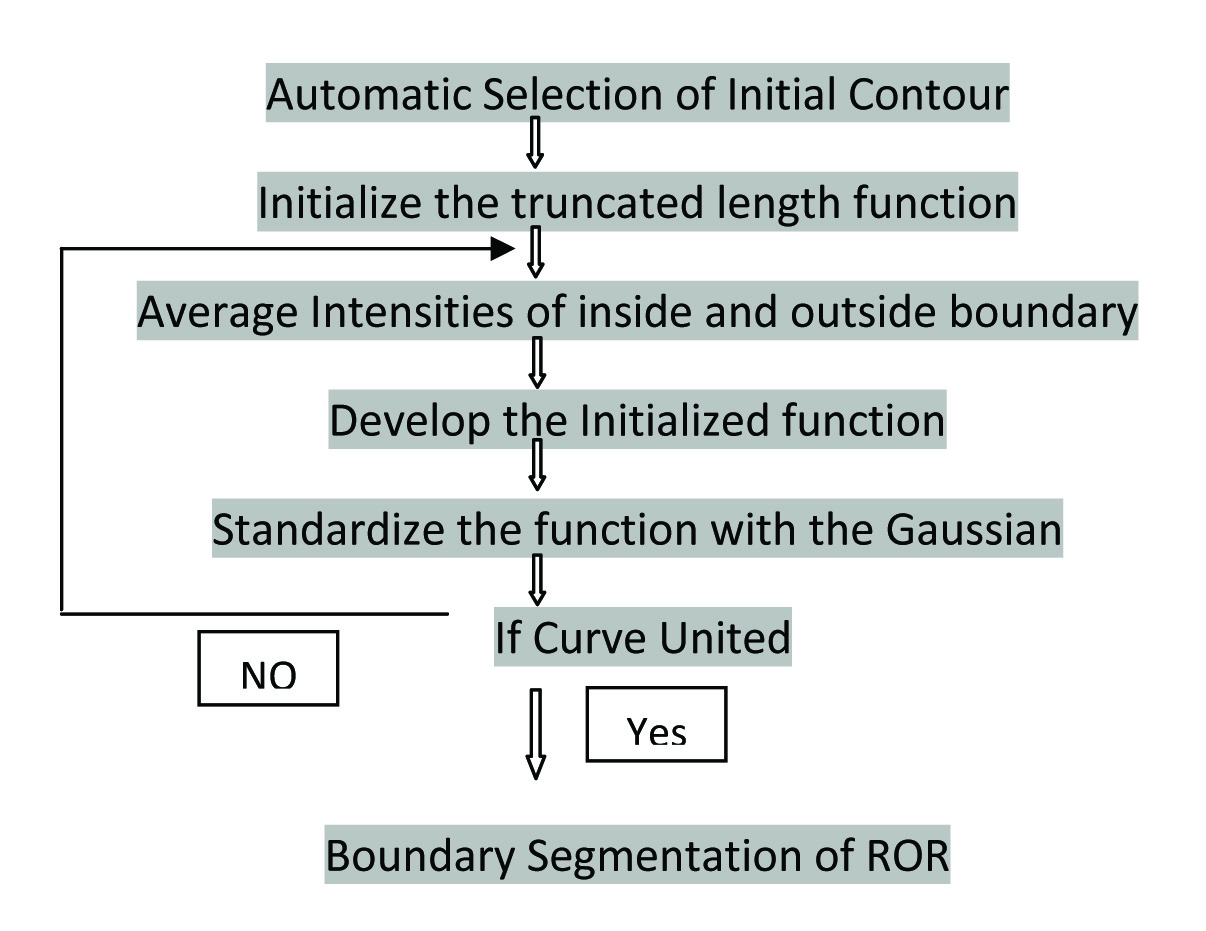
Human eye interpretation of CT images has its own inherent fallacy. Even though enhancement is considered as an entity strongly favoring malignancy, there are many enhancing benign masses and non enhancing malignant masses that may cause considerable confusion to the naked eye interpretation. This may lead to mal-diagnosis and hence there is a compulsion for an enhanced automated renal segmentation. The current workflow is illustrated in the [Table/Fig-1].
Algorithm showing the work flow.
Morphological method: The mathematical morphology method was used for feature extraction of renal image and looking for infiltration into the neighboring organs. The representation and description of neighboring pixels, boundaries, and lesions were implemented. In our study, during segmentation, some images of Region Of Renal (ROR) image were blinded. Hence the morphological method failed to provide adequate information.
Active contour segmentation: Active contour method is the technique where a form of snake style of boundary shape is obtained by the contour segmentation of same pixels. Snake model will show the origin of curve and ends in the same point of curve. The approximate shape of boundary was obtained by the snake model, with signed pressure force. There are various components of Active contour method.
A. Preprocessing
Despite their popularity, deformable model-based methods fail in the case of excessive image noise, poor image resolution, or diffused boundaries. Noise evacuation of such medical images requires certain preprocessing techniques to be deployed. The Weiner filter is used to build the nature of the image by noise concealment and contrast enhancement.
B. Segmentation
The goal of segmentation is to simplify the image into a more meaningful and easier to analyse data. Image segmentation is technically used to locate interested objects, boundaries (lines, curves, etc.,) and involvement of adjacent organs.
C. Active Contour Method
Active contour method is an energy minimizing spline which detects the required features within an image. It is a flexible curve which can be energetically adjusted to the required edges or objects in an image. The active contour is also called as Geodesic contour/snake model/region based/edge based model. The region grown is planned based on the boundary defined. The main drawback of this technique is that it occurs when the characteristics of tissues in the region of interest is similar to that of the surroundings. Hence image segmentation is a challenging problem for region based model.
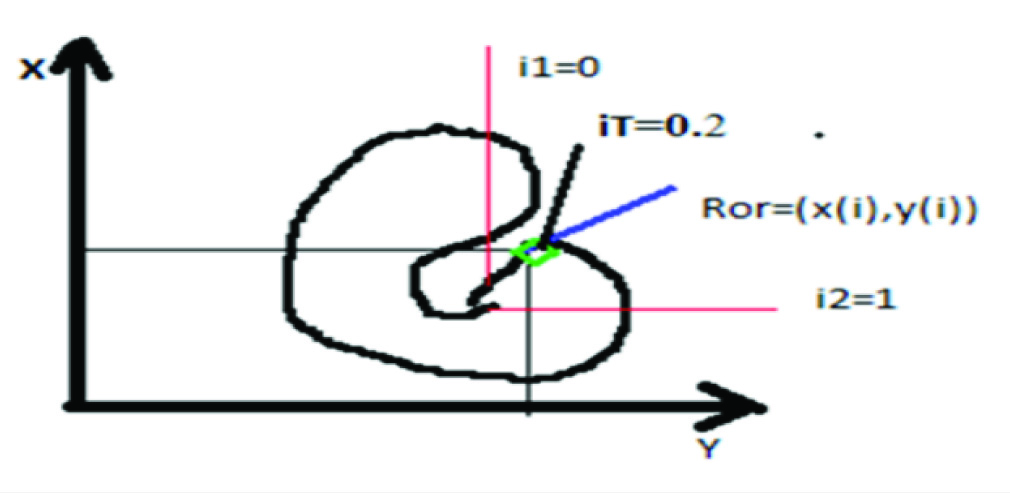
i. Basic curve form of active contour: [Table/Fig-2] illustrates the starting point of the curve as i1=0 and it extends to the same pixel region with threshold iT=0.2 with the signed pressure force of default iteration. The contour is defined by the curve ROR with the function of x(i),y(i). The letter ‘i’ is the range of value from 0 to 1. It minimizes the energy ‘E’.E= Eint+Eext, where Eint is the internal energy of the curve that grows inwards/shrinks in the contour and the Eext is the propagation of curve towards the object boundary.
Basic curve form of Active Contour method.
ii. Selection of seed points: Uncontrolled cells in the control region extrudes into the neighboring organs which has the similar features of renal lesion region. Based on K-Nearest Neighbours Algorithm (KNN) classification, the control regions in the test were deleted and the lesion region is retained [23]. In this respect, effective seed points should be selected to delete the control region.
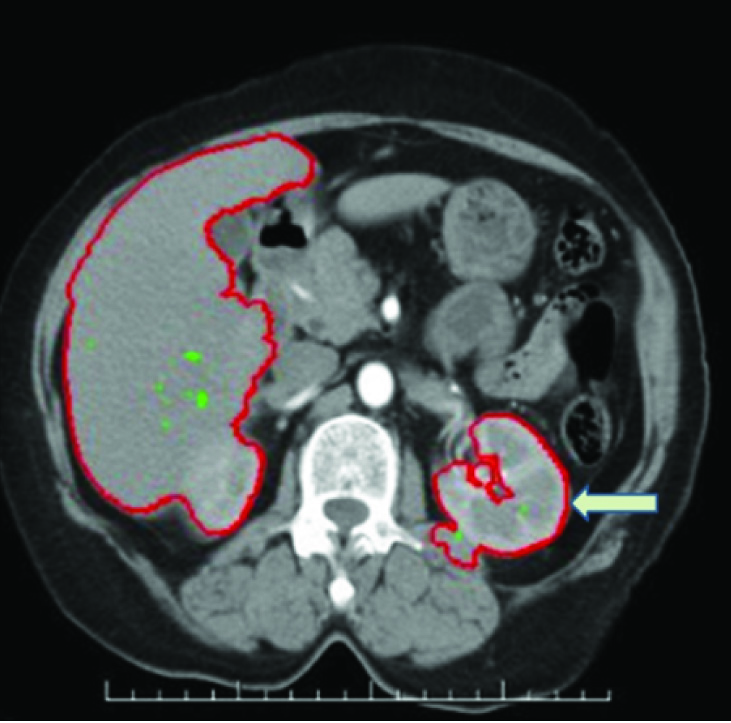
iii. Region growing segmentation: Smoothness of boundary is obtained by the snake model detection roaming method. Active contour method was used to extract a closed curve contour of filtered image which was the boundary of the speculated mass. The region of interest is fixed of the same pixel intensity of each image. The processing self-time of each image is 0.929 secs compared to Morphological method (1.023 secs). Differentiation of Benign and Malignant images is accurately classified. However the seed points act as initial contour of Active contour. The region growing algorithm form the level set function of boundary detection of lesion. The accuracy of Active contour method depends on the minimum fitting length. Minimum fitting length produces high pressure of optimum threshold with closed curve of lesion, which is opt to fast Balloon tracking system of a boundary. The overview of proposed contour method is illustrated in [Table/Fig-3].
Renal boundary segmentation of computed tomography image, showing peri nephric extension (marked in arrows).
D. Extraction of Features
Gray Level Co-occurrence Matrix (GLCM) is a widely used spatial texture related research parameter. Results obtained from the co-occurrence matrices are of very high quality when compared with other texture characters. The statistical parameters are entropy, contrast, energy, homogeneity and correlation of the sample textures. These parameters are handled using MATLAB software. It computes the statistical features based on image gray level intensity. The application of GLCM is useful in texture analysis, image segmentation, retrieval, and analysis and image classification. Even though 12 GLCM parameters were initially analysed, only six of them were selected for our study, as they were found to be statistically significant. Those parameters that classically distinguish benign and malignant from the control group were individually analysed. The p-value of <0.05 is considered to be statistically significant.
Statistical Analysis
Data analysis of significant difference (p<0.05) for each feature was individually calculated with the help of Sigma Stats 4.0 software of one-way ANOVA analysis. The test of hypothesis was performed to find the significant difference between the renal lesion parameters. The p-value of <0.050 determines the significant difference between them. The Test of Hypothesis was null hypothesis i.e., there is significant differences occur with two equal variances. Selection of best features based on one way analysis of anova from the extracted features reduces the cost of feature measurement, increases classifier efficiency, and allows higher classification accuracy.
Results
A total of 188 patients’ CT images were studied. [Table/Fig-4] illustrates the demographic data of the patients studied. Males were more commonly affected than females. Left side was three times more commonly involved than the right side.
Demographic data of the CT images studied.
| Period of study | 3 years(June 2014–May 2017) |
|---|
| Total no. of CT images studied | 188 |
| Malignant | 67 |
| Biopsied | 18 |
| Underwent Radical nephrectomy | 49 |
| Benign | 27 |
| Control | 94 |
| Male-Female ratio |
| Tumour group | 1.7:1 |
| Control group | 2.2:1 |
| Laterality |
| L:R | 3.1:1 |
About 12 CT imaging features were considered for the study. All the 94 patients with renal masses and the remaining 94 from the control group were studied using these 12 parameters. [Table/Fig-5] illustrates in detail, the comparison between the benign, malignant and the control groups. From the tabulation it was evident that the six parameters namely, entropy, energy, sum average, sum variance, inertia and low gray level emphasis were found to be showing statistically significant data which helps the clinician to differentiate the benign from the malignant renal masses. The other six parameters (7 to 12) were not so helpful to differentiate the benign from malignant renal masses.
CT imaging features extracted for benign, malignant and control.
| S.NO | Parameters(No. of Subjects) | CONTROL(94)Mean±S.D | BENIGN(27)Mean±S.D | p-value | MALIGNANT(67)Mean±S.D | CONTROL(94)Mean±S.D | p-value | BENIGN(27)Mean±S.D | MALIGNANT(67)Mean±S.D | p-value |
|---|
| 1 | Entropy | 0.6670±0.13 | 0.6030±0.14 | <0.001 | 0.9738±0.47 | 0.6670±0.13 | <0.001 | 0.6030±0.14 | 0.9738±0.47 | <0.001 |
| 2 | Energy | 1.0008±0.001 | 1.0031±0.0002 | 0.00012 | 1.0030±0.005 | 1.0008±0.001 | <0.001 | 1.0031±0.0002 | 1.0030±0.005 | <0.001 |
| 3 | Sum Average | 0.3989±0.18 | 0.3267±0.13 | <0.001 | 0.9031±0.65 | 0.3989±0.18 | <0.001 | 0.3267±0.13 | 0.9031±0.65 | <0.001 |
| 4 | Sum variance | 2.6042±2.23 | 1.8663±0.86 | <0.001 | 6.9512±6.06 | 2.6042±2.23 | <0.001 | 1.8663±0.86 | 6.9512±6.06 | <0.001 |
| 5 | Inertia | 0.15975±0.074 | 0.1452±0.04 | <0.001 | 0.26827±0.15 | 0.15975±0.074 | <0.001 | 0.1452±0.04 | 0.26827±0.15 | <0.001 |
| 6 | Low Gray level Run Emphasis | 140.71±3.90 | 131.62±18.56 | 0.0020 | 102.71±35.41 | 140.71±3.90 | <0.001 | 131.62±18.56 | 102.71±35.41 | <0.001 |
| 7 | Kurtosis | 1.0603±0.03 | 1.1063±0.61 | 0.4070 | 1.0480±0.015 | 1.0603±0.03 | 0.014 | 1.1063±0.61 | 1.0480±0.015 | 0.4070 |
| 8 | Short Run Emphasis | 0.4980±0.014 | 0.4864±0.04 | 1.000 | 0.4983±0.05 | 0.4980±0.014 | 0.024 | 0.4864±0.04 | 0.4983±0.05 | 0.362 |
| 9 | Run Percentage | 0.1246±0.007 | 0.1254±0.04 | 0.359 | 0.3367±0.27 | 0.1246±0.007 | 0.015 | 0.1254±0.04 | 0.3367±0.27 | 1.000 |
| 10 | Long Run Emphasis | 4154±288 | 4443± | 0.992± | 2703±1098 | 4154±288 | 0.033 | 4443± | 2703±1098 | 0.359 |
| 11 | Correlation | 0.8683±0.052 | 0.8171±0.03 | 0.4540 | 0.9001±0.05 | 0.8683±0.052 | <0.001 | 0.8171±0.03 | 0.9001±0.05 | 0.992 |
| 12 | Homogeneity | 0.9724±0.004 | 0.9613±0.01 | 0.646 | 0.9739±0.004 | 0.9724±0.004 | 0.013 | 0.9613±0.01 | 0.9739±0.004 | 0.202 |
one-way ANOVA analysis was used
[Table/Fig-6] illustrates the extracted CT features of malignant renal masses. Of the 67 patients, 18 of them had a preoperative renal biopsy done. These 18 patients were those, who needed tissue diagnosis made, as they were either unfit for radical nephrectomy or offered neo adjuvant targeted therapy. The remaining 49 patients had a radical nephrectomy done. All the 67 were confirmed to have renal cell carcinoma. When the same 12 parameters were analysed, the first 6 parameters that clearly distinguished benign from malignant renal masses, showed no difference in the values between these two sub groups. This clearly illustrates that these six parameters were able to predict and differentiate benign from malignant masses with a high degree of accuracy.
Mean values and Standard Deviations of the extracted features of noninvasive CT imaging and invasive of CT guided Biopsy.
| S.NO | Parameters (No. of Subjects) | RADICAL NEPHRECTOMY (49)Mean±SD | BIOPSY(18)Mean±SD | p-value |
|---|
| 1 | Entropy | 0.7348±0.26 | 0.9173±0.04 | 0.3247 |
| 2 | Energy | 1.0010±0.001 | 1.0215±0.005 | 0.3476 |
| 3 | Sum Average | 0.5847±0.34 | 0.3341±0.03 | 0.1020 |
| 4 | Sum variance | 4.1305±2.83 | 25.937±0.09 | 0.1265 |
| 5 | Inertia | 0.2005±0.11 | 0.4717±0.06 | 0.2134 |
| 6 | Low Gray level Run Emphasis | 139.29±34.38 | 125.32±1.11 | 0.4134 |
| 7 | Kurtosis | 1.0603±0.02 | 1.5860±0.06 | 0.4814 |
| 8 | Short Run Emphasis | 0.5068±0.05 | 0.6333±0.33 | 0.3469 |
| 9 | Run Percentage | 0.2942±0.26 | 0.4854±0.01 | 0.4121 |
| 10 | Long Run Emphasis | 4945±2503 | 4944±2499 | 0.4208 |
| 11 | Correlation | 0.8943±0.05 | 0.9662±0.009 | 0.1135 |
| 12 | Homogeneity | 0.9739±0.003 | 0.9741±0.002 | 0.2325 |
Statistical analysis was done with the help of Sigma Stats 4.0 software and one-way ANOVA analysis
This clearly depicts that these 6 parameters are significant enough to suggest that with the help of an non invasive technique like CT scan, it is possible to clearly distinguish the benign from malignant renal masses.
Discussion
Gray Level Co-occurrence Matrix (GLCM) is a widely used texture descriptor. It is well known that the results obtained from co-occurrence matrices are better than the other texture discriminations methods [24]. GLCM computes the statistical features based on gray level intensities of the image. Such features of the GLCM are useful in texture recognition, image segmentation, image retrieval, colour image analysis, image classification, object recognition and texture analysis methods [25,26].
In our study, we performed whole-tumour volumetric textural analysis using GLCM and found that tumours demonstrating more heterogeneity were associated with a higher incidence of malignancy. It has been proposed that greater biologic heterogeneity may be associated with oxidative stress, promotion of survival factors, and genomic instability [27,28].
Several studies have suggested that increasing heterogeneity is associated with malignancy [29]. Till date, as far as our knowledge goes, no studies have directly addressed primary renal cancer heterogeneity. However, there are published literatures available on similar studies in various other organs in the body.
Ganeshan et al., in their study on 21 patients with primary esophageal cancer, correlated unenhanced CT texture analysis with positron emission tomography Standardized Uptake Value (SUV) and clinical staging. They identified that the coarse texture uniformity correlated negatively and entropy correlated positively with standardized uptake value [30]. The same authors, in another study on 17 patients with non–small cell lung cancer, observed that the unenhanced CT texture analysis coarse texture uniformity also correlated negatively with tumour stage. However, uniformity correlated negatively with the standardized uptake value [31]. In summary, from our study we could infer that fine texture features like entropy, energy, sum average, sum variance, inertia and low gray level emphasis were associated with a higher probability of diagnosis of malignant renal masses.
Limitation
From our preliminary reports it is evident that it is possible to a greater extent to distinguish benign from malignant renal masses, based on the two dimensional CT scan images. However, more studies are required to extrapolate this technique of texture analysis to three dimensional CT images. Difficulty in getting adequate number of benign renal masses for comparison during the prescribed study period also added on to the limitations of our study.
Conclusion
Our data showed that GLCM parameters are crucial tool for the determination of the solid mass composition of tumour. The significant advantage of these tests is that they are easy to perform at an affordable cost and have high rate of efficiency. The planned method of segmentation of the malignant renal masses by Axial CT image is done on Active contour snake model which gives efficient results, largely obviating the need for an invasive procedure like Ultrasound or a CT guided biopsy of the mass. As there is a paradigm shift in offering patients targeted therapy for renal malignancies and an ease of introducing post processing tools like GLCM into clinical application, texture analysis shows a great promise as a clinical prognostic tool in the near future.
one-way ANOVA analysis was used
Statistical analysis was done with the help of Sigma Stats 4.0 software and one-way ANOVA analysis
[1]. Jayson M, Sanders H, Increased incidence of serendipitously discovered renal cell carcinomaUrology 1998 51:203-205.10.1016/S0090-4295(97)00506-2 [Google Scholar] [CrossRef]
[2]. Gill IS, Aron M, Gervais DA, Jewett MA, Clinical practice. Small renal massN Engl J Med 2010 362:624-34.10.1056/NEJMcp091004120164486 [Google Scholar] [CrossRef] [PubMed]
[3]. Abou Youssif T, Tanguay S, Natural history and management of small renal massesCurr Oncol 2009 (Suppl 1):S2-7.10.3747/co.v16i0.40919478901 [Google Scholar] [CrossRef] [PubMed]
[4]. Kang SK, Huang WC, Pandharipande PV, Chandarana H, Solid renal masses: what the numbers tell usAJR. American Journal of Roentgenology 2014 202(6):1196-206.10.2214/AJR.14.1250224848816 [Google Scholar] [CrossRef] [PubMed]
[5]. Tsili AC, Argyropoulou MI, Advances of multidetector computed tomography in the characterization and staging of renal cell carcinomaWorld J Radiol 2015 7(6):110-27.10.4329/wjr.v7.i6.11026120380 [Google Scholar] [CrossRef] [PubMed]
[6]. Linguraru MG, Wang S, Shah F, Gautam R, Peterson J, Linehan WM, Automated noninvasive classification of renal cancer on multiphase CTMedical Physics 2011 38(10):5738-46.10.1118/1.363389821992388 [Google Scholar] [CrossRef] [PubMed]
[7]. Kim DY, Park JW, Computer-aided detection of kidney tumour on abdominal computed tomography scansActa Radiologica 2004 45(7):791-95.10.1080/0284185041000131215624525 [Google Scholar] [CrossRef] [PubMed]
[8]. Pahernik S, Ziegler S, Roos F, Melchior SW, Thüroff JW, Small renal tumours: correlation of clinical and pathological features with tumour sizeJ Urol 2007 178:414-17.10.1016/j.juro.2007.03.12917561161 [Google Scholar] [CrossRef] [PubMed]
[9]. Jemal A, Siegel R, Ward E, Hao Y, Xu J, Murray T, Cancer statistics, 2008CA Cancer J Clin 2008 58:71-96.10.3322/CA.2007.001018287387 [Google Scholar] [CrossRef] [PubMed]
[10]. Pallwein-Prettner L, Flöry D, Rotter CR, Pogner K, Syré G, Fellner C, Assessment and characterisation of common renal masses with CT and MRIInsights Imaging 2011 2(5):543-56.10.1007/s13244-011-0116-122347975 [Google Scholar] [CrossRef] [PubMed]
[11]. Mittal MK, Sureka B, Solid renal masses in adultsIndian J Radiol Imaging 2016 26(4):429-42.10.4103/0971-3026.19577328104933 [Google Scholar] [CrossRef] [PubMed]
[12]. Srougi V, Kato RB, Salvatore FA, Ayres PP, Dall’Oglio MF, Srougi M, Incidence of benign lesions according to tumour size in solid renal massesInt Braz J Urol 2009 35(4):427-31.10.1590/S1677-5538200900040000519719857 [Google Scholar] [CrossRef] [PubMed]
[13]. Magnotta VA, Friedman L, BIRN F, Measurement of signal-to-noise and contrast-to-noise in the fBIRN multicenter imaging studyJournal of Digital Imaging 2006 19(2):140-47.10.1007/s10278-006-0264-x16598643 [Google Scholar] [CrossRef] [PubMed]
[14]. Giger ML, Doi K, MacMahon H, Image feature analysis and computer-aided diagnosis in digital radiography. 3. Automated detection of nodules in peripheral lung fieldsMed Phys 1988 15(2):158-66.10.1118/1.5962473386584 [Google Scholar] [CrossRef] [PubMed]
[15]. Kobashi M, Shapiro LG, Knowledge-based organ identification from CT imagesPattern Recogn 1995 28(4):475-491.10.1016/0031-3203(94)00124-5 [Google Scholar] [CrossRef]
[16]. Tsagaan B, Shimizu A, Kobatake H, Miyakawa K, An automated segmentation method of kidney using statistical informationProc. Medical Image Computing and Computer Assisted Intervention 2002 1:556-63.10.1007/3-540-45786-0_69 [Google Scholar] [CrossRef]
[17]. Gao L, Heath DG, Kuszyk BS, Fishman EK, Automatic liver segmentation technique for three dimensional visualization of CT dataRadiology 1996 201(2):359-64.10.1148/radiology.201.2.88882238888223 [Google Scholar] [CrossRef] [PubMed]
[18]. Campadelli P, Casiraghi E, Lombardi G, Automatic Liver Segmentation from Abdominal CT Scans14th International Conference on Image Analysis and Processing-ICIAP 2007. IEEE Computer Society 2007 :731-736.10.1109/ICIAP.2007.4362863 [Google Scholar] [CrossRef]
[19]. Kubota Y, Mitsukura Y, Fukumi M, Akamatsu N, Yasutomo M, Automatic Extraction System of a Kidney Region Based on the Q-Learning. In: Khosla R., Howlett R.J., Jain L.C. (eds)Knowledge-Based Intelligent Information and Engineering Systems. KES 2005 3681Springer, Berlin, HeidelbergLecture Notes in Computer Science:536-540. [Google Scholar]
[20]. Lin DW, Lei CC, Hung SW, Computer-aided kidney segmentation on abdominal CT imagesIEEE Transactions on Information Technology in Biomedicine 2006 10(1):59-65.10.1109/TITB.2005.85556116445250 [Google Scholar] [CrossRef] [PubMed]
[21]. Kim TY, Choi HJ, Hwang HG, Choi HK, Three-dimensional texture analysis of renal cell carcinoma cell nuclei for computerized automatic gradingJ Med Syst 2010 34(4):709-16.10.1007/s10916-009-9285-620703926 [Google Scholar] [CrossRef] [PubMed]
[22]. Kim TY, Cho NH, Jeong GB, Bengtsson E, Choi HK, 3D texture analysis in renal cell carcinoma tissue image gradingComput Math Methods Med 2014 2014:53621710.1155/2014/53621725371701 [Google Scholar] [CrossRef] [PubMed]
[23]. Fayaz M, Shah AS, Wahid F, Shah A, A robust technique of brain MRI classification using color features and k-nearest neighbours algorithmInternational Journal of Signal Processing, Image Processing and Pattern Recognition 2016 9(10):11-20.10.14257/ijsip.2016.9.10.02 [Google Scholar] [CrossRef]
[24]. Davis LS, A survey on edge detection techniquesComputer Graphics and Image Processing 1975 4:248-70.10.1016/0146-664X(75)90012-X [Google Scholar] [CrossRef]
[25]. Ashok A, Dhivya S, Jansirani S, Soman KP, Combine method of level set with impact on pre-processing for binarization of document images in Tamil scriptInternational Journal of Computer Applications (0975-888) 2012 48(11):48-55.10.5120/7396-0436 [Google Scholar] [CrossRef]
[26]. Rao CN, Sastry SS, Mallika K, Tiong HS, Mahalakshmi KB, Co-occurrence matrix and its statistical features as an approach for identification of phase transitions of mesogensInternational Journal of Innovative Research in Science, Engineering and Technology 2013 2(9):4531-38. [Google Scholar]
[27]. Lunt SJ, Chaudary N, Hill RP, The tumour microenvironment and metastatic diseaseClin Exp Metastasis 2009 26(1):19-34.10.1007/s10585-008-9182-218543068 [Google Scholar] [CrossRef] [PubMed]
[28]. Nelson DA, Tan TT, Rabson AB, Anderson D, Degenhardt K, White E, Hypoxia and defective apoptosis drive genomic instability and tumourigenesisGenes Dev 2004 18(17):2095-107.10.1101/gad.120490415314031 [Google Scholar] [CrossRef] [PubMed]
[29]. Cui C, Cai H, Liu L, Li L, Tian H, Li L, Quantitative analysis and prediction of regional lymph node status in rectal cancer based on computed tomography imagingEur Radiol 2011 21(11):2318-25.10.1007/s00330-011-2182-721713526 [Google Scholar] [CrossRef] [PubMed]
[30]. Ganeshan B, Skogen K, Pressney I, Coutroubis D, Miles K, Tumour heterogeneity in oesophageal cancer assessed by CT texture analysis: preliminary evidence of an association with tumour metabolism, stage, and survivalClin Radiol 2012 67(2):157-64.10.1016/j.crad.2011.08.01221943720 [Google Scholar] [CrossRef] [PubMed]
[31]. Ganeshan B, Abaleke S, Young RC, Chatwin CR, Miles KA, Texture analysis of non-small cell lung cancer on unenhanced computed tomography: initial evidence for a relationship with tumour glucose metabolism and stageCancer Imaging 2010 10:137-43.10.1102/1470-7330.2010.002120605762 [Google Scholar] [CrossRef] [PubMed]