The prevalence of wasting diseases of the teeth is becoming a matter of concern as it is increasing day by day and is in the process of becoming a public health problem, like dental caries. Tooth wear is recognised as a major problem in both children and adults. The triad of erosion, attrition, abrasion has been known for many years but the contribution to erosion has increased in the recent years [1]. Dental erosion has been defined as the loss of tooth tissue by a chemical process not involving bacteria [2]. The changing trend in lifestyle has replaced the commonly consumed fluids like milk and water with carbonated soft drinks, ice creams, ice candies and fruit juices [3].
Ice cream was amongst the fastest growing product categories since 2010 in India. According to a survey conducted most of the people prefer frozen ice cream as their favourite dessert compared to other cakes, cookies, pastries etc., [3]. The ice-cream and frozen dessert market in India is estimated at approximately 27 lac crore rupees in 2009-10. Growing at approximately 12-15 per cent, it is expected to cross 54 lac crore rupees by 2014-15. Increasing incomes, a burgeoning middle class, buoyant economy and widening of outlook contribute in making ice-cream more affordable and acceptable among Indian masses.
Recent studies have shown that frozen fruit juices causes a greater drop in plaque and salivary pH followed by refrigerated juice [1,4-7]. The increased acidity in frozen fruit candies occurs because freezing changes the physical state (i.e., from liquid to solid phase) of the residual juice and as the solute concentrates (as the molecules being tightly packed) there is a decrease in the buffering capacity (which results in prolonged pH fall) [4]. Since ice candies contain ingredients such as citric acid, sugar and flavouring substances similar to juices and it in frozen form, they may have the potency to erode. So with this background, this study was undertaken with the aim to evaluate the dental erosive potency of commercially available and commonly consumed ice candies in India using an invitro model.
Materials and Methods
An invitro experimental study was conducted in the department of public health dentistry Narayana dental college and hospital, Nellore, Andhra Pradesh, India. Study was conducted in the month of February 2016 for duration of 21 days.
Sample Size Determination
The sample size was estimated using a power analysis which was performed based on the data obtained from a previous study conducted by Ali H et al., with standard deviations within groups of 2.13, a least detectable difference of 2.88 and at a power of 90% (alpha error 5% p=0.05) [1]. The sample size estimated was 9.17 for each group which was rounded up to 10. Since there were three groups, sample size of 10 was allotted to each group making it a total of 30 samples.
Ethical Clearance
The study protocol was approved from the institutional review board of the respective institute before the start of the study.
Collection and Preparation of Tooth Samples
For the purpose of invitro study enamel slabs were prepared from 30 extracted premolar tooth samples from healthy individuals for whom the teeth was extracted for orthodontic treatment. All the teeth underwent scaling procedure and stored in formaldehyde for a period of 30 days. The collected teeth were screened for the presence of cracks, hypoplasia or white spot lesions and were excluded if having any one of these. The teeth underwent scaling procedure before cutting the enamel slabs. The crowns of all the permanent premolars were separated from the roots at the cemento-enamel junction and the enamel slabs were cut longitudinally from the crown portion of the tooth. Then enamel slabs of size 4×4×1mm were prepared from extracted tooth and were measured with the help of vernier calipers. Superficial surface of enamel was ground flat with water-cooled carborundum discs and polished with diamond paste and were stored in saline.
Study Procedure
Two most widely distributed, commercially available and commonly consumed ice cream brands in Southern India were selected [7]. From these two commercially available ice cream brands all the various flavoured ice candies were subjected to pH and titrable acidity assessment using a valid method which were used in other studies [5,8-11]. From these different flavoured ice candies the two flavoured ice candies with lowest pH and highest titrable acidity were selected for the study and were compared with a placebo ice candy made up of sterile water. The 30 enamel slabs were divided into three groups, containing 10 samples in each group which were subjected to 21 day pH cycle protocol. Out of 10 samples in each group five samples were subjected to baseline micro hardness assessment using Vickers micro hardness test and five samples were subjected to baseline SEM analysis to assess the surface topographical changes before the start of the study protocol [Table/Fig-1].
Flow-chart showing study procedure.
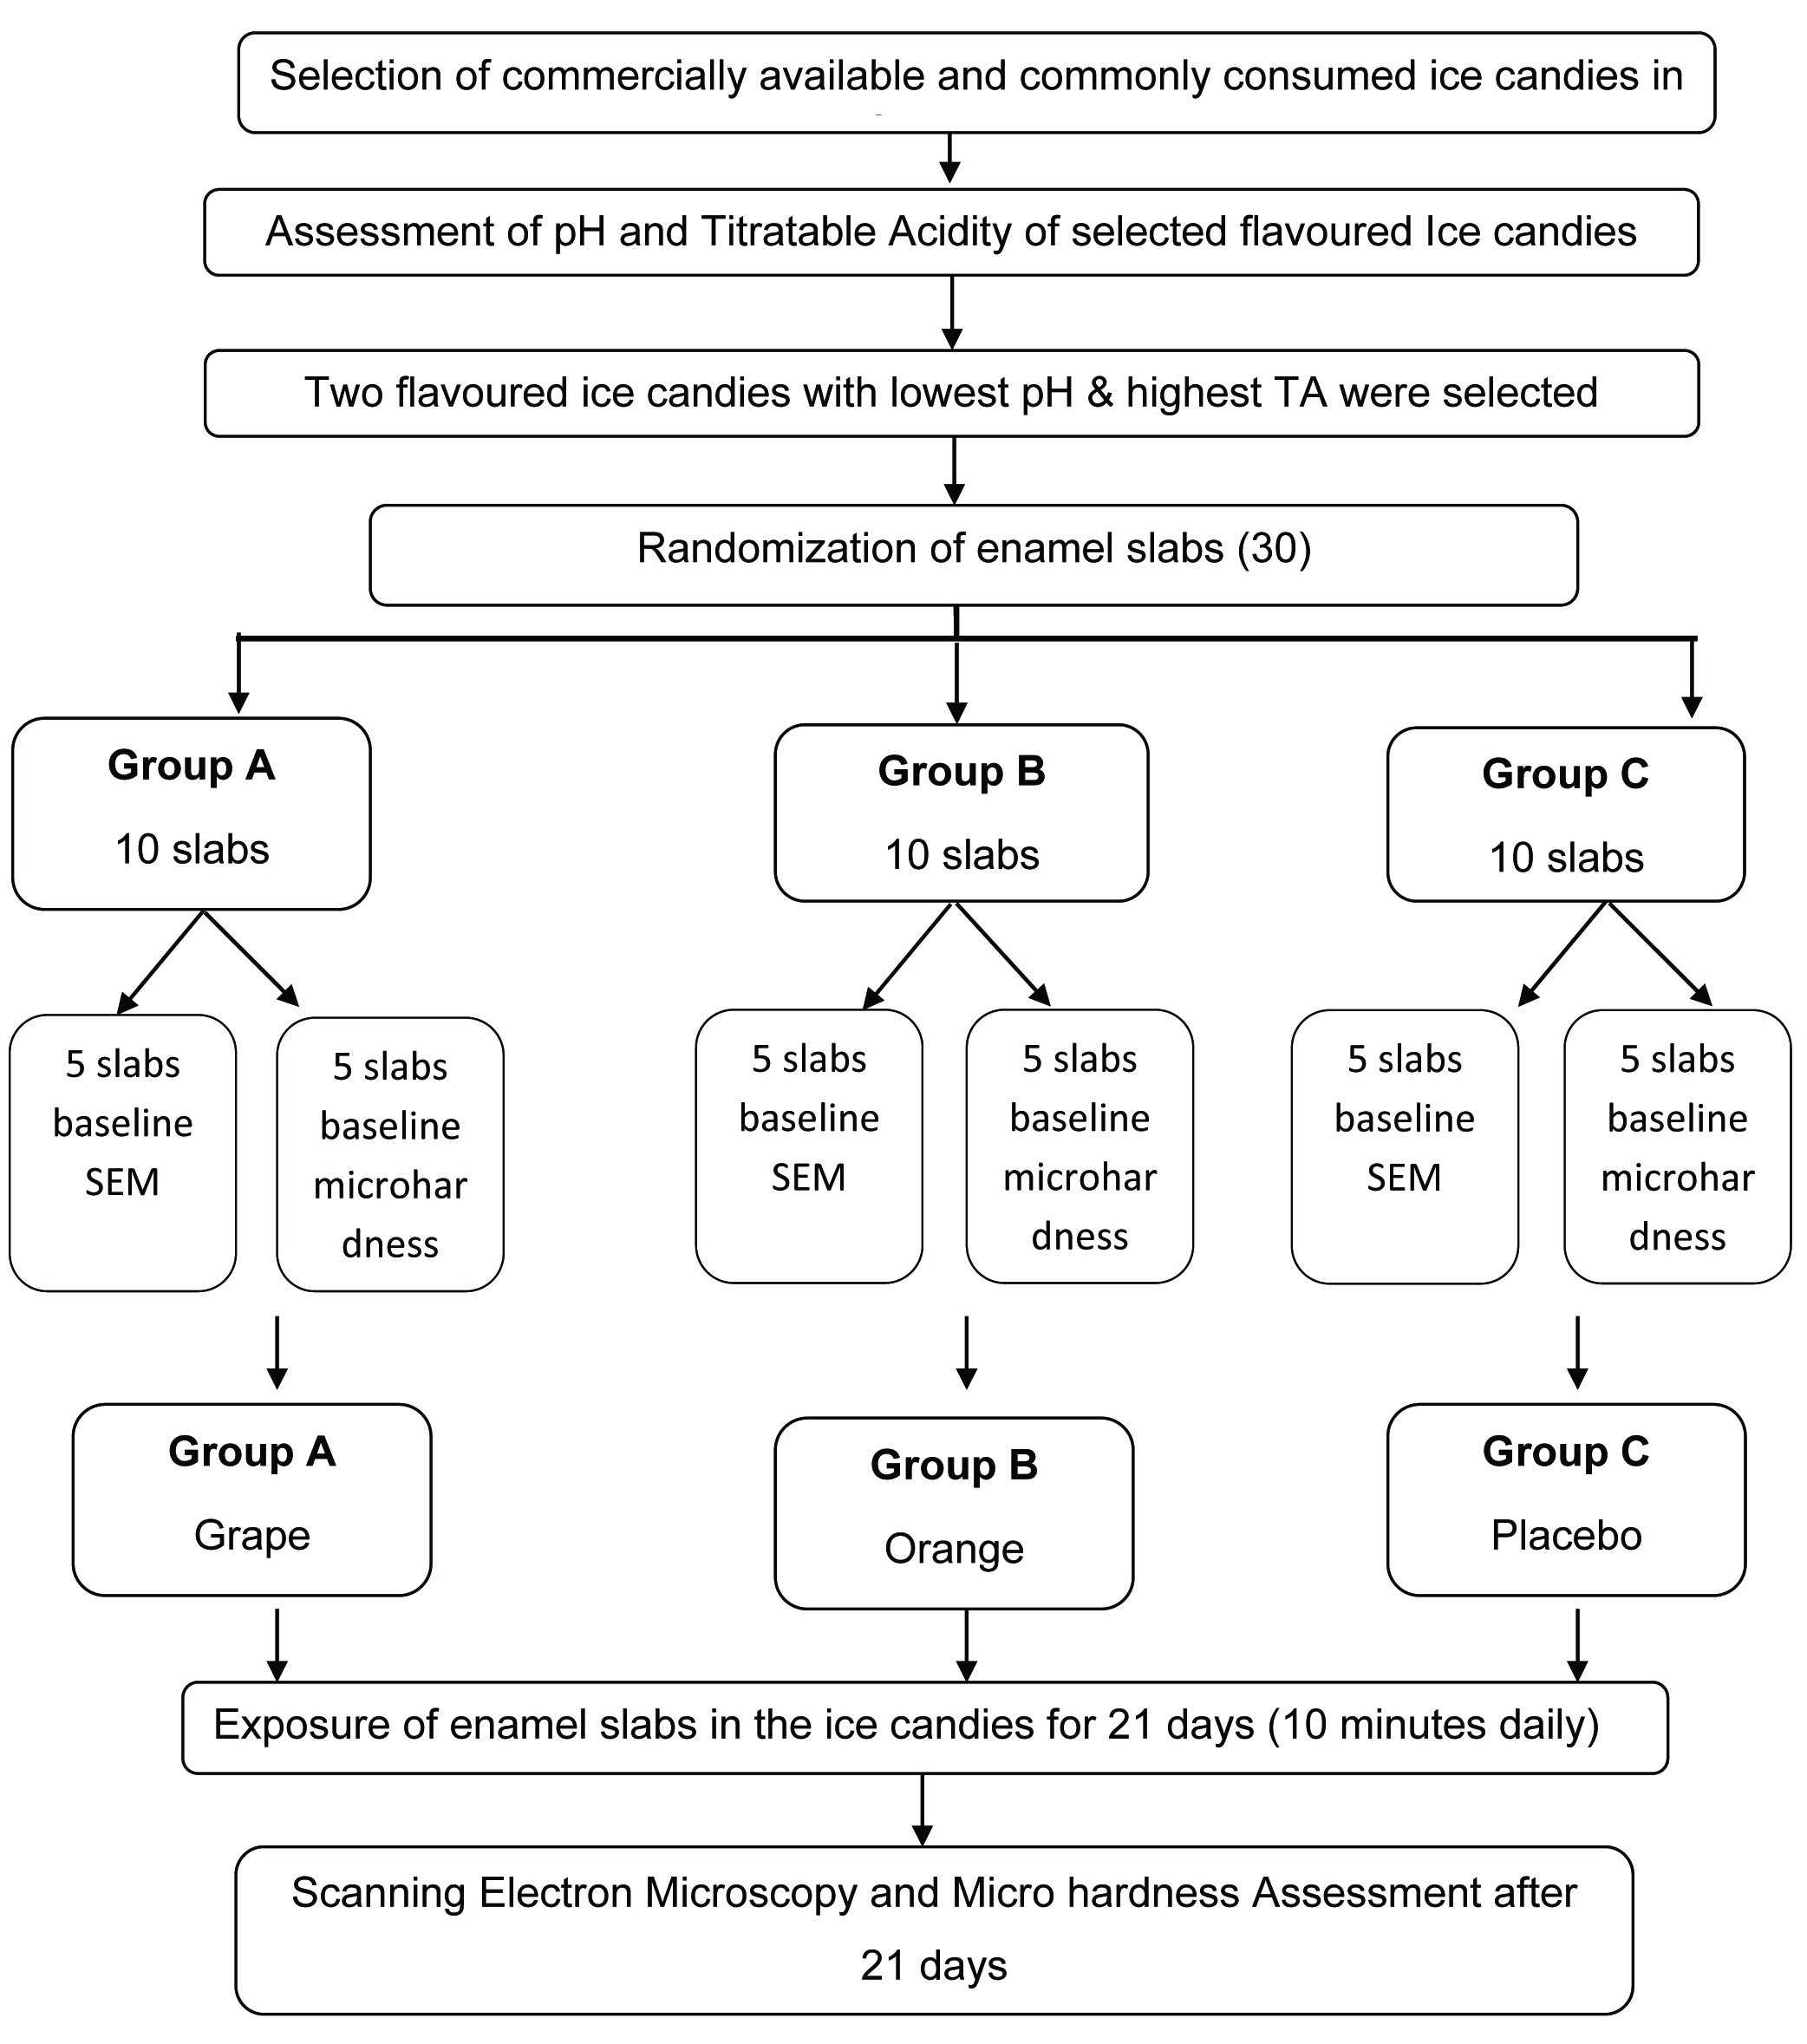
All the enamel slabs after preparation were stored in container with saline. Then from next day the enamel slabs were exposed to two flavoured ice candies and placebo ice candies for 10 minutes daily, then removed and stored in saline for the rest of the day. This process was repeated daily for 21 days to complete one 21 day pH cycling protocol [12-14]. At the completion of the 21 days pH cycling protocol the same enamel slabs which were subjected to baseline SEM and micro hardness analysis were subjected to SEM and surface micro hardness assessment again [Table/Fig-1].
Surface micro Hardness Measurement
Surface micro hardness measurement was undertaken using a Vickers hardness microscope (UHL IMS 4.0 VMHT Application. UHL Technische Mikroskopie Gmbh & Co.KG Asslar, Germany). The slabs were stabilised on a thick base for assessing the micro hardness. The samples were assessed before and at the end of protocol for 13 seconds under 100 grams load and four indentations were made for each sample, two indentations at baseline and two indentations at the end of protocol. The mean of the indentation readings were taken.
Surface Loss Measurement
To evaluate the surface profile of the enamel slabs, the samples were subjected to SEM analysis. The enamel slabs were first dried until vacuum was created and then subjected to sputter coating in Joel sputter coater and then subjected to SEM (HITACHI S-4300SE/N) analysis. The samples were placed in the scanning electron microscope and vacuum was created to make the samples ready for observing the topographic changes. The photomicrographs of the enamel slabs were taken at 10,000X magnifications and the topographic changes were assessed.
Statistical Analysis
The collected data were analysed using SPSS 20 version. Wilcoxon sign rank test was used to compare the difference in means micro hardness scores of baseline and after exposure in enamel slabs within the experimental groups. Mann-whitney test was used for pairwise comparison of micro hardness scores of baseline and after exposure of enamel slabs with in the three experimental groups. Kruskal-wallis test was used for in-between three group’s comparison of micro hardness scores of baseline and after exposure in enamel slabs among three experimental groups.
Results
Grape flavour ice candy with pH of 2.18 and TA of 20 mL from brand A and orange flavour with pH of 2.14 and TA of 23 mL from brand Q ice candies showed the lowest pH and highest TA [Table/Fig-2]. So, these two ice candies, one from brand Q and one from brand A were selected for the study.
pH and titratable acidity values of selected brands/flavours of ice candies estimated using digital pH meter
| Sample material | pH value | Titrable Acidity |
|---|
| 1. Brand –Q: |
| a) Mango | 6.41 | 10 mL |
| b) Grape | 2.18 | 22 mL |
| c) Orange | 2.14 | 23 mL |
| d) Apple | 2.56 | 20 mL |
| 2. Brand –A: |
| a) Mango | 3.41 | 15 mL |
| b) Orange | 2.11 | 22 mL |
| c) Cola | 2.41 | 16 mL |
| d) Grape | 2.18 | 20 mL |
A statistical significant difference was observed between the Vickers hardness number values of the baseline and after exposure of enamel slabs obtained from group A(Grape) (baseline-450.5 VHN, after-349.6 VHN) with mean difference of 100.9 and group B(Orange) (baseline-400.1 VHN, after-298.1 VHN) with mean difference of 102.0. While, there was no statistically significant difference in the Vickers hardness number values of the exposed and unexposed enamel samples of group C (Placebo)(baseline- 451.6 VHN, after-444.3 VHN) with a mean difference of 7.3 [Table/Fig-3]. In-between group comparison using kruskall-wallis ANOVA showed a statistical significance difference in VHN scores between group A, group B and group C after the exposure. One-to-one comparison using mann-whitney test confirmed the statistical significant difference in the enamel micro hardness value after the exposure between group B vs group C (p=0.009) and group A vs group C (p=0.04). There was no significant difference between group A vs group B after the exposure, indicating a significant loss of enamel in enamel slabs exposed to grape and orange ice candy compared to placebo [Table/Fig-4].
Comparison of mean Vickers micro hardness values at baseline and after completion of pH cycle protocol of enamel slabs among three groups
| Group | | Mean VMH | N | Standard Deviation (SD) | Mean difference | Z | p-value |
|---|
| A | Baseline | 450.5 | 5 | 28.58 | 100.9 | -2.02 | 0.04* |
| After | 349.6 | 5 | 17.58 | |
| B | Baseline | 400.1 | 5 | 35.03 | 102.0 | -2.02 | 0.04* |
| After | 298.1 | 5 | 32.90 | |
| C | Baseline | 451.6 | 5 | 14.50 | 7.3 | -4.03 | 0.06 |
| After | 444.3 | 5 | 15.47 | |
Wilcoxon sign rank test
*p<0.05 statisically significant
p>0.05 non-significant, NS
Pairwise comparison of mean Vickers micro hardness values at baseline and after completion of pH cycle protocol for exposed enamel slabs in-between groups
| N | Mean(SD) | Median (Q1-Q3) | Kruskalwallis test | Mann-Whitney U test |
|---|
| A VS B | A VS C | B VS C |
|---|
| Chi square value | p-value | U statistic | p-value | U statistic | p-value | U statistic | p-value |
|---|
| Baseline | A | 5 | 450.5 (28.58) | 349.5 (325.75-375.75) | 2.20 (2) | 0.33 (NS) | 11.50 | 0.83 (NS) | 7.00 | 0.25 (NS) | 6.00 | 0.17 (NS) |
| B | 5 | 400.1 (35.03) | 349.5 (318.50-377.00) |
| C | 5 | 451.6 (14.50) | 364.0 (355.00-379.50) |
| After | A | 5 | 349.6 (32.05) | 309.0 (300.00-347.75) | 7.74 (2) | 0.02* | 7.00 | 0.25 (NS) | 0.00 | 0.04* | 0.00 | 0.009* |
| B | 5 | 298.1 (32.90) | 278.0 (259.25-322.00) |
| C | 5 | 444.3 (15.47) | 362.5 (347.75-374.25) |
Mann-Whitney U test, Kruskalwallis test
*p<0.05 statistically significant
p>0.05 non-significant, NS
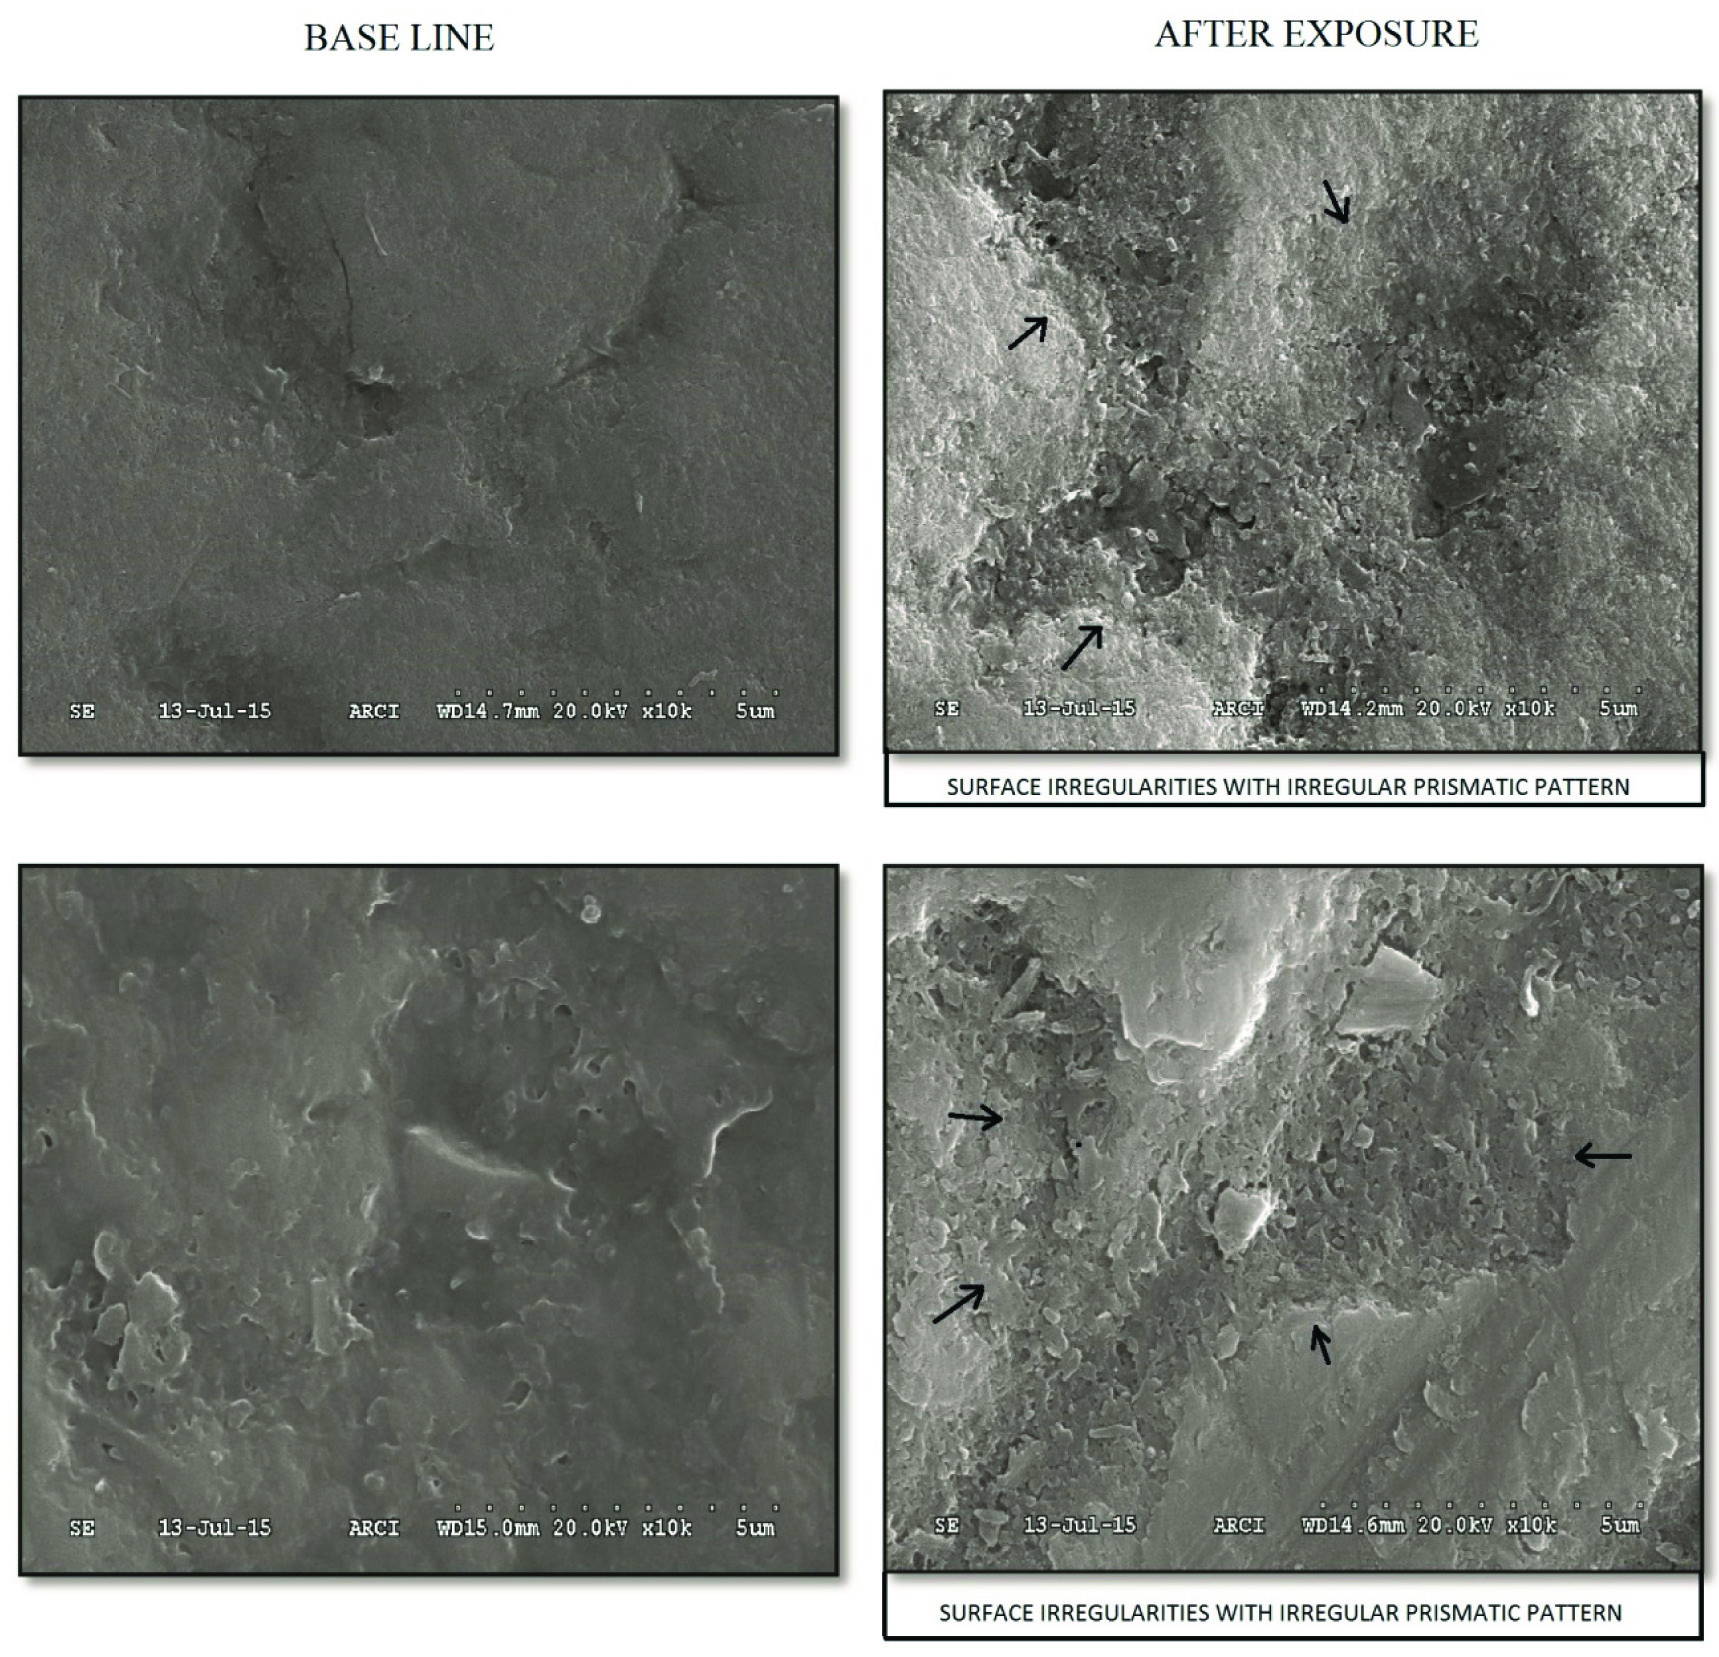
Enamel slabs of group A (Grape) and group B (Orange) after exposure to pH cycle protocol under SEM shows surface topographic changes with irregular prismatic pattern compared to the prismatic pattern of baseline. Surface irregularities were more pronounced and tomes processes were deepened after exposure when compared to the baseline [Table/Fig-5,6]. The images of enamel slabs of group C (placebo) under a scanning electron microscope with 10,000X magnification shows no much difference in the prismatic pattern between baseline and after exposure in the enamel slabs [Table/Fig-7].
SEM (Scanning Electron Microscopy) images of enamel slabs showing baseline and after exposure to pH cycle protocol under 10,000X magnification in group A. Base line pictures showing smooth surface topography and after exposure photograph with arrow marks showing surface irregularities with irregular prismatic pattern.
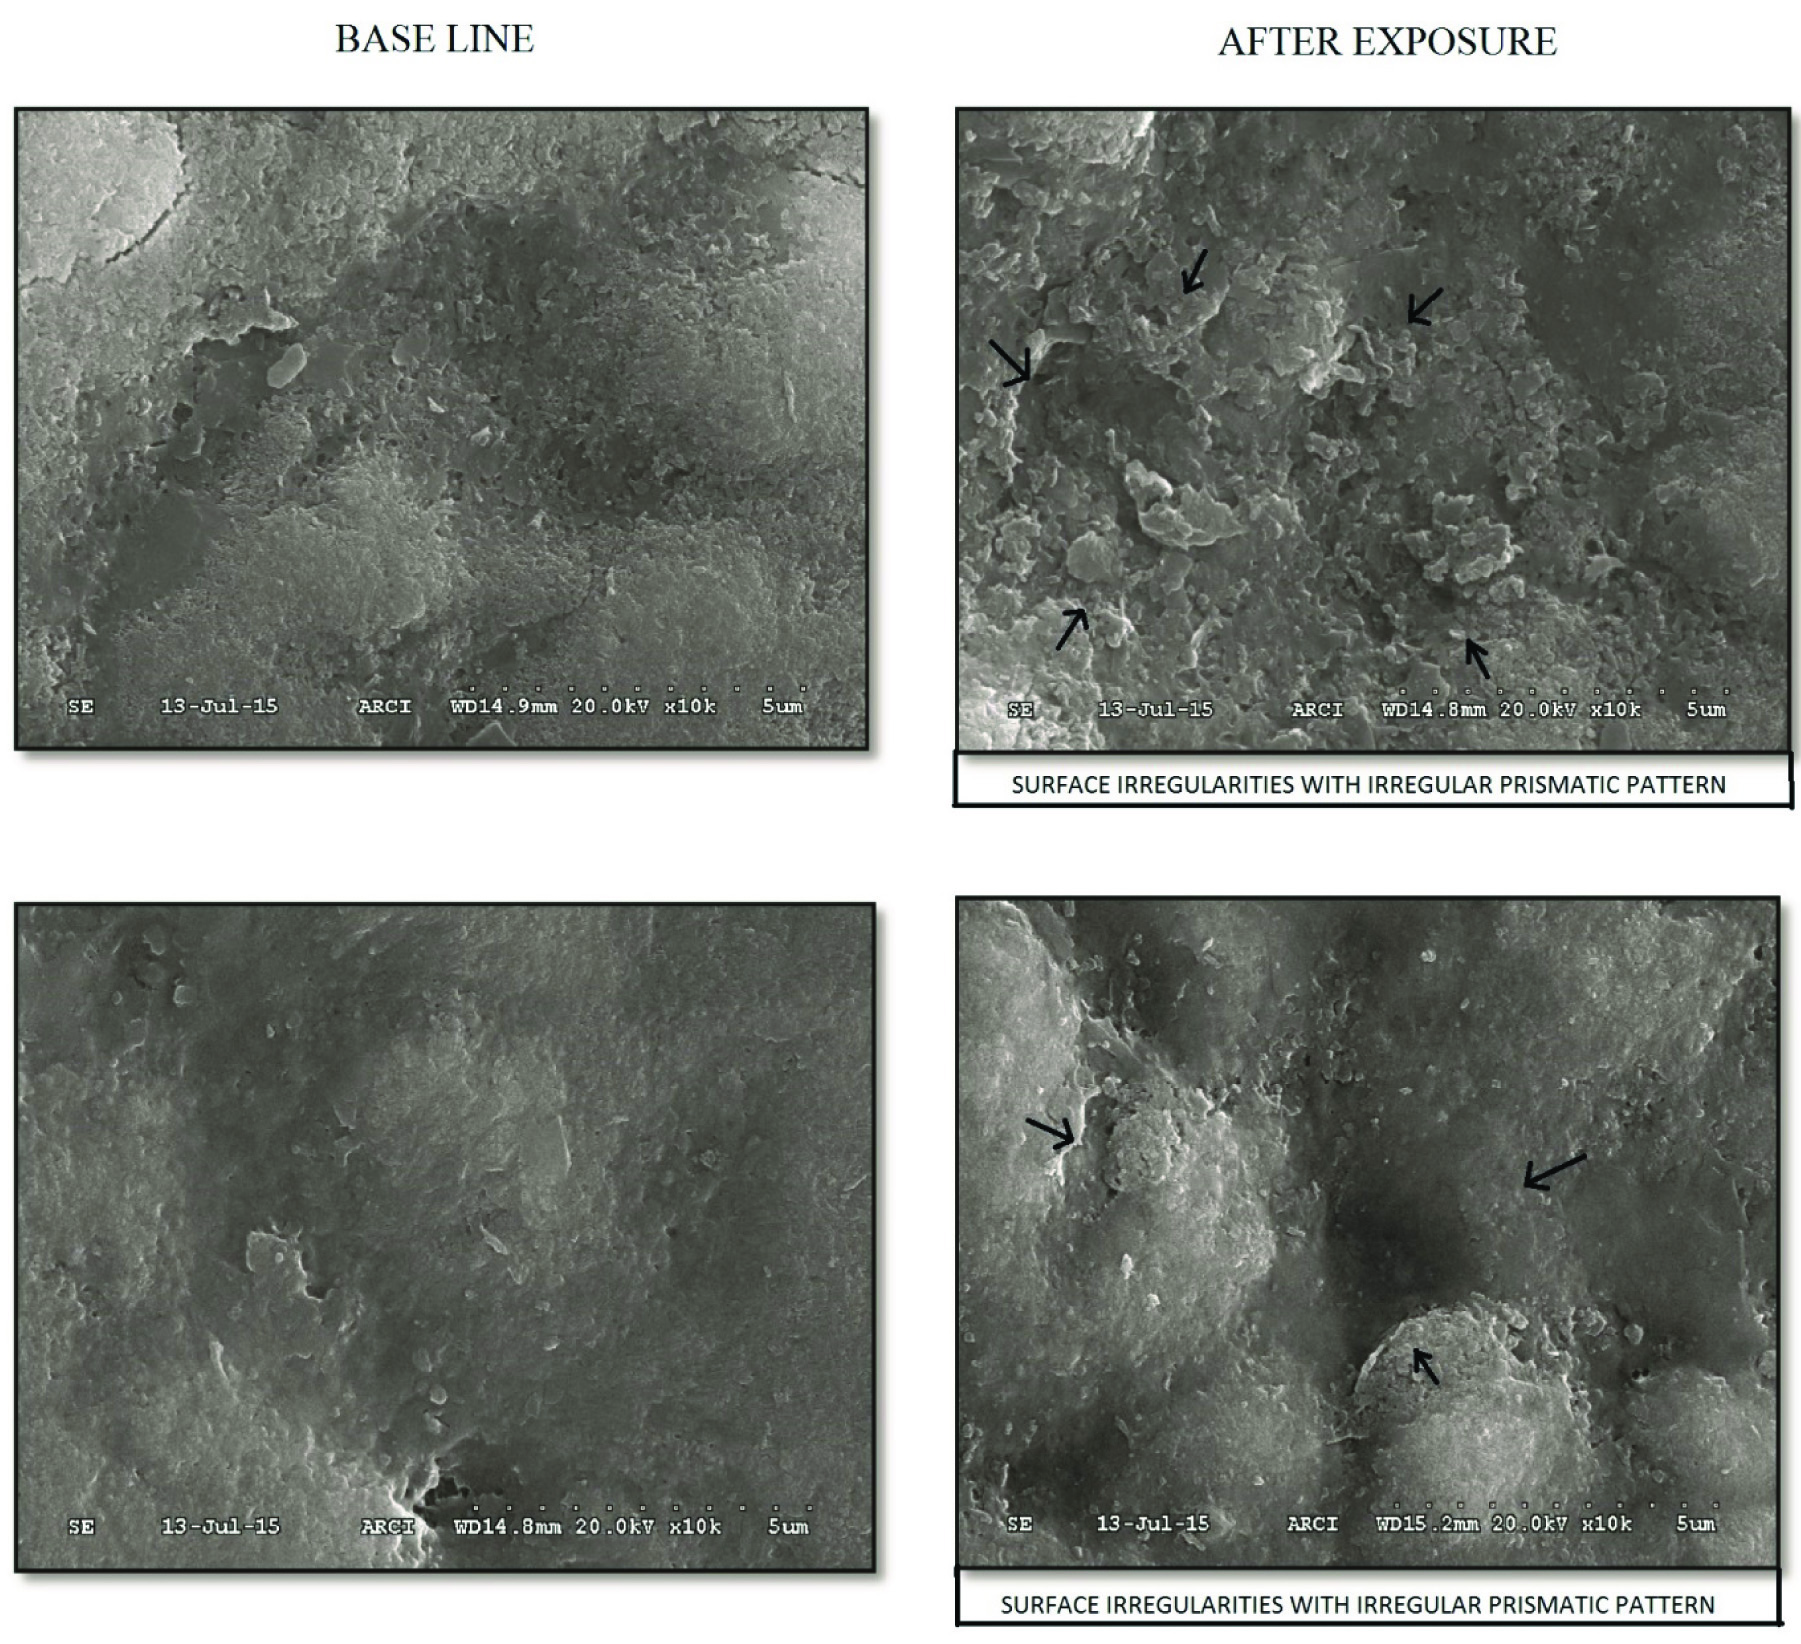
SEM (Scanning Electron Microscopy) images of enamel slabs showing baseline and after exposure to pH cycle protocol under 10,000X magnification in group. Base line pictures showing smooth surface topography and after exposure photograph with arrow marks showing surface irregularities with irregular prismatic pattern.
SEM (Scanning Electron Microscopy) images of enamel slabs showing baseline and after exposure to pH cycle protocol under 10,000X magnification in group C. Both Base line and after exposure photograph with arrow marks shows smooth surface topography

Discussion
The ingredients of ice candies include citric acid, sugar and flavouring substances in frozen form. The erosive activity of citric, malic, phosphoric and other acid ingredients in beverages and foodstuffs has been demonstrated in many in vitro, in situ and in vivo studies [15-18]. Citric acid is a common buffer component in many artificial fruit juices and ice candies. It may act as a chelator capable of binding the minerals (calcium) of enamel or dentine, thus increasing the degree of under saturation and favouring demineralisation [19]. In this work three commonly used laboratory tests (acid/base titration, Vickers surface micro hardness and Scanning electron microscopy) were used to investigate the acidogenic potential of the ice candies that could bring about dental erosion in vitro.
All the methods used in this study have the limitation that they cannot replicate exactly the conditions encountered in the oral environment but they do enable one variable at a time to be studied under carefully controlled conditions and their performance compared to control ice candy. As no human subjects are directly involved in ice candy consumption there is minimal risk and so longer exposure times can be used than would be encountered in vivo. In this context it should noted that tooth substance loss in such tests is considered to be ten-fold greater than would occur intraorally [20].
Two most widely distributed, commercially available and commonly consumed ice cream brands in India were selected [5]. In the present study, 60 ml of ice candy was used as it is the standard amount present in a packet. The results of this pH and TA analysis demonstrated that all ice candies tested were acidic, registering pH values well below the critical pH, at which decalcification can occurs. The reason for decrease in pH may probably due to the presence of citric acid as one of the ingredients in ice candies which has a property to favour demineralization [19]. Freezing changes the physical state (i.e., from liquid to solid phase) of the fruit juice and as the solute concentrates (as the molecules being tightly packed) there is a decrease in the buffering capacity which results in a prolonged pH fall [4].
The enamel slabs were exposed to ice candies for a period of 21 days. For demineralization to occur on teeth in presence of sucrose a minimum exposure of 21 days is required, so 21 days pH cycle protocol was selected for exposure [12,13]. A statistical significant difference was observed between the Vickers hardness number values of the baseline and after exposure of enamel slabs obtained from group A(Grape) with mean difference of 100.9 and group B(Orange) with mean difference of 102. The reason behind the decrease in the micro hardness is due to the mineral loss caused by the acid content of ice candies. Many studies have shown that there is a significant reduction in enamel’s micro hardness under acidic stuffing challenge [6,21,22]. A study by Hannig C et al., has showed that the erosive effects of different acids are pH dependent, which means that even a small decrease of the pH can result in a distinct increase of enamel loss [23].
The SEM analysis of enamel slabs after the completion of pH cycle protocol showed destruction of the enamel ultrastructure with the exposure to grape and orange flavoured ice candies. Surface irregularities were more pronounced after exposure when compared to the baseline, Tomes process were deepened after exposure in the enamel slab. In contrast to this, in placebo group (group C) there is no much difference in the prismatic pattern between baseline and after exposure in the enamel slabs. In the previous works, the effects of surface softening and enamel loss caused by acidic soft drinks have been investigated [24,25]. Especially the erosive effects of soft drinks with citric acid lead to dissolution and softening of human enamel [24,25]. At lower pH, the erosive softening of human enamel increases [24,25]. Rytomaa I et al., conducted a study on invitro erosion of bovine enamel caused by acidic drinks and other foodstuffs using SEM and concluded that there was loss of more enamel in non-saliva treated teeth when compared to teeth with saliva and saliva-fluoride treated teeth [7]. Meurman and Ten Cate stated that any solution with a pH value lower than 5.5 may cause erosion, particularly if the attack is of long duration and repeated over time [26]. This study produced useful information for dental professional and consumers regarding the effect of ice candies on enamel.
Limitation
First, it is important to point out one significant limitation of all laboratory based studies; they cannot replicate the oral cavity exactly. They do, however, prevent unnecessary damage to human teeth which would cause considerable ethical concerns, and they allow each test to be replicated and hence be more comparable.
As an future prospective we recommend some well planned in-vivo studies to be conducted replicating the oral cavity in exact to see the effect of ice candies on dental hard tissue and to overcome the disadvantages of the invitro model.
Conclusion
The commercially available and commonly consumed ice candies in India, which were tested were found to have a low pH which was below the critical pH and had a high TA and were found to be highly acidogenic and potentially erosive as demonstrated by SEM and micro hardness assessment.
Considering the results of this although ice candies are tasty and mouth lingering to eat, it should be recommended to limit their consumption to mealtimes considering both their acidogenic and erosive potential.
Wilcoxon sign rank test
*p<0.05 statisically significant
p>0.05 non-significant, NS
Mann-Whitney U test, Kruskalwallis test
*p<0.05 statistically significant
p>0.05 non-significant, NS