One of the main challenges of dental radiographic interpretation is optimising viewing environment for the observer. Ideal viewing conditions include optimum ambient light [1]. Bright ambient lighting might have an effect similar to glare that impairs ability to detect minor contrast changes such as small carious lesions. This occurs because the contrast acuity of the eye declines as ambient lighting increases. Conversely, very dark room setting causes pupils to dilate; this can excessively degrade the visual perception due to optical aberrations [2].
Radiographic detection of early proximal caries is one of the most difficult and frequent daily tasks in dentistry [3]. A study by Welander U et al., found that extraneous light and improper masking of radiographs reduced the amount of information available to the viewer [4]. Dentists often do not agree on the presence or absence of carious lesions when interpreting the same radiograph, particularly when the lesions are limited to enamel. Yet, radiographs are necessary for caries diagnosis. Caries are viewed on radiographic images as subtle changes of contrast densities on the proximal surfaces [5].
The medical field has established guidelines for ambient light in interpreting radiographs. The American Association of Physicists in Medicine and the American College of Radiology have provided national guidelines regarding acceptable illuminance levels (24-40 Lux) in the room used for radiographic interpretation and grey scale calibration [6,7]. Lux is the SI unit of illuminance and luminous emittance, measuring luminous flux per unit area. This is used as a measure of the intensity, as perceived by the human eye, of light that hits or passes through a surface [8].
There are different opinions when it comes to evaluating lighting conditions’ effects on caries detection. Some previous studies have concluded that when using calibrated monitors, ambient light levels do not affect radiographic caries detection. However, the observers in these studies were experienced dentists [9,10]. Another study by Pakkala T et al., concluded that a high setting monitor display and room luminance did not affect the overall accuracy of radiographic caries detection [11]. Other studies have shown that faint objects such as early carious lesions on dental radiographs are more easily discernible when the ambient light is reduced to levels less than 50 Lux [12,13].
Lighting conditions and magnification play an important role in the diagnostic quality of the radiographs and detection of carious lesions. Hence, the most important variable is the observer [14]. One study suggested that the observer’s experience might influence interpretation of early diagnosis of early periapical pathosis [15]. Experience of observers and their ability to use software to adjust brightness and contrast are as important as the lighting conditions themselves [16]. However, several studies have concluded that intra-observer and interobserver correlations for diagnosis of carious lesions vary [17,18].
Recent studies have focused on experienced dentists in caries detection. However, little attention has been given to students. To our knowledge, only one study, done by Kutcher MJ et al., compared clinicians’ performance with students’ on caries detection. This study showed comparable results between clinicians and students, but also showed high inconsistency in students’ abilities to detect caries compared to experienced clinicians [19]. The study suggested that the diagnostic ability could be improved by hooding laptops in bright clinical environments.
Objective of present study is to measure the effect of ambient light settings on the students’ ability to interpret digital radiographs, in order to enhance their educational experience.
Materials and Methods
This cross-sectional study lasted for approximately 90 days from the Institutional Review Board approval. The study was exempt, declared as non regulated research by UTHSCSA Institutional Review Board (HSC20160644H).
Viewing Conditions: Two different lighting conditions were used in this study: dim and bright environments. The dim environment was the clinic of dental radiology reading and interpretation area (<50 Lux). The bright environment was the faculty station in the student clinical operatory (>800 Lux). A photometer (Extech Instruments, Model LT300, Boston, Massachusetts) was used to measure room luminance. The photometer was placed in front of the screen display with the light sensor facing the reader, in a setting similar to the Pakkala T et al., study [11]. Pre study reading was done throughout the day in order to evaluate luminance variability. The average reading was less than 50 Lux in dim environment and more than 800 Lux in bright environment. Light measurements in each environment for caries detection are presented in [Table/Fig-1].
Average reading of room lighting for each rater in dim/bright conditions.
| Room setting | Average display Lux readings |
| Dim condition | 49.2 Lux±12 |
| Bright condition | 860 Lux±70 |
Images were viewed using the same monitor in both environments, a Dell U2412M 24” (Dell Computer Co. Round Rock, TX). The monitor was calibrated manually using Society of Motion Picture and Television Engineers (SMPTE) test and TG18 Quality Control from American Association of Medical Physicists (AAMP). The raters viewed the images in a black background, they were not allowed to adjust the brightness or contrast settings with either software or hardware control.
Diagnostic Materials: Due to time constraints, only 32 extracted maxillary and mandibular posterior teeth, some with natural dental caries, was used. The teeth were mounted in quadrants in their anatomical location and secured by periphery dental wax. Three to five teeth were placed in each quadrant. XDR size no.2 CMOS digital sensor (XDR radiology Los Angeles, CA, USA) was used to capture the 12 images. The radiographs were acquired using Planmeca intraoral dental X-ray (Planmeca USA Roselle, IL, USA) at 63 kVp/8 mA/0.08 s, according to manufacturer’s exposure settings. The beam was perpendicular to crown of the teeth. Teeth were then placed parallel to the image sensor to simulate bitewing intraoral radiographs. Images were saved in an uncompressed Tagged Image File Format (TIFF). When the images were viewed for the second time, they were randomised and flipped to avoid recall bias. After image acquisition was completed, the teeth were sectioned and examined microscopically and the presence or absence of caries was recorded and used as gold standard. A microscopic study conducted by a faculty member from the Histology department at University of Texas Health Science Center at San Antonio (UTHSCSA) confirmed almost 50% of the surfaces evaluated were carious.
Data Collection: Due to time limitations to researcher and potential participants, the total number of participants were restricted to nine. Eight randomly chosen senior dental students from UTHSCSA Dental School were recruited as raters. Recruiting was based on selecting every third student in the alphabetical order.
Inclusion criteria were students who are seniors. Exclusion criteria were students with health conditions that affect visibility. A dentist with two years of clinical experience was chosen as a comparison rater. Inclusion criteria were availability for the duration of the study and a minimum of two years of clinical experience.
Viewing instructions were given to each rater regarding what to look for and how to report their confidence on proximal caries presence or absence. Raters were instructed to avoid treatment consideration. The confidence scale used was: 1) Decay is definitely present; 2) Decay is probably present; 3) Rater is unable to decide; 4) Decay is probably not present; and 5) Decay is definitely not present. Each rater viewed the images in both environments, the dim and bright light settings. Sessions were separated by approximately one week to avoid recall bias. Raters were told that the sessions were divided into two due to eye fatigue and their time contribution from clinic. Sessions were conducted during clinical hours to simulate normal clinical settings. Total number of participants remained nine when study was concluded.
Statistical Analysis
Observer ratings were analysed in several different ways. One method was to review the ratings of each observer, looking for scores of “high confidence” (a rating of 1 when caries was actually present, or a rating of 5 when caries was actually absent) vs. scores of “low confidence” (a rating of 3), and to compare how many of these occurred in the two different environments. A second, more traditional method of analysis is the ROC. An ROC curve is a graphical plot that illustrates the diagnostic ability of a binary classifier system as its discrimination threshold is varied. It is created by plotting the True Positive Rate (TPR) against the False Positive Rate (FPR) at various threshold settings. This method involved calculating sensitivity (the rate of correctly identifying teeth with a carious lesion) and specificity (the rate of correctly identifying teeth without caries), plotting a ROC curve, and calculating the Area under the Curve (AUC).
In the tables presented in this paper, a rating was deemed to agree with the actual status of caries present if it was a 1 or 2, and ratings of 3, 4, or 5 were considered to be in agreement with an actual status of caries absent.
Diagnostic performance was expressed in terms of area under ROC curve, which is a useful graphical tool for comparing raters and imaging methods. The sensitivity of a rater is plotted against the FPR (1-specificity) for each level of rating. A program code developed by Kate Nambiar, *Simple ROC plots with ggplot2 (http://www.r-bloggers.com/simple-roc-plots-with-ggplot2-part-1/, March 21, 2012)* was modified to calculate sensitivity, specificity, and FPR for each rater and lighting condition, as well as to prepare ROC curves, calculate the AUC of each, and determine confidence intervals for AUC. The confidence intervals for AUC are based on the calculation of standard error for a ROC curve, as derived by Hanley JA and McNeil BJ [20].
As a final method of analysis, Cohen’s Kappa was calculated to measure intra-rater agreement in the two environments [21]. For data analysis, the R software for statistical computing was used for all analysis calculations.
Results
Participants in the study were eight senior dental students and a dentist as mentioned above. As for the students, there were 65 potentially eligible considering the inclusion and exclusion criterions. Eight students were examined and confirmed for eligibility using a random selection method. As for the students’ demographics: 50% were males and 50% were females, 100% single, 100% less than 30-year-old and 100% US nationality. All students had a similar clinical experience; took and passed the radiographic interpretation courses (theoretical and clinical). The dentist participant in the study was chosen among 12 other potentially eligible candidates based on the inclusion criterion of availability throughout the study duration. The dentist was a male, US nationality and single. His clinical background will remain disclosed for the reasons of confidentiality.
When caries were absent, there was a high degree of confidence among the students in identifying the absence, especially under dim lighting conditions. Six of the students felt high confidence at least two-thirds of the time, e.g., a rating of 1 for at least 32 surfaces, in the dim environment, and five students had high confidence at least two-thirds of the time in the bright environment. Three students expressed high confidence at least eight times more under dim lighting than they did under bright lighting, which is a significant statistical difference. The other five students and the dentist expressed high confidence for about an equal number of times under both conditions. There was little difference in low confidence scores among all of the observers when caries were absent [Table/Fig-2].
Number of high and low confidence ratings, caries absent (n=48 surfaces).
| Confidence ratings | S01 | S02 | S03 | S04 | S05 | S06 | S07 | S08 | D | Total |
|---|
| High confidence, dim lighting | 37 | 38 | 28 | 37 | 34 | 32 | 28 | 39 | 11 | 284 |
| High confidence, bright lighting | 38 | 42 | 16* | 39 | 20* | 34 | 20* | 36 | 16 | 261* |
| Low confidence, dim lighting | 4 | 4 | 4 | 0 | 2 | 0 | 5 | 0 | 5 | 24 |
| Low confidence, bright lighting | 3 | 0 | 6 | 1 | 3 | 0 | 4 | 0 | 7 | 24 |
* Statistically significant fewer ratings compared to dim conditions, at the 0.05 significance level
When caries was present, there were fewer instances of high confidence among the raters, with only one rater (student 7) expressing high confidence for more than half the surfaces, and only in the bright environment. Student 7 is also the only one to show a difference in confidence between lighting environments. Again, there was little difference in low confidence scores in either lighting condition, but the dentist expressed low confidence more frequently than any of the students when caries was present [Table/Fig-3].
Number of high and low confidence ratings, caries present (n=42 surfaces).
| Confidence ratings | S01 | S02 | S03 | S04 | S05 | S06 | S07 | S08 | D | Total |
|---|
| High confidence, dim lighting | 16 | 9 | 17 | 14 | 14 | 14 | 14 | 16 | 4 | 118 |
| High confidence, bright lighting | 16 | 6 | 13 | 16 | 11 | 15 | 23* | 20 | 2 | 122 |
| Low confidence, dim lighting | 4 | 3 | 6 | 1 | 4 | 2 | 5 | 0 | 11 | 36 |
| Low confidence, bright lighting | 5 | 0 | 5 | 3 | 3 | 0 | 2 | 0 | 8 | 26 |
* Statistically significant more ratings compared to dim conditions, at the 0.05 significance level
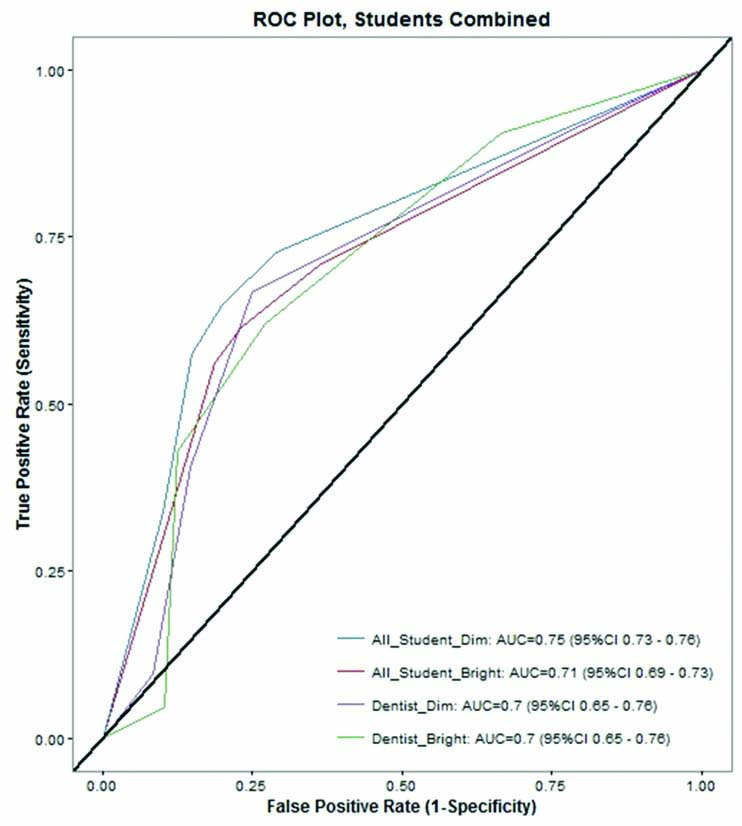
ROC analysis showed that when all students were counted together, the AUC value for performance in “dim” was 0.745, vs. the “bright” performance of 0.710, which was statistically significant (at the 0.05 level of significance). ROC analysis for the dentist’s performance was 0.703 for both “dim” and “bright” environments [Table/Fig-4].
Sensitivity was slightly higher for student performances in “dim” vs. “bright”. One student had a significantly higher sensitivity value under “dim” than “bright”: 0.429 compared to 0.262 [Table/Fig-5,6]. Another student had a statistically higher value in the “bright” vs. “dim”: 0.810 and 0.643. Yet, there were no significant differences in sensitivity values when all students were considered together. As for specificity, two students (students 7 and 8) had a significant higher value in “dim” vs. “bright”: student 7 (0.854 and 0.688) and student 8 (0.875 and 0.750). When all students were considered together, the specificity was greater for “dim”, which was statistically significant (at the 0.05 level of significance).
Results by rater, by lighting condition.
| Rater | Sensitivity1 (true positive rate) | Specificity1 (1-false positive rate) | AUC with 95% CI (Area under ROC curve) |
|---|
| Lighting | Dim | Bright | Dim | Bright | Dim | Bright |
|---|
| S01 | 0.524 | 0.452 | 0.875 | 0.854 | 0.719 (0.667-0.772) | 0.701 (0.647-0.754) |
| S02 | 0.429 | 0.262* | 0.938 | 0.938 | 0.681 (0.626-0.735) | 0.612 (0.554-0.669)* |
| S03 | 0.690 | 0.619 | 0.750 | 0.771 | 0.785 (0.738-0.832) | 0.696 (0.642-0.750)* |
| S04 | 0.500 | 0.548 | 0.854 | 0.875 | 0.726 (0.675-0.778) | 0.750 (0.700-0.800) |
| S05 | 0.643 | 0.595 | 0.813 | 0.792 | 0.749 (0.698-0.799) | 0.693 (0.639-0.747)* |
| S06 | 0.548 | 0.524 | 0.854 | 0.833 | 0.736 (0.684-0.787) | 0.750 (0.700-0.800) |
| S07 | 0.643 | 0.810* | 0.854 | .688* | 0.772 (0.723-0.820) | 0.781 (0.733-0.828) |
| S08 | 0.619 | 0.690 | 0.875 | 0.750* | 0.806 (0.761-0.851) | 0.731 (0.680-0.783)* |
| All Students Combined | 0.574 | 0.563 | 0.852 | 0.813* | 0.745 (0.727-0.763) | 0.710 (0.691-0.728)* |
| Dentist | 0.405 | 0.429 | 0.854 | 0.875 | 0.703 (0.650-0.756) | 0.703 (0.650-0.756) |
1 Sensitivity and specificity based on rating of 1 or 2 indicating presence of caries, and rating of 3, 4, or 5 indicating absence of caries.
* Value for bright conditions is statistically different than for dim conditions, for this reader, at the 0.05 level of significance
Intrarater reliability scores, using Cohen’s kappa: dim vs. bright conditions.
| Rater | Observed agreement | κ (95% XI) |
|---|
| S01 | 0.865 | 0.692 (0.514-0.870) |
| S02 | 0.892 | 0.666 (0.460-0.872) |
| S03 | 0.944 | 0.887 (0.780-0.995) |
| S04 | 0.918 | 0.812 (0.679-0.945) |
| S05 | 0.863 | 0.718 (0.563-0.873) |
| S06 | 0.909 | 0.798 (0.664-0.931) |
| S07 | 0.840 | 0.684 (0.519-0.848) |
| S08 | 0.833 | 0.658 (0.500-0.816) |
| Dentist | 0.937 | 0.854 (0.715-0.992) |
Each rater was compared across both environments, with a score of 1 or 2 under “dim” agreeing with a score of 1 or 2 under bright conditions, or similarly a score of 4 or 5 under dim conditions agreeing with a score of 4 or 5 under “bright”. A score of 3 under either environment, caused that tooth surface, to be ignored. Calculation of confidence intervals for Kappa were done as described by Charles Zaiontz on blog, http://www.real-statistics.com/reliability/cohens-kappa/.
Kappa values are presented in [Table/Fig-5]. Based on Landis & Koch, Biometrics 1977 classification, a Kappa score of 0.61 to 0.80 can be interpreted as “substantial agreement” (which was achieved by six students), and a Kappa score of 0.81 or higher can be interpreted as “almost perfect agreement” (two students and the dentist).
Discussion
Carious lesions vary in depth from incipient to cavitated. Not every caries is radiographically detectible. Lesions confined to enamel are not evident radiographically until approximately 30% to 40% demineralisation has occurred [22]. This explains the overall low sensitivity scores in caries detection, which is similar to previous studies [11,23]. In the present study caries depth ranged from shallow enamel to deep dentinal. The purpose of this study was to determine whether there is a difference in caries detection between dim and bright environment. The mean student results yielded slightly higher sensitivity in dim environment compared to bright (0.574, 0.563), but it was not statistically significant.
In the present study, when histology confirmed absence of caries, the raters’ mean score reported a high degree of confidence in ruling out caries in dim light conditions, which was statistically significant in students’ performance (at 0.05 significant level).
Hellén-Halme K et al., study supported present findings; the detection of detail caries is easier in dim light conditions than in bright conditions [13]. However, when display monitors are adjusted to optimal brightness, there was no effect of lightning conditions on enamel caries detection.
As per the guidelines for illuminance levels in radiographic interpretation clinics, the dim light in our study was set to (>50 Lux) [6,7]. In studies the illuminance level was between 25 and 40 lux [24,25]. The two studies confirmed that specific adjustment to displaying monitors can improve the presentation of dental radiographic dental images.
A previous study found that there was no difference between ambient light levels in the ability to detect carious lesions in digital radiographs if the monitor is calibrated in accordance with the surrounding light level [9]. In that study, the AUC for the raters’ performance were 0.723 and 0.732 in dim versus bright environment. In our study, students’ performance was 0.745 and 0.710 in dim versus bright environment.
Kutcher MJ et al., studied raters including dental students [19]. This study had higher specificity than present study, but found no significant difference in specificity in low and high ambient light (1.00, 0.98). In the present study, students had significantly higher specificity in the dim environment compared to the bright environment (0.852, 0.813). To clarify, students were better able to diagnose absence of the disease in a dim environment. Kutcher MJ et al., reported mean AUC in dental students’ performance in “bright” was higher than in “dim” (0.79 and 0.85) [19]. This differed from our results, as mean AUC for students’ performance was 0.745 in “dim” and 0.710 in the “bright”. Again, these results were statistically significant (at 0.05 level of significance). Kutcher MJ et al., environment was 10 and 940 Lux, and the monitors used were laptop screens. In our study, “dim” were averaged 50 Lux and “bright” were averaged 860 Lux and we used calibrated desktop monitors.
Monitors used in present study were manually calibrated using TG18 quality control from the AAMP similar to previous studies [10]. Often, practicing dentists are not aware of these factors and the ability to adjust the contrast and brightness in their monitors that are set most of the times to default settings. This makes it harder to evaluate lower contrast images under bright ambient light conditions. However, the Digital Imaging and Communication in Medicine standard (DICOM)-calibrated consumer grade display was found suitable for detecting anatomical structures and pathology in panoramic radiographs under ambient light conditions (510 Lux) [26].
Many studies have covered the same idea of ambient light conditions and its effect on interpretation and diagnostic accuracy. Present study is unique because it is the most recent in the field, it combines all the recent studies supporting and opposing the hypothesis, alongside providing significant statistical findings in comparison between inexperienced raters and an experienced one.
Limitation
One limitation of the study was that anatomic but dry phantom was used for caries detection. That might affect the usefulness of an intraoral radiographic image. Another limitation was the difficulty of adjusting the room Lux on day to day basis due to different weather conditions.
The findings of the study can be implied in future studies with relation to factors affecting radiographical readings. The statistical results can set the basic stone to an in depth investigation of students’ learning curve, speed and quality in radiographic interpretations. Finally, the methods used to determine cavity existence in different light conditions can be further applied to examine and evaluate lesions, odontogenic pathologies and cone beam CT scans.
Conclusion
The results of present study support reducing ambient light for ruling out caries, as there is significantly higher specificity in dim settings compared to bright settings. Diagnostic efficacy measured by ROC demonstrates significant improvement in students’ performance when dim light settings are in place. Therefore, in order to rule out caries, it is advisable to view images in dim conditions.
Study recommendations: a) monitor calibration every 3 to 6 months; b) dental staff and faculty awareness of the ambient light effect when interpreting dental radiographs; and c) dental students must adhere to the American Association of Physicists in Medicine and the American College of Radiology Standards for lightning conditions, as this will enhance their radiographs interpretation abilities.
* Statistically significant fewer ratings compared to dim conditions, at the 0.05 significance level
* Statistically significant more ratings compared to dim conditions, at the 0.05 significance level
1 Sensitivity and specificity based on rating of 1 or 2 indicating presence of caries, and rating of 3, 4, or 5 indicating absence of caries.
* Value for bright conditions is statistically different than for dim conditions, for this reader, at the 0.05 level of significance