Evaluation of the Role of HBA1c in Chronic Kidney Disease
Kommineni Sai Subramanyam1, Siddharth Gosavi2, Divya Tenneti3, Roopa Murgod4
1 Medical Intern, Department of Biochemistry, Vydehi Institute of Medical Sciences and Research Centre, Bangalore, Karnataka, India.
2 Medical Graduate, Department of Biochemistry, Vydehi Institute of Medical Sciences and Research Centre, Bangalore, Karnataka, India.
3 Medical Intern, Department of Biochemistry, Vydehi Institute of Medical Sciences and Research Centre, Bangalore, Karnataka, India.
4 Professor, Department of Biochemistry, Vydehi Institute of Medical Sciences and Research Centre, Bangalore, Karnataka, India.
NAME, ADDRESS, E-MAIL ID OF THE CORRESPONDING AUTHOR: Dr. Kommineni Sai Subramanyam, #401, Sai Leela Apartments, Sai Colony, Belathur, Bangalore, Karnataka, India.
E-mail: saiptp999@gmail.com
Introduction
Chronic Kidney Disease (CKD) refers to a group of heterogeneous disorders that results in gradual loss of structure and function of the kidneys.
Aim
To evaluate the role of glycated haemoglobin (HBA1c) due to type II diabetes mellitus by correlating glycated haemoglobin with estimated Glomerular Filtration Rate (GFR) and serum creatinine parameters.
Materials and Methods
This study was conducted over a period of one year during which 60 patients with CKD were enrolled for the study. Sixty age and sex matched controls were also enrolled. The diagnosis of CKD was done based on estimated Glomerular Filtration Rate (eGFR) calculation after obtaining history/clinico-pathological information. Blood samples were analysed for the following parameters: fasting blood sugar, HBA1c, blood urea, serum creatinine, serum albumin and electrolytes. The eGFR was calculated by using Modification of Diet in Renal Disease equation. Statistical analysis was done by using SPSS software.
Results
On comparison, the values of fasting blood sugar, HBA1c, blood urea, serum creatinine and serum potassium levels were significantly higher in CKD cases than in controls (p< 0.001). The values of haemoglobin and serum albumin were found to be significantly lower in the cases than the control group (p< 0.001). Among the CKD cases, correlation studies were done. HBA1c values negatively correlated with eGFR and positively correlated with serum creatinine values. The CKD cases were subdivided based on their stage (stage 3, 4 and 5) and compared with each other. A statistically significant difference (p < 0.001) between median values of HBA1c, eGFR and serum creatinine was observed among the three groups of stage 3, 4 and 5.
Conclusion
As the results show, greater glycaemic control is emulated by lower HBA1c levels which in turn are directly related to severity of the renal disease as indicated by the falling eGFR and rising serum creatinine values. These findings suggest that proper and timely control of HbA1c level in patients with chronic renal disease with diabetic aetiology is of utmost importance for staging and prognosis of the disease.
Estimated glomerular filtration rate (eGFR), Glycosylated haemoglobin (HbA1c), Modification of diet in renal disease (MDRD)
Introduction
CKD refers to a group of heterogeneous disorders that results in gradual loss of structure and function of the kidneys. CKD is defined as either kidney damage or decreased kidney function (decreased GFR) for 3 or more months. The disease can be staged based on the proteinuria, and histopathological studies, but the most common parameter used for staging is GFR [Table/Fig-1] [1].
| Stage | Description | GFR mL/min/1.73 m2 |
|---|
| 1 | Renal damage with Normal /High GFR | >90 |
| 2 | Mild CKD | 60-89 |
| 3 | Moderate CKD | 30-59 |
| 4 | Severe CKD | 15-29 |
| 5 | End stage renal disease | <15 |
Patients with GFR <60 mL/min/1.73 m2 for 3 months are diagnosed with CKD, irrespective of the presence or absence of kidney damage [1].
The two most important causes of CKD are long-standing diabetes mellitus and hypertension. The less common causes may vary from glomerulonephritis, interstitial nephritis to polycystic kidneys, pyelonephritis, obstruction along the urinary tract (renal stones, enlargement of the prostate, etc.,), and heavy metal poisoning (e.g., lead). CKD is evaluated by various laboratory tests including routine renal function tests, complete urine analysis, serum electrolytes, blood sugars, complete blood count, estimation of GFR and basic metabolic panels. A lipid profile can be done to look for cardiovascular risk factors. Cystatin-C, iPTH (intact Parathyroid Hormone), alkaline phosphatase, vitamin D and phosphate levels in serum may be done to assess bone involvement. The patient will need to be evaluated for anaemia [1].
However, the most common cause of CKD worldwide being diabetes mellitus [2], it is extremely important to evaluate the long-term effects of the disease on the kidneys.
Glycated haemoglobin (HbA1c) is formed by a non-enzymatic, irreversible process of addition of glucose to haemoglobin. The glycated haemoglobin stays in the RBCs throughout the lifespan of RBCs, and represents average glycaemia over the last 12-16 weeks [3]. The International Diabetes Federation recommends HbA1c values below 6.5%, whereas the American Diabetes Association recommends that the HbA1c to be below 7.0% for most patients [4].
The aim of this study was to evaluate the role of HbA1c in CKD due to type II diabetes mellitus by: a) comparing the biochemical parameters in CKD cases with controls; b) correlating HbA1c with eGFR and serum creatinine values; c) Stagewise comparison of the HbA1c, eGFR and serum creatinine in CKD cases.
Materials and Methods
This retrospective case-control study was conducted over a period of one year lasting from September 2016 to the September of 2017, during which 60 patients with CKD were enrolled for the study. Sixty age and sex matched healthy controls were retrospectively enrolled and compared. Institutional Ethics Committee clearance was obtained. Written consent was obtained from the subjects involved in the study. The diagnosis of CKD was done based on eGFR calculation after obtaining history/clinico-pathological information.
Inclusion criteria: Patients aged >45 years with h/o diabetes mellitus (minimum of 6 years duration), CKD, with eGFR<60ml/min/1.73m2 were included for the study.
Exclusion criteria: Patients with h/o hypertension, cardiovascular diseases, recent blood transfusion, having undergone renal transplant surgery/immunosuppressant therapy, and h/o malignancies were excluded.
Blood samples were collected from patients coming to OPD as well as inpatients/dialysis units on day 1/day 2 of admission. Samples were centrifuged immediately and analysed for the following parameters: Fasting Blood Sugar (FBS), Blood Urea (BU), Serum Creatinine (SC), Serum Albumin (Alb) and electrolytes (Na, K, Cl). These parameters were measured using Beckman Coulter Autoanalyser. FBS was measured by glucose oxidase-peroxidase method [5], BU by urease method [6], SC by modified Jaffe’s method [7], albumin by bromocresol green dye binding method [8] and electrolytes were measured by ion selective electrodes [9].
Haemoglobin (Hb) and glycated haemoglobin (HbA1c) were measured in plasma samples. Hb was measured by the recommended ICSH method [10] and HbA1c was measured by high performance liquid chromatography [11].
eGFR (estimated GFR) calculated by the abbreviated MDRD equation as follows: eGFR = 186 x (Creatinine/88.4)-1.154 x (Age)-0.203 x (0.742 if female) x (1.210 if black).
The calculation of eGFR was done and all the results were tabulated in an Excel sheet. Statistical analysis (Mann-Whitney U test, Spearmann’s Correlation test, Scatter Plot analysis and Kruskal Wallis tests were done) was done by using the Statistical Package for the Social Sciences (SPSS) software version 21.
Results
[Table/Fig-2,3] show the gender distribution among the cases and controls respectively. [Table/Fig-4] shows that out of the 60 patients recruited, 37 patients had stage 3 CKD, 15 had stage 4 CKD and 8 had stage 5 CKD. All the analytes measured in CKD patients were compared with the controls and the results are shown in [Table/Fig-5]. The values of FBS, HbA1c, BU, SC and serum potassium levels were significantly higher in cases than in controls (p< 0.001). The values of haemoglobin and serum albumin in the patients were found to be lower than the control group (p< 0.001). Serum sodium and chloride values did not change significantly in the cases.
Table shows gender distribution in cases.
Table shows gender distribution in controls.
Table showing stage-wise distribution of CKD cases (n=60).
| CKD stage 3 | 37 |
| CKD stage 4 | 15 |
| CKD stage 5 | 8 |
Comparsion of analytes between controls and cases.
| Variables | CONTROLS | CASES | p-value |
|---|
| Median | IQR | median | IQR |
|---|
| FBS (mg/dl) | 87.5 | 17.5 | 162.5 | 71.5 | <0.001 |
| HbA1c | 5.1 | 0.68 | 6.86 | 0.81 | <0.001 |
| Hb (g/dl) | 12.8 | 1.3 | 11.1 | 1.2 | <0.001 |
| Albumin* (g/dl) | 4.0 (mean) | 0.45 (SD) | 2.8 (mean) | 0.48 (SD) | <0.001 |
| Blood Urea (mg/dl) | 21.0 | 12.0 | 91.0 | 45.5 | <0.001 |
| S. Creatinine (mg/dl) | 0.7 | 0.4 | 3.6 | 3.5 | <0.001 |
| Serum Na (mEq/L) | 132.6 | 3.0 | 134 | 9.9 | 0.124 |
| Serum K (mEq/L) | 3.5 | 0.2 | 5.4 | 0.88 | <0.001 |
| Serum Cl (mEq/L) | 99.5 | 5.0 | 100.0 | 15.8 | 0.576 |
*Mann-Whitney U test done for all parameters except Albumin. For albumin, mean, SD were calculated, Levene’s test were done
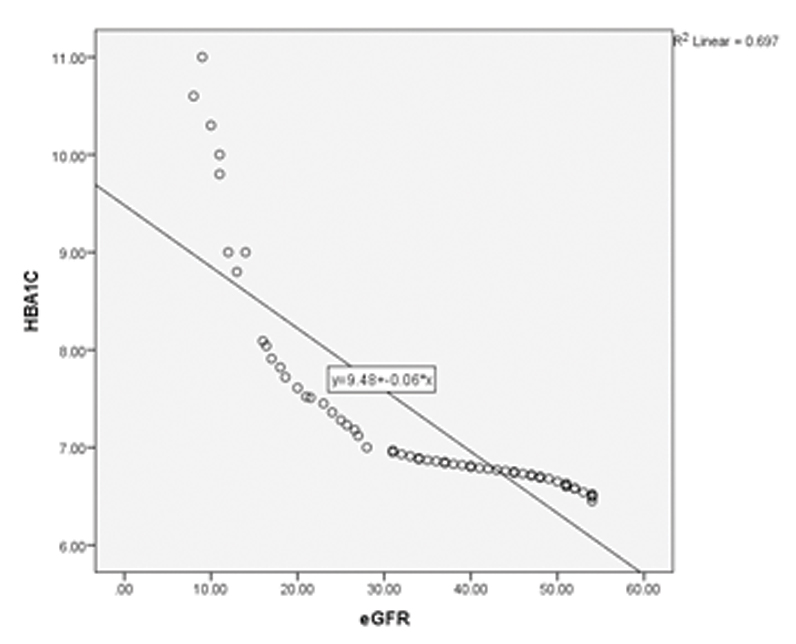
Correlation studies were done between HbA1c, eGFR and serum creatinine in the cases and it was noted that eGFR decreased with increasing HbA1c (significant negative correlation, [Table/Fig-6,7]. It was also noted that serum creatinine increased with increasing HbA1c [Table/Fig-6,8].
Spearmann’s correlation values.
| Correlation between | CorrelationCoefficient (r value) | p-value(significance) | Coefficient of determination (R2 value) |
|---|
| HbA1c v/s eGFR | --1.0 | <0.001 | 0.697 |
| HbA1c v/s serum creatinine | + 0.99 | <0.001 | 0.903 |
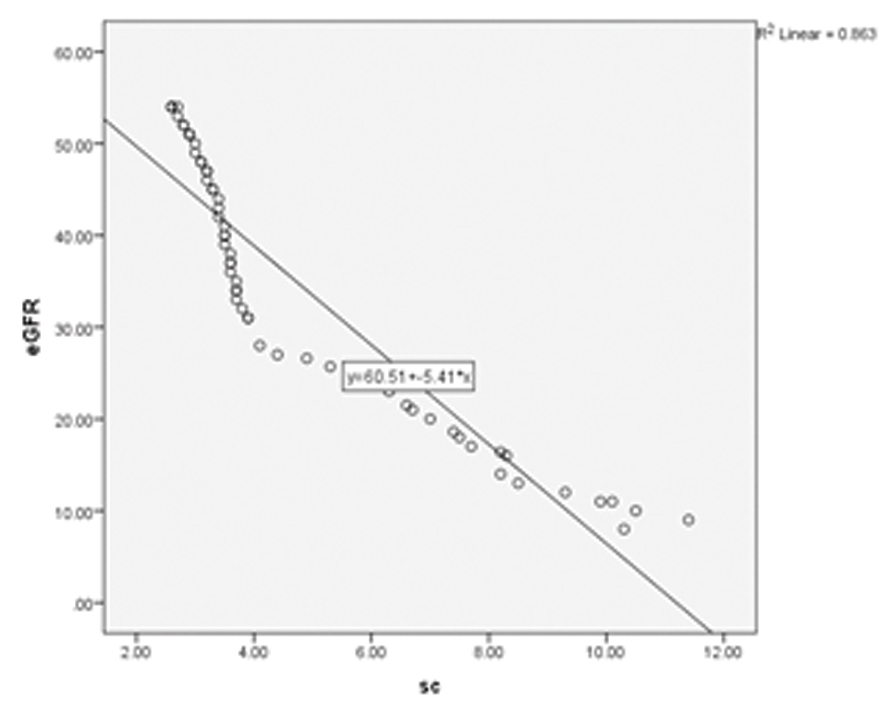
| eGFR v/s serum Creatinine | -- 0.99 | <0.001 | 0.863 |
Scatter plot showing HbA1c v/s eGFR; a negative correlation can be seen.
Scatter plot showing HbA1c v/s Serum Creatinine (SC); a positive correlation can be seen.
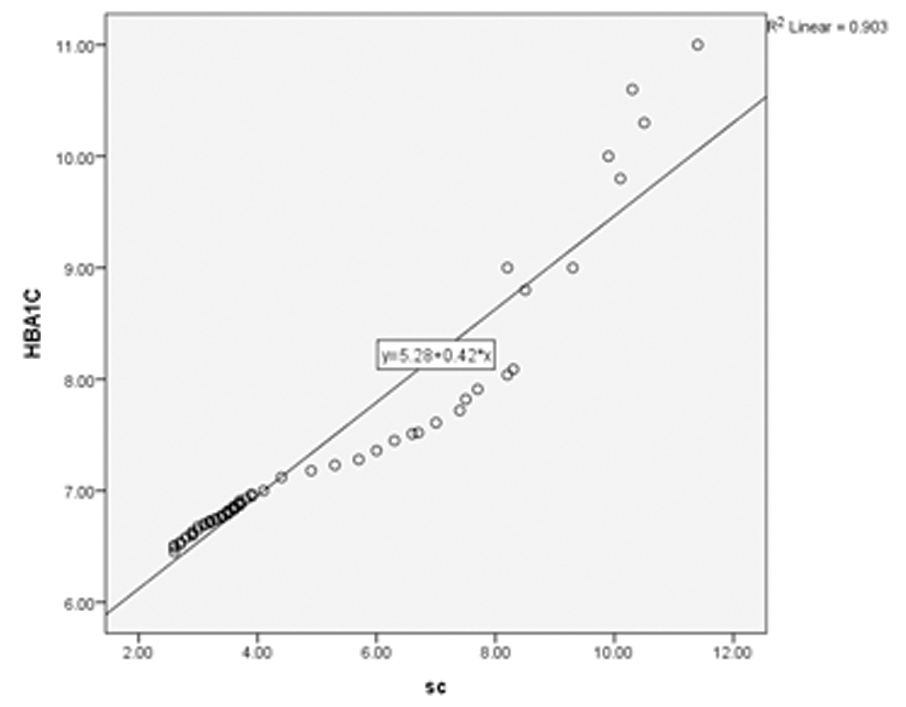
Scatter plot analysis showed a highest R2 of 0.9 when HbA1c was correlated with serum creatinine [Table/Fig-8]. [Table/Fig-7,9] show the scatter plot analyses of HbA1c v/s eGFR and eGFR v/s serum creatinine respectively.
Scatter plot showing eGFR v/s SC; a negative correlation can be seen.
All the cases of CKD were staged into three subgroups based on eGFR as shown in [Table/Fig-4]. HbA1c, eGFR and serum creatinine in these three subgroups were compared collectively by Kruskal Wallis test and the results are as shown in [Table/Fig-10,11 and 12] respectively. There was a statistically significant difference (p < 0.001) between median values of HbA1c, eGFR and serum creatinine among the three groups studied viz., CKD stage 3, 4 and 5.
Table showing comparison of HbA1c between the three subgroups of CKD.
| CKD Stage 3 | CKD Stage 4 | CKD Stage 5 | p-value |
|---|
| Median | 6.76 | 7.51 | 9.9 | <0.001 |
| Inter quartile range (IQR) | 0.22 | 0.59 | 2.08 | <0.001 |
Table showing comparison of eGFR between the three subgroups of CKD.
| CKD Stage 3 | CKD Stage 4 | CKD Stage 5 | p-value |
|---|
| Median | 44 | 21.5 | 11 | <0.001 |
| Inter quartile range (IQR) | 14 | 7.7 | 2.8 | <0.001 |
Table showing comparison of serum creatinine between the three subgroups of CKD.
| CKD Stage 3 | CKD Stage 4 | CKD Stage 5 | p-value |
|---|
| Median | 3.4 | 6.6 | 10 | <0.001 |
| Inter quartile range (IQR) | 0.7 | 2.2 | 1.8 | <0.001 |
p<0.001=highly significant
Discussion
CKD is a result of microvascular complications of diabetes mellitus. Under hyperglycaemic conditions, mitochondria produce excess Reactive Oxygen Species (ROS) which damage the tissues such as kidneys. Prolonged hyperglycaemia results in structural abnormalities and progression of the disease to CKD [12].
Brownlee has explained the pathophysiology very well. According to him, hyperglycaemia activates glycolysis pathway, which in turn activates the polyol pathway, hexosamine pathway, also increases the production of AGEs (advanced glycated end products), and activates protein kinase C [13]. These metabolic changes in hyperglycaemia play a major role in the development of CKD. Studies have shown that strict glycaemic control (<7%) can delay the progress of the disease and also reduce the development of complications [14].
The significance of measuring HbA1c in CKD lies in the fact that not only glycaemic control can be assessed, but the progression of the disease can be monitored and controlled. Moreover, the outcomes can be predicted, especially if the aetiology is diabetes mellitus. Some studies have shown that even when fasting blood glucose was normal and HbA1c was altered (>5.7% but <6.5%), eGFR was reduced, indicating the need for early prevention of CKD by use of HbA1c [15].
The present study showed that HbA1c values increased with decreasing eGFR, indicating that poor glycaemic control correlated with increasing incidence of renal damage. This is supported by the statistics which also reveal HbA1c levels increasing with increasing serum creatinine levels. The present study is also one of the first few studies to compare the important biochemical parameters between different stages of CKD. HbA1c, eGFR and serum creatinine are compared in stages 3, 4 and 5 of CKD.
In a study done by Kundu SK et al., found that there was a negative correlation between HbA1c and eGFR and a positive correlation between HbA1c and serum creatinine [16].
A retrospective cohort study done by Lee CL et al., involving 1992 subjects showed that higher the baseline HbA1c, greater was the decline in eGFR annually [17]. In fact, high baseline value of HbA1c was found to be a predictor of GFR decline in subjects with diabetes mellitus in a recent study done by Yokoyama H et al., [18].
These results are in agreement with our study. Some studies have shown contrasting reports. Agarwal et al., in a study correlated HbA1c with GFR in three different groups namely; recently diagnosed DM, DM of <1 year duration and 1-2 years duration and found a significant positive correlation between the two only in diabetics of <1 year duration [19].
Limitation
There were limitations in the present study in view of the fact that this was a retrospective study, where outcomes could not be measured. Also, HbA1c was measured on day 1/day 2 of admission. No mean value could be obtained since it was a retrospective study. Serial blood glucose measurements could not be done for the same reason.
Conclusion
The present study shows that HbA1c correlates negatively with eGFR and positively with serum creatinine. It has also been shown that among the CKD cases, the median value of HbA1c in each subgroup increases with the severity of the disease (staging of the disease). This highlights the significance of proper and timely measurement and control of HbA1c at regular intervals in CKD patients of diabetic aetiology for their staging and clinical assessment.
*Mann-Whitney U test done for all parameters except Albumin. For albumin, mean, SD were calculated, Levene’s test were done
p<0.001=highly significant
[1]. National Kidney FoundationK/DOQI clinical practice guidelines for chronic kidney disease: evaluation, classification, and stratification. Kidney Disease Outcome Quality InitiativeAm J Kidney Dis 2002 39(2 Suppl 1):S1-266. [Google Scholar]
[2]. Jha V, Garcia-Garcia G, Iseki K, Li Z, Naicker S, Plattner B, Chronic kidney disease: global dimension and perspectivesThe Lancet 2013 382:260-62.10.1016/S0140-6736(13)60687-X [Google Scholar] [CrossRef]
[3]. Goldstein DE, Little RR, Wiedmeyer HM, England JD, McKenzie EM, Glycated hemoglobin: methodologies and clinical applicationsClin Chem 1986 32:64-70. [Google Scholar]
[4]. "Executive Summary: Standards of medical care in diabetes—2009"Diabetes Care 2009 32:S6-S12.10.2337/dc09-S00619118288 [Google Scholar] [CrossRef] [PubMed]
[5]. Trinder P, Determination of blood glucose using an oxidase-peroxidase system with a non-carcinogenic chromogenJ Clin Pathol 1969 22(2):158-61.10.1136/jcp.22.2.1585776547 [Google Scholar] [CrossRef] [PubMed]
[6]. Chaney AL, Marbach EP, Modified reagents for determination of urea and ammoniaClin Chem 1962 8(2):130-32.10.1093/clinchem/8.2.130 [Google Scholar] [CrossRef]
[7]. Bonsnes RM, Taussky HM, The colorimetric determination of creatinine by the Jaffe’s ReactionJ Biol Chem 1945 158:581-91. [Google Scholar]
[8]. Doumas BT, Peters T Jr, Serum and Urine Albumin: a progress report on their measurement and clinical significanceClin Chim Acta 1997 258:3-20.10.1016/S0009-8981(96)06446-7 [Google Scholar] [CrossRef]
[9]. Kulpmann WR, Reference Methods for the Determination of Sodium, Potassium, pH and Blood Gases with -Selective ElectrodesEur J Clin Chem Clin Biochem 1991 29:263-67.10.1515/cclm.1991.29.4.2631868132 [Google Scholar] [CrossRef] [PubMed]
[10]. International Committee for Standardization in Haematology. Recommendations for reference method for haemoglobinometry in human blood (ICSH Standard EP 6/2: 1977) and specifications for international haemiglobincyanide reference preparation (ICSH Standard EP 6/3: 1977)J Clin Path 1978 31(2):139-43.10.1136/jcp.31.2.139632358 [Google Scholar] [CrossRef] [PubMed]
[11]. Jeppsson JO, Kobold U, Barr J, Finke A, Hoelzel W, Hoshino T, Approved IFCC reference method for the measurement of HbA1c in human bloodClin Chem Lab Med 2002 40(1):78-89.10.1515/CCLM.2002.01611916276 [Google Scholar] [CrossRef] [PubMed]
[12]. Badal SS, Danesh FR, New insights into molecular mechanisms of diabetic kidney diseaseAm J Kidney Dis 2014 63(2):S63-S83.10.1053/j.ajkd.2013.10.04724461730 [Google Scholar] [CrossRef] [PubMed]
[13]. Brownlee M, Biochemistry and molecular cell biology of diabetic complicationsNature 2001 414(6865):813-20.10.1038/414813a11742414 [Google Scholar] [CrossRef] [PubMed]
[14]. Molitch ME, Adler AI, Flyvbjerg A, Nelson RG, So WY, Wanner C, Diabetic kidney disease: a clinical update from Kidney Disease: Improving Global OutcomesKidney Int 2015 87(1):20-30.10.1038/ki.2014.12824786708 [Google Scholar] [CrossRef] [PubMed]
[15]. Miranda VA, Rosa ML, Lugon JR, Filho RAC, Oliveira TS, Silva AN, Correlation between MCP-1, HbA1c and glomerular filtration in nondiabetic patientsArq Bras Endocrinol Metabol 2013 57(5):381-87.10.1590/S0004-2730201300050000823896805 [Google Scholar] [CrossRef] [PubMed]
[16]. Kundu SK, Biswas IB, Roy N, Basu N, Correlation of HbA1c with urinary ACR, eGFR and serum creatinine in type 2 diabetes mellitusJ Evolution Med Dent Sci 2017 6(29):2353-57.Available from: https://jemds.com/data_pdf/sandip%20kumar%20kundu.pdf10.14260/Jemds/2017/507 [Google Scholar] [CrossRef]
[17]. Lee CL, Li TC, Lin SY, Wang JS, Lee IT, Tseng LN, Dynamic and dual effects of glycated hemoglobin on estimated glomerular filtration rate in type 2 diabetic outpatientsAm J Nephrol 2013 38(1):19-26.10.1159/00035180323817017 [Google Scholar] [CrossRef] [PubMed]
[18]. Yokoyama H, Kanno S, Takahashi S, Yamada D, Itoh H, Saito K, Determinants of decline in glomerular filtration rate in nonproteinuric subjects with or without diabetes and hypertensionClin J Am Soc Nephrol 2009 4:1432-40.10.2215/CJN.0651120819713288 [Google Scholar] [CrossRef] [PubMed]
[19]. Agarwal AK, Singla S, Garg U, Yadav R, Miglani S, Jain AK, Glomerular filtration rate and total kidney volume in cases of recent onset type-2 diabetes mellitusJ Indian Assoc Clin Med 2005 6(4):285-90. [Google Scholar]