Seasonal flu is an acute viral infection caused by an influenza virus. Influenza virus results in severe threat to public health around the world, affecting yearly approximately 5-10% of adults and 20-30% of children [1]. Annual influenza epidemics are estimated to result in severe diseases in about 3 to 5 million cases and about 0.25-0.5 million deaths worldwide [1-4]. The clinical manifestations of Influenza A infection range from a relatively mild and self-limiting respiratory infection to a severe illness with significant morbidity and mortality. Biomarkers are needed besides co-morbidities, physical examination, vital findings and chest X-ray, in assessment of patients’ severity. There exists no specific single laboratory test that may be used as a potential indicator to determine high risk patients with complicated clinical course [5].
Several biochemical markers are associated with the severity of influenza infection or bacterial co-infection including cytokines such as interleukin-6 (IL-6), CRP, procalcitonin, CK and albumin [6-9]. CRP, which is synthesised as a response to especially IL-6, IL-1 and TNF-α from liver, is used for infection diagnosis, and assessing prognosis and response to treatment [10]. It is easily applicable, repeatable and cheap biomarker thought to be beneficial in determining prognosis besides clinical findings.
The objective of this study was to find the association of biochemical markers such as CRP, CK, lymphocyte and leucocyte counts with disease severity and to determine a cut-off level for these biochemical markers to predict mortality and know which patients would require ICU admission in adults with Influenza A infection.
Materials and Methods
This retrospective cross-sectional study was approved by the local ethics committee. This study was performed in three tertiary care hospitals in Turkey. Data were collected for all consecutive patients who were above 18-years of age and admitted to hospital between December 1, 2015 and March 31, 2016; who fulfilled criteria for confirmed influenza (H1N1 and H3N2) infection by the United States Center for Diseases Control and Prevention (CDC). These criteria included clinical findings such as fever, muscle pain, fatigue, coughing, sore throat, running nose and a real-time Reverse Transcriptase Polymerase Chain Reaction Assay (RT-PCR) positive for H1N1 or H3N2 virus in nasopharyngeal swab samples [11]. Nasopharyngeal swab samples were evaluated in the national reference laboratories which have been determined by the national influenza surveillance, via departments of Turkish Public Health Institution. Results reported from the laboratories to the hospitals were retrospectively assessed and recorded.
Data Collection and Study Design
Patients’ records were obtained retrospectively through patient monitoring systems and reviewed for demographics, co-morbidities (obesity, diabetes mellitus, Chronic Obstructive Pulmonary Disease (COPD), Coronary Artery Disease (CAD) and malignancy), pregnancy, vital signs, physical signs, radiological and laboratory findings at hospital admission (in all patients within 24 hours of admission), culture results (blood or respiratory samples culture), admission to Intensive Care Units (ICUs), need for vasopressor supports and mechanical ventilation, antiviral treatments, starting dates of antiviral treatment, and death were recorded. The main outcome measures were whether the patient was admitted to the ICU or his death.
Statistical Analysis
Descriptive statistics were presented as frequency, percentage (%) and continuous variables were summarised as the median and interquartile range (IQR). The normality of distribution of continuous variables was tested by Shapiro-Wilk test. Mann-Whitney U test was used for comparison of two independent groups of variables with non-normal distribution and Chi-square and Fisher-exact tests were used to assess difference between categorical variables.
The ROC curve analysis was performed to indicate the predictive value of CRP, CK, Polymorphonuclear Leukocyte (PMNL) and lymphocyte counts in terms of mortality and intensive care admission. The cut-off point was determined and sensitivity, specificity, Positive and Negative Predictive Value (PPV, NPV) and Confidence Intervals (CI) of the cut-off points were calculated. Youden Index (J=Sensitivity+Specificity–1) was used for the determination of the cut-off point. The Cox regression model was applied to indicate risk factors for mortality. Data such as age, time between the onset of symptoms and antiviral administration, low oxygen saturation, hypotension, tachycardia, CAD, CRP, CK. PMNL and lymphocyte percentage were included in the Cox regression model (Model: forward: LR. Entry: 0.05 and Removal: 0.10) Primary outcomes of mortality were evaluated on a time-to-event basis by Kaplan-Meier analysis with the use of the log-rank statistics to test for determining differences in the rates of the end points according to serum CRP levels and antiviral administration.
Data was recorded via the software SPSS-15 package program and the analysis was also performed using the same program (SPSS Inc.; Chicago. USA). The statistical significance level was considered as p<0.05.
Power analysis was conducted and found that sample has 91.4% power in terms of mortality and 92.7% power in terms of ICU admission (Alpha accepted as 0.05).
Results
A total of 155 patients diagnosed with Influenza A (H1N1 n=100, 64.5% and H3N2 n=55, 35.5%) were evaluated during the study. Patients’ mean age was 49.6±19.6 (IQR: 33-65). There were 109 (70.3%) females and 46 (29.7%) males.
The most common co-morbid conditions were COPD (n=49, 31.6%), diabetes mellitus (DM) (n=39, 25.2%), CAD (n=38, 24.5%) and pregnancy (n=14, 9.0%). The most common symptoms, vital and physical signs, at hospital admission were cough (n=154, 99.4%), fever (n=139, 89.7%), sore throat (n=119, 76.8%), fatigue and myalgia (n=118, 76.1%), tachycardia (>100/min) (n=95, 61.3%), hypotension {Systolic Blood Pressure (SBP) <90 mm/hg} (n=25, 16.1%), low oxygen saturation (SO2< 90%) (n=81, 52.3%). Lung auscultation findings were seen in 107 (69.0%) patients and pneumonic infiltration was detected on chest X-ray in 96 (61.9 %) patients.
Distribution of some variables for mortality and ICU support need are given in [Table/Fig-1,2].
Comparison of some variables between ICU and non-ICU patients.
| Variables | ICU (n=28) | Non-ICU (n=127) | p-value |
|---|
| Age, median (IQR) | 58.5 (43.5-77.5) | 44 (31-64) | 0.018† |
| Gender, n (%) | Male | 4 (14.3) | 42 (33.1) | 0.037§ |
| Female | 24 (85.7) | 85 (66.9) |
| Influenza A, n (%) | H1N1 | 20 (71.4) | 80 (63.0) | 0.398§ |
| H3N2 | 8 (28.6) | 47 (37.0) |
| Pregnancy, n (%) | 2 (7.1) | 12 (9.4) | 0.692‡ |
| COPD, n (%) | 12 (42.9) | 37 (29.1) | 0.157§ |
| Diabetes mellitus, n (%) | 8 (28.6) | 31 (24,4) | 0.646§ |
| CAD, n (%) | 13 (46.4) | 25 (19.7) | 0.006§ |
| High fever (>38,3°), n (%) | 23 (82,1) | 116 (91,3) | 0,175§ |
| Low saturation (≤90%), n (%) | 28 (100) | 53 (41,7) | <0.001§ |
| Tachycardia (>100 beats/min), n (%) | 28 (100) | 67 (52.8) | <0.001§ |
| Hypotension (sys BP <90 mmHg), n (%) | 16 (57.1) | 9 (7.1) | <0.001‡ |
| Pneumonia on chest X-ray, n (%) | 25 (89.3) | 71 (55.9) | <0.001‡ |
| Coexisting Bacterial Pneumonia, n (%) | 7 (25.0) | 3 (2.4) | <0.001‡ |
| Interval from onset of illness to initiation of antiviral therapy, median (IQR)* | 4 (3-5) | 2 (1-3) | <0.001† |
| WBC (×103/ml3), median (IQR) | 11400 (5300-16000) | 6600 (4800-8600) | 0,005† |
| % PNML, median (IQR) | 82.1 (75.3-90.0) | 71.0 (58.0-80.0) | <0.001† |
| % LYM, median (IQR) | 10.1 (4.9-15.2) | 17.4 (12.0-29.6) | <0.001† |
| CRP (mg/L), median (IQR) | 146 (9.6-70.0) | 22.2 (8.0-32.0) | <0.001† |
| CK (U/L), median (IQR) | 450 (135-1190) | 81 (48-148) | <0.001† |
| ALT (IU/L) (IQR) | 32 (14.2-66.0) | 19 (15-32) | 0.035† |
| Creatine (mg/dL) (IQR) | 1.10 (0.78-2.22) | 0.77 (0.68-0.97) | 0.006† |
*A total of 146 patients received antiviral therapy. †Mann-Whitney U test ‡Fisher’s-exact test §Chi-square test.
IQR: Interquartile range; COPD: Chronic obstructive pulmonary disease; CAD: Coronary artery disease; Sys BP: Systolic blood pressure; WBC: White blood cells; PMNL: Polymorphonuclears; Lym: Lymphocytes; CK: Creatine kinase; ALT: Alanine aminotransferase; CRP: C-Reactive protein
Comparison of some variables due to the mortality.
| Variables | ICU (n=28) | Non-ICU (n=127) | p-value |
|---|
| Age, median (IQR) | 58.5 (43.5-77.5) | 44 (31-64) | 0.018† |
| Gender, n (%) | Male | 4 (14.3) | 42 (33.1) | 0,037§ |
| Female | 24 (85.7) | 85 (66.9) |
| Influenza A, n (%) | H1N1 | 20 (71.4) | 80 (63.0) | 0,398§ |
| H3N2 | 8 (28.6) | 47 (37.0) |
| Pregnancy, n (%) | 2 (7.1) | 12 (9.4) | 0,692‡ |
| COPD, n (%) | 12 (42.9) | 37 (29.1) | 0,157§ |
| Diabetes mellitus, n (%) | 8 (28.6) | 31 (24,4) | 0,646§ |
| CAD, n (%) | 13 (46.4) | 25 (19.7) | 0.006§ |
| High fever (>38,3°), n (%) | 23 (82,1) | 116 (91,3) | 0,175§ |
| Low saturation (≤90%), n (%) | 28 (100) | 53 (41,7) | <0.001§ |
| Tachycardia (>100 beats/min), n (%) | 28 (100) | 67 (52.8) | <0.001§ |
| Hypotension (sys BP <90 mmHg), n (%) | 16 (57.1) | 9 (7.1) | <0.001‡ |
| Pneumonia on chest X-ray, n (%) | 25 (89.3) | 71 (55.9) | <0.001‡ |
| Coexisting Bacterial Pneumonia, n (%) | 7 (25.0) | 3 (2.4) | <0.001‡ |
| Interval from onset of illness to initiation of antiviral therapy, median (IQR)* | 4 (3-5) | 2 (1-3) | <0.001† |
| WBC (×103/ml3), median (IQR) | 11400 (5300-16000) | 6600 (4800-8600) | 0,005† |
| % PNML, median (IQR) | 82.1 (75.3-90.0) | 71.0 (58.0-80.0) | <0.001† |
| % LYM, median (IQR) | 10.1 (4.9-15.2) | 17.4 (12.0-29.6) | <0.001† |
| CRP (mg/L), median (IQR) | 146 (9.6-70.0) | 22.2 (8.0-32.0) | <0.001† |
| CK (U/L), median (IQR) | 450 (135-1190) | 81 (48-148) | <0.001† |
| ALT (IU/L) (IQR) | 32 (14.2-66.0) | 19 (15-32) | 0.035† |
| Creatine (mg/dL) (IQR) | 1.10 (0.78-2.22) | 0.77 (0.68-0.97) | 0.006† |
*A total of 146 patients received antiviral therapy. †Mann-Whitney U test ‡Fisher’s-exact test §Chi-square test
IQR: Interquartile range; COPD: Chronic obstructive pulmonary disease; CAD: Coronary artery disease; Sys BP: Systolic blood pressure; WBC: White blood cells; PMNL: Polymorphonuclears; Lym: Lymphocytes; CK: Creatine kinase; ALT: Alanine aminotransferase; CRP: C-Reactive protein; ICU: Intensive care unit; MV: Mechanical ventilation
Cultures of endotracheal aspirates or sputum were collected from 35 patients (22.6%) and bacterial growth that triggers pneumonia was determined in 10 (6.5%) patients. Blood cultures were taken from 32 (20.6%) patients and bacterial growth was recorded in 5 (3.2%) of them.
Twenty-eight (18.1%) patients were admitted to the ICU, 18 (11.6%) of them required mechanical ventilation, 10 (6.5%) needed vasopressor and 11 (7.1%) died. The median duration of hospitalization was 6 days (IQR 5-9). The median duration of stay in the ICU was 6 days (IQR 3-10). The median duration of mechanical ventilation was 7 days (IQR 3-19).
An ROC analysis was performed in order to determine the predictive value of the markers evaluated in the initial 24 hours after hospitalisation in order to assess mortality and need for intensive care in Influenza A (H1N1 and H3N2) infection. The biomarkers with the highest predictive value in terms of intensive care need have been determined CRP {0.893 (95% CI 0.813-0.974)} and CK {0.822 (95% CI 0.724-0.920)}. The cut-off values for the highest sensitivity and specificity in terms of intensive care prediction have been determined as 302 U/L and 76.5 mg/L for CK and CRP, respectively. Similarly, the biomarkers with the highest predictive value in terms of mortality have been determined as CK 0.94 {(95% CI 0.906-0.982)} and CRP {0.90 (95% CI 0.822-0.979)}. The cut-off values for the highest sensitivity and specificity in terms of mortality prediction have been determined as 234 U/L and 76.5 mg/L for CK and CRP, respectively [Table/Fig-3]. Serum CRP and CK levels were significantly high in patients who required ICU support or died [Table/Fig-4].
Sensitivity, specificity, negative and positive predictive values of indicators determined by the cut-off points in terms of the ICU need and mortality.
| Variables | AUC (%)* | Cut-off level | Sensitivity (%) | Specificity (%) | PPV (%)† | NPV (%)‡ |
|---|
| ICU | | | | | | |
| CRP (mg/dL) | 89.3 | 76.5 | 82.1 | 91.3 | 90.4 | 83.6 |
| CK (U/L) | 82.2 | 302 | 60.7 | 94.5 | 91.6 | 70.6 |
| PMNL% | 75.6 | 75.04 | 78.6 | 61.4 | 67.0 | 74.1 |
| LYM% | 73.9 | 11.19 | 78.7 | 61.7 | 67.2 | 74.3 |
| Mortality | | | | | | |
| CRP (mg/dL) | 90.0 | 76.5 | 90.9 | 83.3 | 83.9 | 89.2 |
| CK (U/L) | 94.0 | 234 | 100 | 85.4 | 83.5 | 100 |
| PMNL% | 77.0 | 75.04 | 90.9 | 57.6 | 67.7 | 85.1 |
| LYM% | 75.0 | 11.19 | 75.0 | 72.7 | 71.2 | 73.3 |
*AUC: Area under the curve; †PPV: Positive predictive value; ‡NPV: Negative predictive value
Comparison serum CRP levels on admission in patients who required ICU support and who developed mortality and not developed mortality.
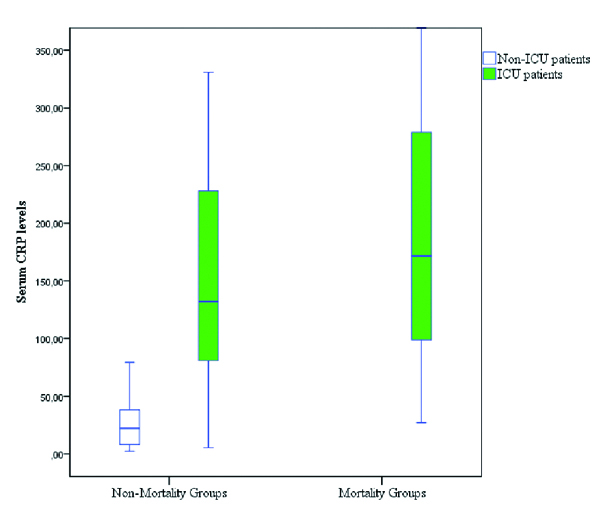
The variables (age, antiviral administration time, low oxygen saturation, hypotension, tachycardia, CAD, CRP, CK, PMNL%, LYM%) were included in COX regression model and statistically significant differences regarding mortality have been observed. It has been seen that the risk of mortality increased 1.007-fold (95% CI 1.001-1.013; p=0.017) for every 1 mg/L increase of serum CRP values. Prolonging the period between the onset of symptoms until the administration of the antivirals by one day caused 1.724 (95% CI 1.256-2.367; p=0.001) fold increase in mortality.
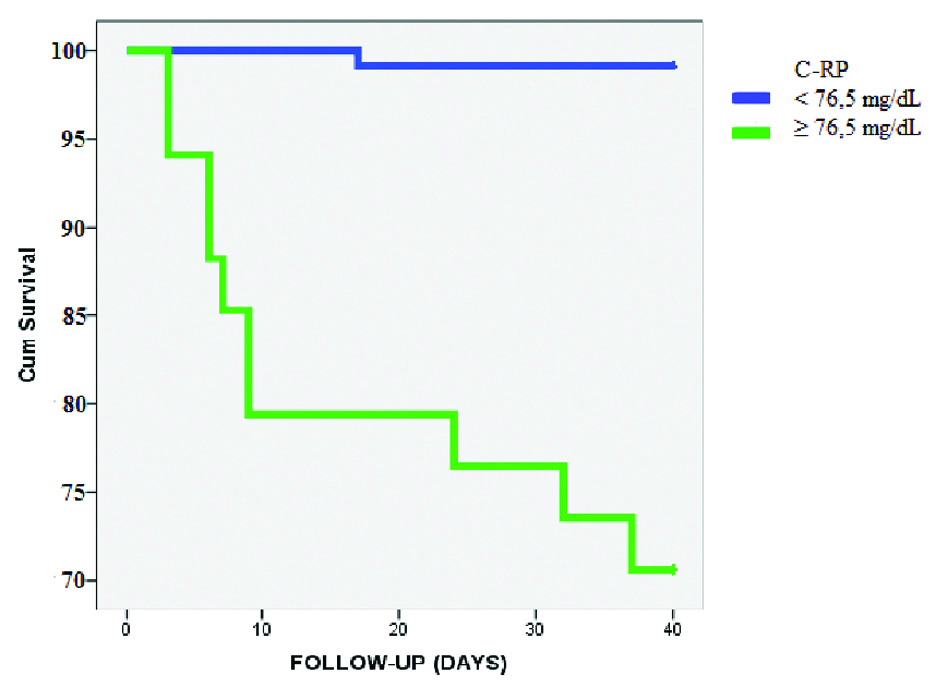
Throughout the observation period, 29.4% and 0.8% of the patients with a higher and lower CRP value than 76.5 mg/L, respectively developed mortality [Table/Fig-5]. The mean survival time of patients with serum CRP levels over 76.5 mg/L was 26.24 days, while the mean survival time of patients with serum CRP levels below 76.5 mg/L was 41.75 days, which is considered to be a statistically significant (Kaplan-Meier. p=0.001).
Kaplan Meier analysis displaying the cumulative probability of not reaching the outcome measure of death for patients according to the serum CRP levels on admission to the hospital.
Discussion
Several clinical findings and biochemical markers such as hypoxia, lymphopenia, serum CRP, CK and albumin levels, procalcitonin reflect the severity of illness in patients with influenza [5-9,12-14]. The results of the study show that low oxygen saturation, tachycardia, hypotension, finding consistent with pneumonia on chest X-ray, coexisting bacterial pneumonia, high percentage of neutrophil, lymphopenia, high serum CRP, CK levels at the time of hospital admission are associated with worse outcomes in patients infected with influenza virus. However, according to the COX regression analysis only initial serum CRP levels and time interval before antiviral therapy were independent predictors of mortality.
One of the most important factors to determine the prognosis in influenza cases is the timing of an effective therapy. In these cases, initiation of antiviral therapy at the right time is crucial in reducing influenza-related complications and mortality risk [15-18]. Even though it is known that initiation of antiviral therapy within the first 48 hours following the onset of symptoms of the disease increases the effectiveness of the treatment, it was revealed that therapeutic approaches, which are also applied after 48 hours, reduce mortality as well [19,20]. In this study, we found that the delay between the onset of symptoms and initiation of the therapy increased the need for intensive care support and mortality risk.
One biomarker that can be used to define severe influenza cases is CK level. In a study assessing H1N1 cases, in which patients were monitored in an intensive care unit following H1N1 pandemic in Mexico, it was found that CK values were significantly higher in the group where mortality developed [10,21]. Another study by Borgotta et al., which assessed the H1N1 pandemic period, it was revealed that there was an increase in renal and pulmonary complications in parallel with elevated CK [10]. In this study, cut-off values of 500 IU/L for renal complication and 1000 IU/L for pulmonary complications were used. In the same study mentioned above, it was also determined that patients with CK >1000 IU/L had longer hospital and intensive care stays; yet no difference was detected in terms of frequency in mortality [10]. In our study, CK levels of the patients, who required intensive care support and who developed mortality, were significantly high. Negative predictive value of the cut-off value of 234 U/L determined for CK was indicated as 100% with regard to development of mortality. Based on this limit value, it was assumed that CK could be used as a prognostic indicator in predicting mortality in cases of influenza. CRP can be used as a prognostic factor in cases of influenza. CRP values can increase as a result of the response of severe inflammation against viral infection [5,13,22]. Wu et al., have shown that serum CRP levels in patients with influenza (H7N9) infection were positively affected by several cytokines such as MIP-1b, MCP-1, IP-10, and IL-6. Therefore, investigators suggest that serum CRP may be used as an early indicator to identify high-risk patients and to determine the development of hypercytokinemia [13]. Moreover, they may also cause an increase in CRP values in secondary bacterial infections that are likely to develop in cases of influenza [5,23,24]. When compared with isolated H1N1 cases, it was found that CRP value increased significantly in cases of isolated bacterial pneumonia or mixed infection [8,24,25]. In these studies, it was also determined that CRP values in isolated H1N1 cases were higher than normal range. Therefore, it is assumed that in influenza cases, CRP values, dependent or independent of development of secondary bacterial infection, can be used in predicting the prognosis.
In a study by Zimmerman O et al., various CRP cut-off values were assessed in terms of predicting ICU admission and the need for mechanic ventilation, and with a cut-off value of 33 mg/L for both parameters, a NPV of 100% was found [5]. Morton B et al., used a CRP cut-off of 50 mg/L and oxygen exchange to predict safe discharge of patients with H1N1 [26]. Ingram PR et al., suggest that a CRP cut-off of 200 mg/L best identified the patients with bacterial/mixed infection in severe H1N1 influenza infection [25].
Limitation
The most important limitation of our study is the retrospective design. Another limitation is the failure to assess the consecutive results and the change in biomarker levels’ that would affect the prognosis.
Conclusion
In our study based on all values of sensitivity and specificity, the cut-off value of CRP for ICU admission and mortality was indicated as 76.5 mg/L. The frequency of development of mortality in cases below this limit value was determined to be <1% and survival times were found to be significantly higher.
In addition to this, with cut-off 234 IU/L, CK has a 100% negative predictive value for mortality. Thus, these cut-off values of CRP and CK could be used, along with the clinical findings, to predict the prognosis in severe influenza cases.
*A total of 146 patients received antiviral therapy. †Mann-Whitney U test ‡Fisher’s-exact test §Chi-square test.IQR: Interquartile range; COPD: Chronic obstructive pulmonary disease; CAD: Coronary artery disease; Sys BP: Systolic blood pressure; WBC: White blood cells; PMNL: Polymorphonuclears; Lym: Lymphocytes; CK: Creatine kinase; ALT: Alanine aminotransferase; CRP: C-Reactive protein
*A total of 146 patients received antiviral therapy. †Mann-Whitney U test ‡Fisher’s-exact test §Chi-square testIQR: Interquartile range; COPD: Chronic obstructive pulmonary disease; CAD: Coronary artery disease; Sys BP: Systolic blood pressure; WBC: White blood cells; PMNL: Polymorphonuclears; Lym: Lymphocytes; CK: Creatine kinase; ALT: Alanine aminotransferase; CRP: C-Reactive protein; ICU: Intensive care unit; MV: Mechanical ventilation
*AUC: Area under the curve; †PPV: Positive predictive value; ‡NPV: Negative predictive value