Introduction
Type 2 diabetes mellitus is a major factor for causing cardiovascular events by metabolic abnormalities. Dyslipidaemia is the primary metabolic abnormality that occurs in diabetes mellitus to develop complications. Hypertriglyceridaemia, low High Density Lipoprotein (HDL) and increased Low Density Lipoprotein (LDL) were considered as atherogenic factors in patients with type 2 diabetes mellitus. Insulin resistance is the major motivating factor for dyslipidaemia [1]. In general, no significant difference in the level of LDL was observed between diabetic and non-diabetic subjects. However, type 2 diabetic subjects typically have a prevalence of small dense oxidised LDL particles. This might possibly increase atherogenicity; even LDL concentration is not elevated [2]. Instead of lipid profile levels, increased lipoprotein ratios (TG/HDL, LDL/TG, LDL/HDL) have a better statistical association with severity and prevalence of Coronary Artery Disease (CAD) [3]. Dobiasova M and Frohlich J, proposed the term AIP, defined as log (TGL/HDL-c). Individuals with high AIP have a higher risk of Coronary Heart Disease (CHD) than those with low AIP. TGL and HDL-c were predictable markers for CHD risk; hence AIP may be useful for the prediction of atherogenicity [4].
Endothelial Dysfunction (ED) is another major factor for the development and clinical appearance of atherosclerosis. It might be caused by many factors such as dyslipidaemia, oxidative stress, inflammation and other factors. Lipid abnormality is the major factor to cause ED; especially LDL particles are more susceptible to oxidation. These oxidised LDL particles reduce the availability of NO and impair endothelial function. This emerges in a “positive feedback loop” in which inflammatory factors promote monocyte and T-cell adhesion, foam cell formation, extracellular matrix digestion and vascular smooth muscle migration and proliferation leading to atherosclerosis [5]. Since, atherogenic factors initiate ED and causes CVD, the study has been designed to estimate AIP and ED together considered as strong indicators to predict cardiovascular risk than AIP alone in type 2 diabetic subjects.
Materials and Methods
This was a cross-sectional pilot study in order to evaluate feasibility, cost and effect of size in an attempt to predict an appropriate sample size. The study was conducted on 80 subjects in the age group between 38-60 years. Among these, 40 were type 2 diabetic subjects and remaining 40 subjects were age and sex matched healthy controls. This study is part of a Ph.D work which was carried out from 2012 to 2016 and it was approved by the Institutional Ethical Committee at Vinayaka Mission Kirupananda Variyar (VMKV) Medical College, Salem, Tamil Nadu, India.
Selection criteria: Forty type 2 diabetic subjects were selected from Outpatient Department (OPD) of Vinayaka Mission Kirupananda Variyar Medical College and Hospitals, Salem, Tamil Nadu, India. These diabetic subjects who were on anti diabetic treatment without lipid lowering drugs or antioxidants and free from complications were included in the study. The diabetic subjects with smoking, alcoholism, hypertension, liver disease, kidney disease and thyroid disorders were excluded from the study.
Sample collection: Three millilitres of fasting blood sample was collected after obtaining informed consent from each subject. The blood samples were separated as serum/plasma by centrifugation at 3000 rpm for 15 minutes. 1 mL blood sample was collected in fluoride tube for sugar estimation; 1 mL transferred to heparin tube for NO estimation and remaining 1 mL sample was transferred to plain tube for the estimation of lipid profile. 1 mL of postprandial blood sample was collected in fluoride tube for sugar estimation. Lipid profile, fasting and postprandial sugar of all subjects were estimated on the same day of blood sample collection. NO samples were stored in a deep freezer at -20°C until analysis.
Biochemical analysis: Blood sugar was estimated by Glucose Oxidase-Peroxidase (GOD-POD) method [6]; Lipid profile (Total Cholesterol, TG and HDL) was estimated by well established methods (Cholesterol by cholesterol esterase and peroxidase, TG by glycerol phosphate oxidase and peroxidise and HDL-c by immunoinhibition, 2 reagent method) in fully autoanalyser [7-9]. LDL and Very Low Density Lipoprotein (VLDL) were calculated by standard Friedwald’s equation. VLDL cholesterol concentrate=TG/5 LDL cholesterol concentrate=Total cholesterol-(VLDL+HDL) [10].
Lipoprotein ratios were calculated by using TC, TG, LDL, VLDL and HDL values in Microsoft Excel. Atherogenic index of plasma was calculated by using formula log (TG/HDL-c) [11]. Body Mass Index (BMI) was calculated by using the formula=weight (kg)/height2 (metres) [12]. NO was estimated by kinetic cadmium reduction method in spectrophotometer [13].
Statistical Analysis
Data analysis were done by using Microsoft Excel and the Statistical Package for the Social Sciences (SPSS) software version 21.0. Mean and Standard Deviation was determined by using Microsoft Excel. “Kruskal-Wallis” test were performed for variables between the study groups. A p-value <0.05 was considered to be statistically significant. Pearson’s correlation test was done between the study parameters.
Results
The present study found significantly increased BMI, fasting and postprandial sugar in type 2 diabetic subjects compared to healthy controls [Table/Fig-1].
Basic characteristics of the study groups.
| Parameters | Healthy control (40) (mean±SD) | Type 2 DM (40) (mean±SD) | p-value |
|---|
| Age | 48.93±10.55 | 50.75±10.46 | >0.05 |
| BMI (kg/m2) | 20.42±0.84 | 24.55±3.12* | <0.05 |
| FBS (mg/dL) | 87.85±10.01 | 174.81±75.29* | <0.05 |
| PPBS (mg/dL) | 119.80±5.93 | 299.81±85.89* | <0.05 |
Data expression as mean±SD, Statistical significant was done by “Kruskal-Wallis” test, *Significant p-value=<0.05, DM: Diabetes mellitus, BMI: Body mass index, FBS: Fasting blood sugar, PPBS: Post prandial blood sugar
The [Table/Fig-2] shows significantly high levels of TG, LDL and VLDL in type 2 diabetic subjects than healthy controls. But, there lipoproteinwas no significant difference in the level of TC and HDL among the study groups.
Level of lipid profile between the study groups.
| Parameters | Healthy control (40) | Type 2 DM (40) | p-value |
|---|
| Total cholesterol (mg/dL) | 184.18±37.79 | 192.60±43.38 | >0.05 |
| Triglyceride (mg/dL) | 121.15±72.72 | 151.75±62.38* | <0.05* |
| LDL (mg/dL) | 119.13±34.13 | 181.70±45.72* | <0.05* |
| VLDL (mg/dL) | 24.23±14.54 | 30.30±12.48* | <0.05* |
| HDL (mg/dL) | 40.83±9.52 | 40.83±8.21 | >0.05 |
Data expression as mean±SD, Statistical significant was done by “Kruskal-Wallis” test,
*Significant p-value=<0.05, LDL: Low density lipoprotein, VLDL: Very-low density lipoprotein, HDL: High density lipoproteinwas
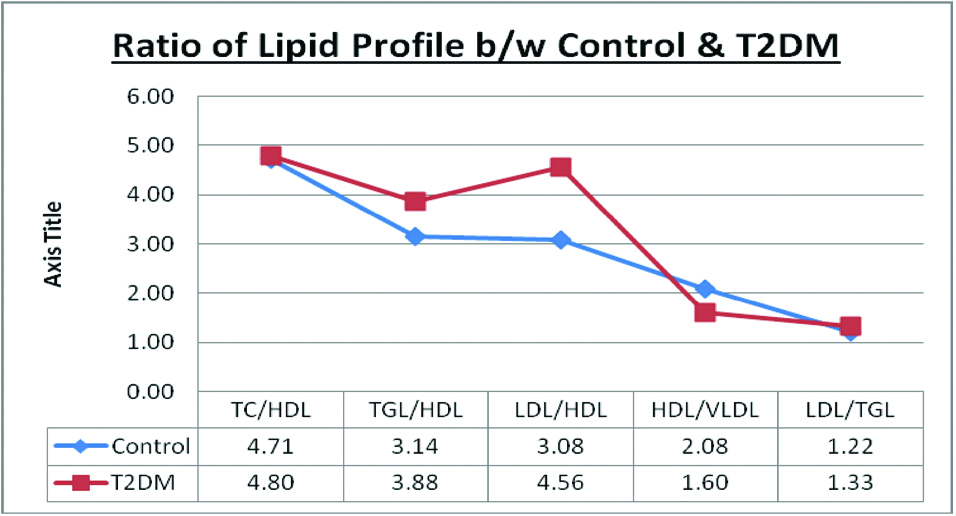
Significantly high level of TG/HDL-c, LDL/HDL-c and HDL/VLDL ratios were observed in type 2 diabetic subjects than healthy controls. But, there was no significant difference in the level of TC/HDL-c and LDL/TG ratios among the study groups [Table/Fig-3].
Level of lipid profile ratio in healthy controls and T2DM patients.
Data expression as mean±SD, Statistical significant was done by “Kruskal-Wallis” test, *Significant p-value=<0.05, TC: Total cholesterol, HDL: High density lipoprotein, TGL: Triglyceride, LDL: Low density lipoprotein, VLDL: Very-low density lipoprotein
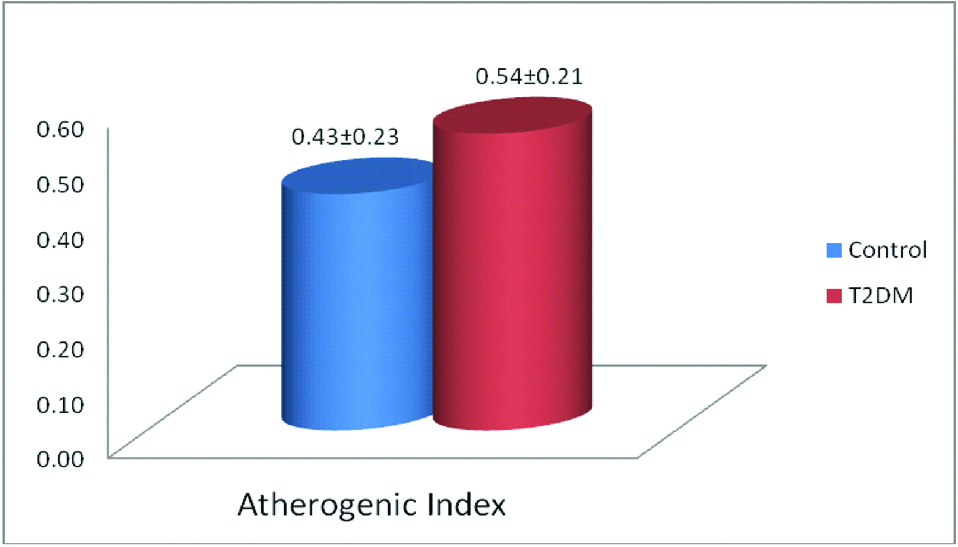
The [Table/Fig-4] shows significantly high level of AIP in type 2 diabetic subjects than healthy controls.
Status of antherogenic index among the study groups.
Data expression as mean±SD, Statistical significant was done by “Kruskal-Wallis” test, *Significant p-value=<0.05, T2DM: Type 2 Diabetes mellitus
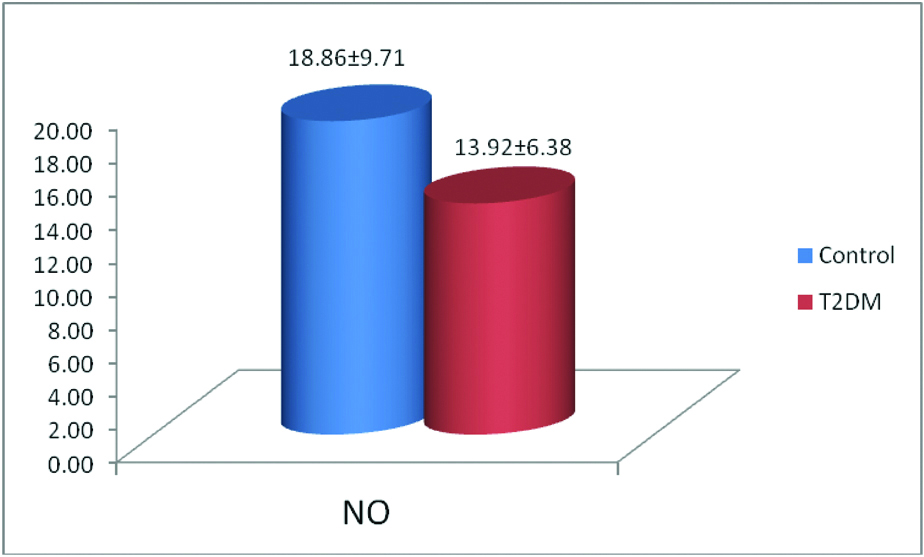
Significantly lower level of NO was observed in type 2 diabetic subjects compared to healthy controls [Table/Fig-5].
Study on the level of nitric oxide between control and T2DM.
Data expression as mean±SD, Statistical significant was done by “Kruskal Wallis” test, *Significant p-value=<0.05, T2DM: Type 2 Diabetes mellitus, No: Nitric oxide
A negative correlation of AIP with NO (r=-0.153) was observed in the present study, but this was not statistically significant [Table/Fig-6].
Correlation between NO, lipid profile and its ratio, AIP.
| Pearson’s correlation of NO |
|---|
| Parameters | r-value | p-value |
|---|
| TC | -0.139 | 0.227 |
| TG | -0.021 | 0.854 |
| HDL | 0.291 | 0.010* |
| LDL | -0.319 | 0.005* |
| TC/HDL | -0.345 | 0.002* |
| TG/HDL | -0.119 | 0.301 |
| LDL/HDL | -0.396 | 0.000* |
| LDL/TG | -0.271 | 0.017* |
| AIP | -0.153 | 0.185 |
Correlation between study parameters was done by ‘Pearson’s correlation’ in SPSS Software.
*Significant p-value=<0.05, TC: Total cholesterol, HDL: High density lipoprotein, TG: Triglyceride, LDL: Low density lipoprotein, AIP: Antherogenic index of plasma
Discussion
Type 2 diabetes mellitus is a complex disorder and includes multiple metabolic and vascular abnormalities, such as insulin resistance, dyslipidaemia, ED and vascular inflammation. Each of these abnormalities represents a major risk factor for the development of CVD [14]. Diabetic patients frequently have risk factors for atherosclerosis among which dyslipidaemia is likely to play a major role in the excess CHD mortality associated with the conditions [15]. Prevalence of CVD three times more in diabetic patients compared to the general population and most of them are related to diet. However, genetic lipid abnormalities such as hypercholesterolaemia, hypertriglyceridaemia, HDL cholesterol and hyperlipidaemias are more severe [14,16]. Lipid abnormality is a causative factor for ED and further progress towards the development of vascular complications. Hyperglycaemia may be one of the most important risk factors for the development of ED and atherosclerosis [17].
The present study found significantly high level of fasting and postprandial sugar, and BMI in type 2 diabetic subjects than healthy controls [Table/Fig-1]. This shows that the diabetic subjects are in uncontrolled condition. Poor glycaemic control and BMI are known risk-factors for the development of diabetic complications by increasing metabolic abnormalities.
Lipid profile: Lipid abnormality plays a major role in the development of vascular complications in diabetes. In the present study, significantly high levels of triglycerides, LDL and VLDL were observed in patients with type 2 diabetes than healthy controls [Table/Fig-2]. An earlier study has reported significantly higher levels of triglycerides, VLDL cholesterol and significantly lower level of HDL cholesterol in patients with type 2 diabetes than in healthy controls [18]. Gupta M and Chari S, has observed significantly altered levels of total cholesterol, triglyceride, LDL cholesterol, VLDL cholesterol, and HDL cholesterol in diabetic patients with Ischaemic Heart Disease (IHD) than without complications [19]. American Diabetic Association (ADA) reported that increased triglycerides and decreased HDL levels were the best predictors of CVD [20]. According to strong heart study, LDL cholesterol is an independent predictor of CVD in diabetic patients [21]. However, Garg N et al., has reported that TC/HDL and LDL/HDL ratios are more specific and accurate indices for CAD than considering only TC, TG, LDL and HDL levels [22].
Lipoprotein ratio and cardiovascular disease: The TC/HDL-c and LDL/HDL-c ratios are two important atherogenic indicators of vascular risk [23]. The present study found significantly high level of TG/HDL-c and LDL/HDL-c ratios in type 2 diabetic patients than healthy controls [Table/Fig-3]. An earlier study has revealed that increased ratio of TC/HDL and LDL/HDL in diabetic subjects than non-diabetic subjects [22]. Fatima A et al., has shown a significant increase of TC/HDL and LDL/HDL in diabetic atherosclerotic subjects than non-diabetic atherosclerotic and healthy controls [24]. It is known that TG/HDL-c, LDL/HDL-c and TC/HDL-c ratios may be useful for predicting risk of CVD [16]. Da Luz PL et al., has reported that TG/HDL-c ratio was a more conventional marker of Myocardial Infarction (MI) than TC/HDL-c and LDL/HDL-c ratios [25]. There is evidence that increased TG levels in both fasting and non-fasting conditions can help to predict CVD. Hence, TG/HDL-c ratio has become more important, providing mixed dyslipidaemic pattern in the setting of obesity and metabolic syndrome [16].
Atherogenic index of plasma: The AIP is defined as the logarithm of the TGL/HDL-c ratio, which has been predicted as a risk marker for the development of MI, stroke and CVD [26-28]. The [Table/Fig-4] shows significantly high level of AIP in type 2 diabetic subjects compared to healthy controls. An earlier study has identified increased AIP in obese women with and without Metabolic Syndrome (MetS) than normal women. The study also stated that AIP was associated with TGL/HDL-c, LDL/HDL-c, MI and CVD. It has also shown strong association of AIP with triglyceride and LDL, and predicted as risk of CVD death [26,29].
Endothelial dysfunction: Endothelial dysfunction is an earlier risk factor that contributes to the pathogenesis of CVD [30]. ED has been proposed to be associated with microangiopathy and atherosclerosis in type 1 and type 2 diabetes mellitus [31]. In the present study, significantly lower level of NO was observed in patients with type 2 diabetes compared to healthy controls [Table/Fig-5]. An earlier study has witnessed ED in both peripheral and coronary circulation of type 2 diabetic subjects [32]. The hallmark of ED is impaired endothelium-dependent vasodilation due to reduced availability of NO. Hence, reduced bioavailability of NO production has been proposed as a key mechanism of ED and plays an important role in atherosclerosis [33]. This is frequently associated with other cardiovascular risk factors including obesity, hypertension and dyslipidaemia [34].
There are several mechanisms projected to describe the abnormality in NO mediated vasodilation such as dyslipidaemia, oxidative stress, obesity, inflammation etc. These mechanisms induce decreased production of NO by the endothelium (loss of eNOS function) or increased inactivation of endothelial derived NO by reactive oxygen species [35]. Lipid abnormality is the major reason for ED in diabetes mellitus. Lipids are circulated as lipoproteins; LDL cholesterol is the major contributor to total cholesterol. These LDL particles are more susceptible to oxidation and production oxidised LDL particles (Ox-LDL). Uptake of these Ox-LDL particles by macrophages leads to formation of foam cells and smooth muscle cells and their proliferation. This further injures the endothelium by inflammatory cytokines produced by foam cells [36]. There are other markers to assess ED such as Intercellular Adhesion Molecule-1 (ICAM-1), Vascular Cell Adhesion Molecule-1 (VCAM-1), E-selectin, von Willebrand factor (vWF), etc., [37,38]. In the present study, lipid abnormality might be the reason for the reduced availability of NO in type 2 diabetic subjects.
Correlation between lipid profile ratio, AIP and NO: The present study has shown significant positive correlation between NO and HDL. It was also found that NO has significant negative correlation with LDL, TC/HDL, LDL/HDL and LDL/TG. AIP and TG/HDL were negatively correlated with NO, but not significant. However, the study found significantly high level of AIP, TG/HDL and lower level of NO in type 2 diabetic subjects [Table/Fig-6]. As we know hyperglycaemia itself develops dyslipidaemia, oxidative stress, ED and finally to cardiovascular risk in diabetic subjects; the study has proved that AIP is a significant factor for CVD risk than lipid profile level.
However, the present study shows negative correlation of AIP with NO, but statistically not significant. Since, both AIP and NO are individual for cardiovascular risk factor; estimation of AIP along with NO may be a strong indicator for predicting cardiovascular risk in diabetic subjects.
Limitation
The sample size is low in this study due to the exclusion criteria. Type 2 diabetic subjects who are advised to take lipid lowering drugs and antioxidants were excluded from the study. Also subjects with complications and who have a habit of smoking and alcoholism were omitted from present study. This might be the major reason for low sample size in present study.
Conclusion
The present study found high-risk of CVD with high level of AIP and lower level of NO in type 2 diabetic subjects. AIP is an atherogenic factor to assess cardiovascular events; reduced NO availability indicates the initial stage of atherosclerosis process. Since, both are risk-factors for diabetic cardiovascular events, AIP may be a good marker, but addition of NO can be a strong indicator for cardiovascular risk.
Data expression as mean±SD, Statistical significant was done by “Kruskal-Wallis” test, *Significant p-value=<0.05, DM: Diabetes mellitus, BMI: Body mass index, FBS: Fasting blood sugar, PPBS: Post prandial blood sugar
Data expression as mean±SD, Statistical significant was done by “Kruskal-Wallis” test,*Significant p-value=<0.05, LDL: Low density lipoprotein, VLDL: Very-low density lipoprotein, HDL: High density lipoproteinwas
Correlation between study parameters was done by ‘Pearson’s correlation’ in SPSS Software.*Significant p-value=<0.05, TC: Total cholesterol, HDL: High density lipoprotein, TG: Triglyceride, LDL: Low density lipoprotein, AIP: Antherogenic index of plasma
[1]. Toledo FG, Sniderman AD, Kelley DE, Influence of hepatic steatosis (fatty liver) on severity and composition of dyslipidaemia in type 2 diabetesDiabetes Care 2006 29(8):1845-50.10.2337/dc06-045516873790 [Google Scholar] [CrossRef] [PubMed]
[2]. Henry RR, Preventing cardiovascular complications of type 2 diabetes: focus on lipid managementClin Diabetes 2001 19(3):113-20.10.2337/diaclin.19.3.113 [Google Scholar] [CrossRef]
[3]. Acay A, Ulu MS, Ahsen A, Ozkececi G, Demir K, Ozuguz U, Atherogenic index as a predictor of atherosclerosis in subjects with familial mediterranean feverMedicina 2014 50(6):329-33.10.1016/j.medici.2014.11.00925541265 [Google Scholar] [CrossRef] [PubMed]
[4]. Dobiášová M, Frohlich J, The plasma parameter log (TG/HDL-C) as an atherogenic index: correlation with lipoprotein particle size and esterification rate in apoB-lipoprotein-depleted plasma (FER HDL)Clin Biochem 2001 34(7):583-88.10.1016/S0009-9120(01)00263-6 [Google Scholar] [CrossRef]
[5]. Widlansky ME, Gokce N, Keaney JF, Vita JA, The clinical implications of endothelial dysfunctionJ Am Coll Cardio 2003 42(7):1149-60.10.1016/S0735-1097(03)00994-X [Google Scholar] [CrossRef]
[6]. Lott JA, Turner K, Evaluation of Trinder’s glucose oxidase method for measuring glucose in serum and urineClin Chem 1975 21(12):1754-60. [Google Scholar]
[7]. Allain CC, Poon LS, Chan CS, Richmond WF, Fu PC, Enzymatic determination of total serum cholesterolClin Chem 1974 20(4):470-75. [Google Scholar]
[8]. Oboh FO, Enobhayisobo EI, Effect of aqueous extract of Vernonia amygdalina leaves on plasma lipids of hyperlipidaemic adult male albino New Zealand rabbitsAfrican Scientist 2009 10(4):203-13. [Google Scholar]
[9]. Grove TH, Effect of reagent pH on determination of high-density lipoprotein cholesterol by precipitation with sodium phosphotungstate-magnesiumClin Chem 1979 25(4):560-64. [Google Scholar]
[10]. Warnick GR, Knopp RH, Fitzpatrick V, Branson L, Estimating low-density lipoprotein cholesterol by the Friedewald equation is adequate for classifying patients on the basis of nationally recommended cutpointsClin Chem 1990 36(1):15-19. [Google Scholar]
[11]. Onat A, Can G, Kaya H, Hergenç G, “Atherogenic index of plasma” (log 10 triglyceride/high-density lipoprotein-cholesterol) predicts high blood pressure, diabetes, and vascular eventsJ Clin Lipidol 2010 4(2):89-98.10.1016/j.jacl.2010.02.00521122635 [Google Scholar] [CrossRef] [PubMed]
[12]. Deurenberg P, Weststrate JA, Seidell JC, Body mass index as a measure of body fatness: age-and sex-specific prediction formulasBr J Nutr 1991 65(2):105-14.10.1079/BJN199100732043597 [Google Scholar] [CrossRef] [PubMed]
[13]. Sun J, Zhang X, Broderick M, Fein H, Measurement of nitric oxide production in biological systems by using Griess reaction assaySensors 2003 3(8):276-84.10.3390/s30800276 [Google Scholar] [CrossRef]
[14]. Kendall DM, Rubin CJ, Mohideen P, Ledeine JM, Belder R, Gross J, Improvement of glycemic control, triglycerides, and HDL cholesterol levels with muraglitazar, a dual (α/g) peroxisome proliferator–activated receptor activator, in patients with type 2 diabetes inadequately controlled with metformin monotherapyDiabetes Care 2006 29(5):1016-23.10.2337/dc05-114616644631 [Google Scholar] [CrossRef] [PubMed]
[15]. Berthezène F, Diabetic dyslipidaemiaBr J Diabetes Vasc Dis 2002 2(1):S12-17.10.1177/1474651402002001S0401 [Google Scholar] [CrossRef]
[16]. Upadhyay RK, Emerging risk biomarkers in cardiovascular diseases and disordersJ Lipids 2015 2015:97145310.1155/2015/97145325949827 [Google Scholar] [CrossRef] [PubMed]
[17]. Dosi RV, Acharya DS, Patell RD, Endothelial dysfunction in a cohort of Indian patients with type-2 diabetes mellitusJ Indian Assoc Clin Med 2012 13(3):DS206-09. [Google Scholar]
[18]. Kumawat M, Sharma TK, Singh I, Singh N, Ghalaut VS, Vardey SK, Antioxidant enzymes and lipid peroxidation in type 2 diabetes mellitus patients with and without nephropathyN Am J Med Sci 2013 5(3):213-19.10.4103/1947-2714.10919323626958 [Google Scholar] [CrossRef] [PubMed]
[19]. Gupta M, Chari S, Proxidant and antioxidant status in patients of type II diabetes mellitus with IHDIndian J Clin Biochem 2006 21(2):118-22.10.1007/BF0291292523105627 [Google Scholar] [CrossRef] [PubMed]
[20]. American Diabetic AssociationPathogenesis. In Medical Management of Type 2 Diabetes 2003 4th EditionAlexandria, VaAmerican Diabetic Association:19-26.Zimmerman BR, Ed [Google Scholar]
[21]. Howard BV, Robbins DC, Sievers ML, Lee ET, Rhoades D, Devereux RB, LDL cholesterol as a strong predictor of coronary heart disease in diabetic individuals with insulin resistance and low LDL: the strong heart studyArterioscler Thromb Vasc Biol 2000 20(3):830-35.10.1161/01.ATV.20.3.83010712410 [Google Scholar] [CrossRef] [PubMed]
[22]. Garg N, Agrawal YB, Gupta SA, Study of lipid profile levels in diabetics and nondiabetics taking TC/HDL ratio and LDL/HDL ratio into considerationJ Indian Assoc Clin Med 2014 15(3-4):192-95. [Google Scholar]
[23]. Millán J, Pintó X, Muñoz A, Zúñiga M, Rubiés-Prat J, Pallardo LF, Lipoprotein ratios: physiological significance and clinical usefulness in cardiovascular preventionVasc Health Risk Manag 2009 5:757-65.10.2147/VHRM.S626919774217 [Google Scholar] [CrossRef] [PubMed]
[24]. Fatima A, Jammal H, Anwar SS, Nadia W, Characterization of lipid parameters in diabetes and non-diabetic atherosclerotic patientsJ Geriatr Cardiol 2015 12:37-43. [Google Scholar]
[25]. Da Luz PL, Favarato D, Faria-Neto JR Jr, Lemos P, Chagas ACP, High ratio of triglycerides to HDL-cholesterol predicts extensive coronary diseaseClinics 2008 64:427-32.10.1590/S1807-59322008000400003 [Google Scholar] [CrossRef]
[26]. Essiarab F, Taki H, Lebrazi H, Sabri M, Saile R, Usefulness of lipid ratios and atherogenic index of plasma in obese Moroccan women with or without metabolic syndromeEthn Dis 2014 24(2):207-12. [Google Scholar]
[27]. Sujata R, Kavitha S, Atherogenic indices in stroke patients: A retrospective studyIranian Journal of Neurology 2017 16(2):78-82. [Google Scholar]
[28]. Hartopo AB, Arso IA, Setianto BY, Low plasma atherogenic index associated with poor prognosis in hospitalized patients with acute myocardial infarctionActa Medica Indonesiana 2016 48:106-13. [Google Scholar]
[29]. Cai G, Ganwei S, Xue S, Lu W, The atherogenic index of plasma is a strong and independent predictor for coronary artery disease in the Chinese Han populationMedicine 2017 96(37):e80510.1097/MD.000000000000805828906400 [Google Scholar] [CrossRef] [PubMed]
[30]. Hadi HA, Al Suwaidi J, Endothelial dysfunction in diabetes mellitusVasc Health Risk Manag 2007 3(6):853-76. [Google Scholar]
[31]. Calles-Escandon J, Cipolla M, Diabetes and endothelial dysfunction: a clinical perspectiveEndocr Rev 2001 22(1):36-52.10.1210/edrv.22.1.041711159815 [Google Scholar] [CrossRef] [PubMed]
[32]. Hamilton SJ, Chew GT, Watts GF, Therapeutic regulation of endothelial dysfunction in type 2 diabetes mellitusDiab Vasc Dis Res 2007 4(2):89-102.10.3132/dvdr.2007.02617654442 [Google Scholar] [CrossRef] [PubMed]
[33]. Davignon J, Ganz P, Role of endothelial dysfunction in atherosclerosisCirculation 2004 109(23 suppl 1):III27-32.10.1161/01.CIR.0000131515.03336.f815198963 [Google Scholar] [CrossRef] [PubMed]
[34]. Versari D, Daghini E, Virdis A, Ghiadoni L, Taddei S, Endothelial dysfunction as a target for prevention of cardiovascular diseaseDiabetes Care 2009 32(suppl 2):S314-21.10.2337/dc09-S33019875572 [Google Scholar] [CrossRef] [PubMed]
[35]. Pitocco D, Tesauro M, Alessandro R, Ghirlanda G, Cardillo C, Oxidative stress in diabetes: implications for vascular and other complicationsInt J Mol Sci 2013 14(11):21525-50.10.3390/ijms14112152524177571 [Google Scholar] [CrossRef] [PubMed]
[36]. Ho E, Galouggahi KK, Liu CC, Bhindi R, Figtree GA, Biological markers of oxidative stress: Applications to cardiovascular research and practiceRedox Biology 2013 1(1):483-91.10.1016/j.redox.2013.07.00624251116 [Google Scholar] [CrossRef] [PubMed]
[37]. Horstman LL, Jy W, Jimenez JJ, Ahn YS, Endothelial microparticles as markers of endothelial dysfunctionFront Biosci 2004 9(1118):e3510.2741/127014977533 [Google Scholar] [CrossRef] [PubMed]
[38]. Thorand B, Baumert J, Chambless L, Meisinger C, Kolb H, Döring A, Elevated markers of endothelial dysfunction predict type 2 diabetes mellitus in middle-aged men and women from the general populationArterioscler Thromb Vasc Bio 2006 26(2):398-405.10.1161/01.ATV.0000198392.05307.aa16322530 [Google Scholar] [CrossRef] [PubMed]