Cardiovascular Disease (CVD) is the leading cause of death in patients with Chronic Kidney Disease (CKD) [1]. CKD patients usually have multiple CVD risk factors like diabetes mellitus, hypertension, and dyslipidemia. These conditions are associated with Oxidative Stress (OS) that can initiate the inflammatory process and hasten renal injury progression [2].
Lipids, when reacted with free radicals, can undergo the highly damaging chain reaction of lipid peroxidation leading to direct and indirect effects [3]. MDA is a sensitive marker of lipid peroxidation; which is formed during oxidation process of polyunsaturated fatty acids by Reactive Oxygen Species (ROS) [4].
MDA concentration is the best marker for estimation of CV risk events in HD patients [5], and direct contact of blood with dialysis membrane during HD can produce inflammatory reactions and OS that results in the modification of lipoprotein particles and lipid oxidation products [6].
This study aimed to assess the effect of HD on lipid peroxidation and lipid atherogenic ratios as risk predicator’s of CVD in the heightened dyslipidemia state perceived in HD patients, and clarify possible associations with systemic inflammatory response markers and/or metabolic parameters.
Materials and Methods
This was a cross-sectional case-control study involving 60 End-Stage Renal Diseases (ESRD) patients on regular HD. These patients were attending the nephrology unit of Luxor general hospital-Upper Egypt, between June 2016 and May 2017. All HD patients received dialysis 3 times weekly, each for 4 hour, using convectional bicarbonate dialysate with polysulphone membrane dialyzers (Bio-140; Dialife SA, Taverne, Switzerland). All patients’ received medication: anti-hypertensive drugs (calcium antagonists, angiotensin converting enzyme inhibitors), phosphate binders (calcium carbonate), recombinant erythropoietin therapy by the subcutaneous route (average dose of 4000 U/week) together with parenteral iron and 22(36.67%) take iron only by intravenous infusion by the end of HD.
Thirty healthy volunteers (17 males & 13 females) aged (45.87±10.23 years), BMI (27.15±2.78 kg/m2); who were free from any kidney disease, having normal haematological, biochemical values, and did not receive any medication known to interfere with the studied variables were selected from medical staff in the hospital. They served as control. The study was approved by research ethics committee in Qena faculty of medicine in accordance with Declaration of Helsinki and all participants gave an informed consent.
Exclusion criteria
Patients age younger than 19 years or had pregnancy, malignancy, infections, recent febrile or infectious episodes, hospitalization during the past month or history of acute cardiovascular disease, HBV or HCV and HIV positivity, severe hyperparathyroidism, or who take any lipid-lowering medications or antioxidant supplements either medical or non-medical, or refuse to participate in the study.
The following characteristics were observed or calculated: age, gender, duration of dialysis, weight, height, and BMI. Other relevant dialysis data included the cause of renal failure, duration of dialysis, and presence of co-morbid factors (e.g., diabetes mellitus, hypertension etc.,), medication taken by the patient; blood pressure was measured using standard mercury sphygmomanometer. The average of two blood pressure readings, recorded at an interval of 5 minute, was used for analysis. Hypertension was defined as a systolic blood pressure of >130 mmHg, a diastolic blood pressure of >80 mmHg, or a history of treatment for hypertension.
Blood Samples
Five milliliter venous blood samples were taken twice from HD patients; pre-HD and post-HD on a midweek HD sessions. The pre-HD sample was drawn from arteriovenous fistulas at insertion of the arterial needle, before heparinization of the line and after an overnight fast before the patient was connected to the dialysis machine and the post-HD sample just prior to patient disconnection. The blood samples were taken once from the control subjects.
Blood samples were collected in EDTA (2 mL), and plain (3 mL) vacutainer tubes. EDTA tube was used for Complete Cell Count (CBC) using cell dyne-1800 (Abbott diagnostics, Santa Clara; California-USA). Plain tube blood was allowed to clot and then centrifuged at 3000 rpm for 10 minute and serum was separated for colorimetric assessment-blood chemistry {urea, creatinine, uric acid, albumin and lipid profile including: Total Cholesterol (TC), Triglycerides (TG), Low-Density Lipoprotein Cholesterol (LDL-C), And High-Density Lipoprotein Cholesterol (HDL-C)} (Cobas C311, Roche Diagnostics, Mannheim-Germany). The rest of serum was aliquoted into two 1 mL cryo tubes kept at -70°C until analysis of MDA.
Dyslipidemia was defined as a serum LDL-c level of >140 mg/dL, a HDL-c level of <40 mg/dL, a TG level of >150 mg/dL, or a history of treatment for dyslipidemia.
Malondialdehyde (MDA) Measurement
MDA was measured by quantitative colorimetric end point assay according to the manufacturer’s instructions provided by bio-diagnostic-Egypt, pharmaceutical industries (Cat No: 2528). Briefly, Thiobarbituric Acid (TBA) reacts with MDA in acidic medium at temperature of 95°C for 30 minute to form thiobarbituric acid reactive product, the absorbance of the pink product result was measured at 534 nm [7]. The detection limit of this assay was 1 nmol/mL; the intra- and inter-assay for CV were 1.82% and 4.01%, respectively. The serum concentration of MDA was expressed in nmol/mL. To avoid the possible dispersion of MDA serum level results, all the samples were processed at the same time, at the end of the recruitment process.
Calculations were Done For
Systemic inflammatory response markers: {Neutrophil: Lymphocyte Ratio (NLR), the Platelet: Lymphocyte Ratio (PLR), and the Lymphocyte: Monocyte Ratio (LMR)} as high NLR and PLR were related to adverse cardiac events and extent of atherosclerosis [8].
Monocyte: HDL-c ratio; its increase was associated with a worse cardiovascular profile and it was considered as independent predictors of major cardiovascular events [9].
Estimated Glomerular Filtration Rate (eGFR) using Chronic Kidney Disease Epidemiology Collaboration (CKD-EPI) Equation [10].
LDL-c= TC–{(HDL-c)+(VLDL-c)}= TC–{HDL-c+(TG/5)} mg/dL [11].
Non-high-density lipoprotein cholesterol (Non-HDL-c) = TC- HDL-c= {accounts for LDL-c, VLDL and its remnants that reflects the increased risk of coronary heart disease}.
Atherogenic risk ratios: TC/HDL-c, LDL-c/HDL-c, VLDL/HDL-c, Non-HDL-c/HDL-c, TG/HDL-c, LDL-c/VLDL, the higher the value of this indices the greater the risk of developing CVD [12].
Statistical Analysis
It was performed using SPSS 20.0 (IBM SPSS statistics; USA). Data were expressed in mean and standard deviation (mean±SD), number and percentage. Depending on the distribution of variables, the comparisons between groups were performed using one-way analysis of variance (ANOVA). Pearson correlation coefficient was used to explore the relationship between quantitative variables.
ROC Curve was performed to obtain cut-off value of MDA, sensitivity, specificity and Area Under the Curve (AUC) was used to discriminate between HD patients and controls.
Univariate logistic regression analysis (Odd’s Ratio) was performed for calculation of cardiac risk factors for heart attack in HD cases. Factors which showed significant correlation in univariate regression analysis were included in multivariate regression analysis. All statistical tests were two tailed, and a p-value <0.05 was considered statistically significant.
Results
HD patient’s baseline demographic characteristics and clinical data are presented in [Table/Fig-1]. Comparison of laboratory data between HD cases and control are presented in [Table/Fig-2].
Demographic data of the HD groups.
| Parameter | All Patient (No= 60) | Males 33(55%) | Females 27(45%) | p-value |
|---|
| Age (years) | 50.6±12.8 | 50.9±12.9 | 50.2±12.9 | 0.831 |
| Dialysis duration (Months) | 88.4±39.39 | 90.91±41.89 | 85.33±36.66 | 0.589 |
| Systolic blood pressure | 144.33±18.54 | 144.55±19.69 | 144.07±17.38 | 0.922 |
| Diastolic blood pressure | 88.5±12.05 | 88.64±10.77 | 88.33±13.66 | 0.924 |
| BMI (kg/m2) | 24.45±3.147 | 23.99±2.723 | 25.02±3.575 | 0.493 |
| Cause of renal failure No (%) |
| Diabetes mellitus | 22(36.7%) | 11(33.33%) | 11(40.74%) | |
| Hypertension | 14(23.3%) | 8(24.24%) | 6(22.22%) | |
| Obstructive | 9(15%) | 5(15.15%) | 4(14.82%) | |
| Congenital anomaly | 4(6.7%) | 3(9.09%) | 1(3.70%) | |
| Unknown | 4(6.7%) | 2(6.06%) | 2(7.42%) | |
| Polycystic kidney | 3(5%) | 2(6.06%) | 1(3.70%) | |
| Pyelonephritis | 2(3.3%) | 2(6.06%) | 0 | |
| Rheumatoid arthritis | 1(1.7%) | 0 | 1(3.70%) | |
| Systemic lupus erythematosus | 1(1.7%) | 0 | 1(3.70%) | |
BMI: Body Mass Index
Comparison of laboratory data between the two groups.
| Parameter (Mean±SD) | Patient No=60 | Controls No=30 | *p-values |
|---|
| Pre-HD | Post-HD |
|---|
| Urea (mg/dL) | 92.8±26.6 | 52.95±15.04 | 32.17±6.02 | <0.00001 |
| Creatinine (mg/dL) | 4.84±2.19 | 2.32±1.02 | 1.00±0.23 | <0.00001 |
| Uric acid (mg/dL) | 7.82±1.29 | 5.55±0.87 | 4.67±0.76 | <0.00001 |
| Albumin (g/dL) | 3.7±0.04 | 4.19±0.51 | 4.67±0.50 | <0.00001 |
| eGFR (mL/min/1.73m2) | 17.6±15.2 | 44.6±35.8 | 99.5±22.98 | <0.00001 |
| Hb (g/dL) | 8.7±1.7 | 9.5±1.8 | 13.15±2.16 | <0.00001 |
| MCV | 85.19±9.16 | 86.48±8.96 | 81.26±4.81 | 0.022 |
| RDW % | 15.72±1.35 | 15.72±1.33 | 14.21±1.18 | <0.00001 |
| Platelets ×109/L | 193.8±54.6 | 207.9±55.0 | 254.2±73.5 | 0.0001 |
| MPV (fL) | 9.18±1.05 | 9.22±1.05 | 8.49±0.66 | 0.002 |
| WBCs ×109/L | 6.22±2.33 | 6.54±2.44 | 7.83±2.36 | 0.010 |
| WBCs: MPV | 528.4±258.4 | 523.8±276.9 | 502.9±380.5 | 0.924 |
| # Neutrophil ×109/L | 4.3±1.85 | 4.57±1.94 | 5.12±2.23 | 0.184 |
| # Lymph count ×109/L | 1.50±0.6 | 1.51±0.67 | 2.27±1.05 | <0.00001 |
| # Monocyte count ×109/L | 429±227 | 470±241 | 445±234 | 0.626 |
| Monocyte/HDL | 12.94±9.14 | 16.12±10.32 | 9.17±5.40 | 0.003 |
| NLR | 3.17±1.58 | 3.47±1.78 | 2.65±1.65 | 0.095 |
| PLR | 151.4±76.1 | 168.2±91.1 | 124±46.3 | 0.0424 |
| LMR | 4.15±2.61 | 3.70±2.25 | 6.10±3.23 | 0.0003 |
| TC (mg/dL) | 180.8±17.5 | 188.3±18.2 | 192.4±26.4 | 0.0195 |
| LDL (mg/dL) | 107.9±17.4 | 111.8±18.8 | 113.4±28.6 | 0.4047 |
| TG (mg/dL) | 186.7±24.4 | 228.3±38.5 | 138.2±26.1 | <0.00001 |
| VLDL (mg/dL) | 37.34±4.87 | 45.4±7.6 | 27.6±5.22 | <0.00001 |
| HDL (mg/dL) | 35.56±6.06 | 30.9±5.89 | 50.38±8.68 | <0.00001 |
| Non-HDL | 145.2±18.5 | 157.3±20.0 | 142.0±30.3 | 0.002 |
| TC/HDL | 5.21±0.99 | 6.35±1.56 | 3.97±1.03 | <0.00001 |
| LDL/HDL | 3.14±0.799 | 3.8±1.2 | 2.38±0.92 | <0.00001 |
| VLDL/HDL | 1.09±0.28 | 1.54±0.46 | 0.57±0.16 | <0.00001 |
| TG/HDL | 5.45±1.39 | 7.76±2.32 | 2.84±0.78 | <0.00001 |
| Non-HDL/HDL | 4.22±1.01 | 5.35±1.56 | 2.96±1.03 | <0.00001 |
| LDL/VLDL | 2.92±0.57 | 2.53±0.61 | 4.17±1.05 | <0.00001 |
| MDA (nmol/mL) | 3.01±0.73 | 4.27±0.85 | 1.64±0.58 | <0.00001 |
*one-way ANOVA; Hb: haemoglobin; RDW: red cell distribution width; WBCs: white blood cells; #: absolute; MPV: mean platelets volume; NLR: Neutrophil lymphocyte ratio; PLR: platelets lymphocyte ratio; LMR: lymphocyte monocyte ratio; TC:
HD-cases showed significant higher values concerning serum urea, creatinine and uric acid than controls that significantly decreased post-HD (p<0.00001). Inversely, serum albumin, Hb, eGFR, (p<0.00001) and platelets count (p=0.0001) were significantly lower than controls but increased significantly in post-HD. HD-cases showed significantly higher MDA than controls that increased significantly in post-HD (p<0.00001).
Compared to controls; HD-patients had significantly lower WBCs (p=0.010) and lymphocyte counts (p<0.00001) with insignificant difference between pre- and post-HD.
HD patients had: 1) significantly lower LMR (p=0.0003) with insignificant difference between pre- and post-HD (p=0.164); 2) significant higher PLR (p=0.0424) that increased significantly in post-HD than pre-HD; 3) significantly lower monocyte/HDL ratio (p=0.003) that significantly increased in post-HD than pre-HD. Yet; NLR (p=0.095) and absolute monocyte count (p=0.626) showed insignificant difference.
HD patients had significantly higher TG (p<0.00001) and non-HDL-c (p=0.002) that significantly increased in post-HD than pre-HD. While HDL-c was significantly lower in HD cases compared to the control group (p<0.00001) and significantly decreased post-HD than pre-HD.
The levels of TC and VLDL-c were within the reference values for studied groups. But Mann-Whitney U-test revealed significantly higher TC (p= 0.0195), VLDL-c (p<0.00001) in HD cases compared to the control group that significantly increased in post-HD than the pre-HD. Yet; LDL-c showed insignificant difference.
The indexes of TC/HDL, LDL/HDL, VLDL/HDL, TG/HDL, Non-HDL/ HDL were significantly higher in HD-cases compared to controls, and inversely LDL/VLDL was lower in HD-cases insignificant difference between pre-and post-HD (p<0.00001).
No significant differences between male and female HD-patients were found in all parameters (data not shown).
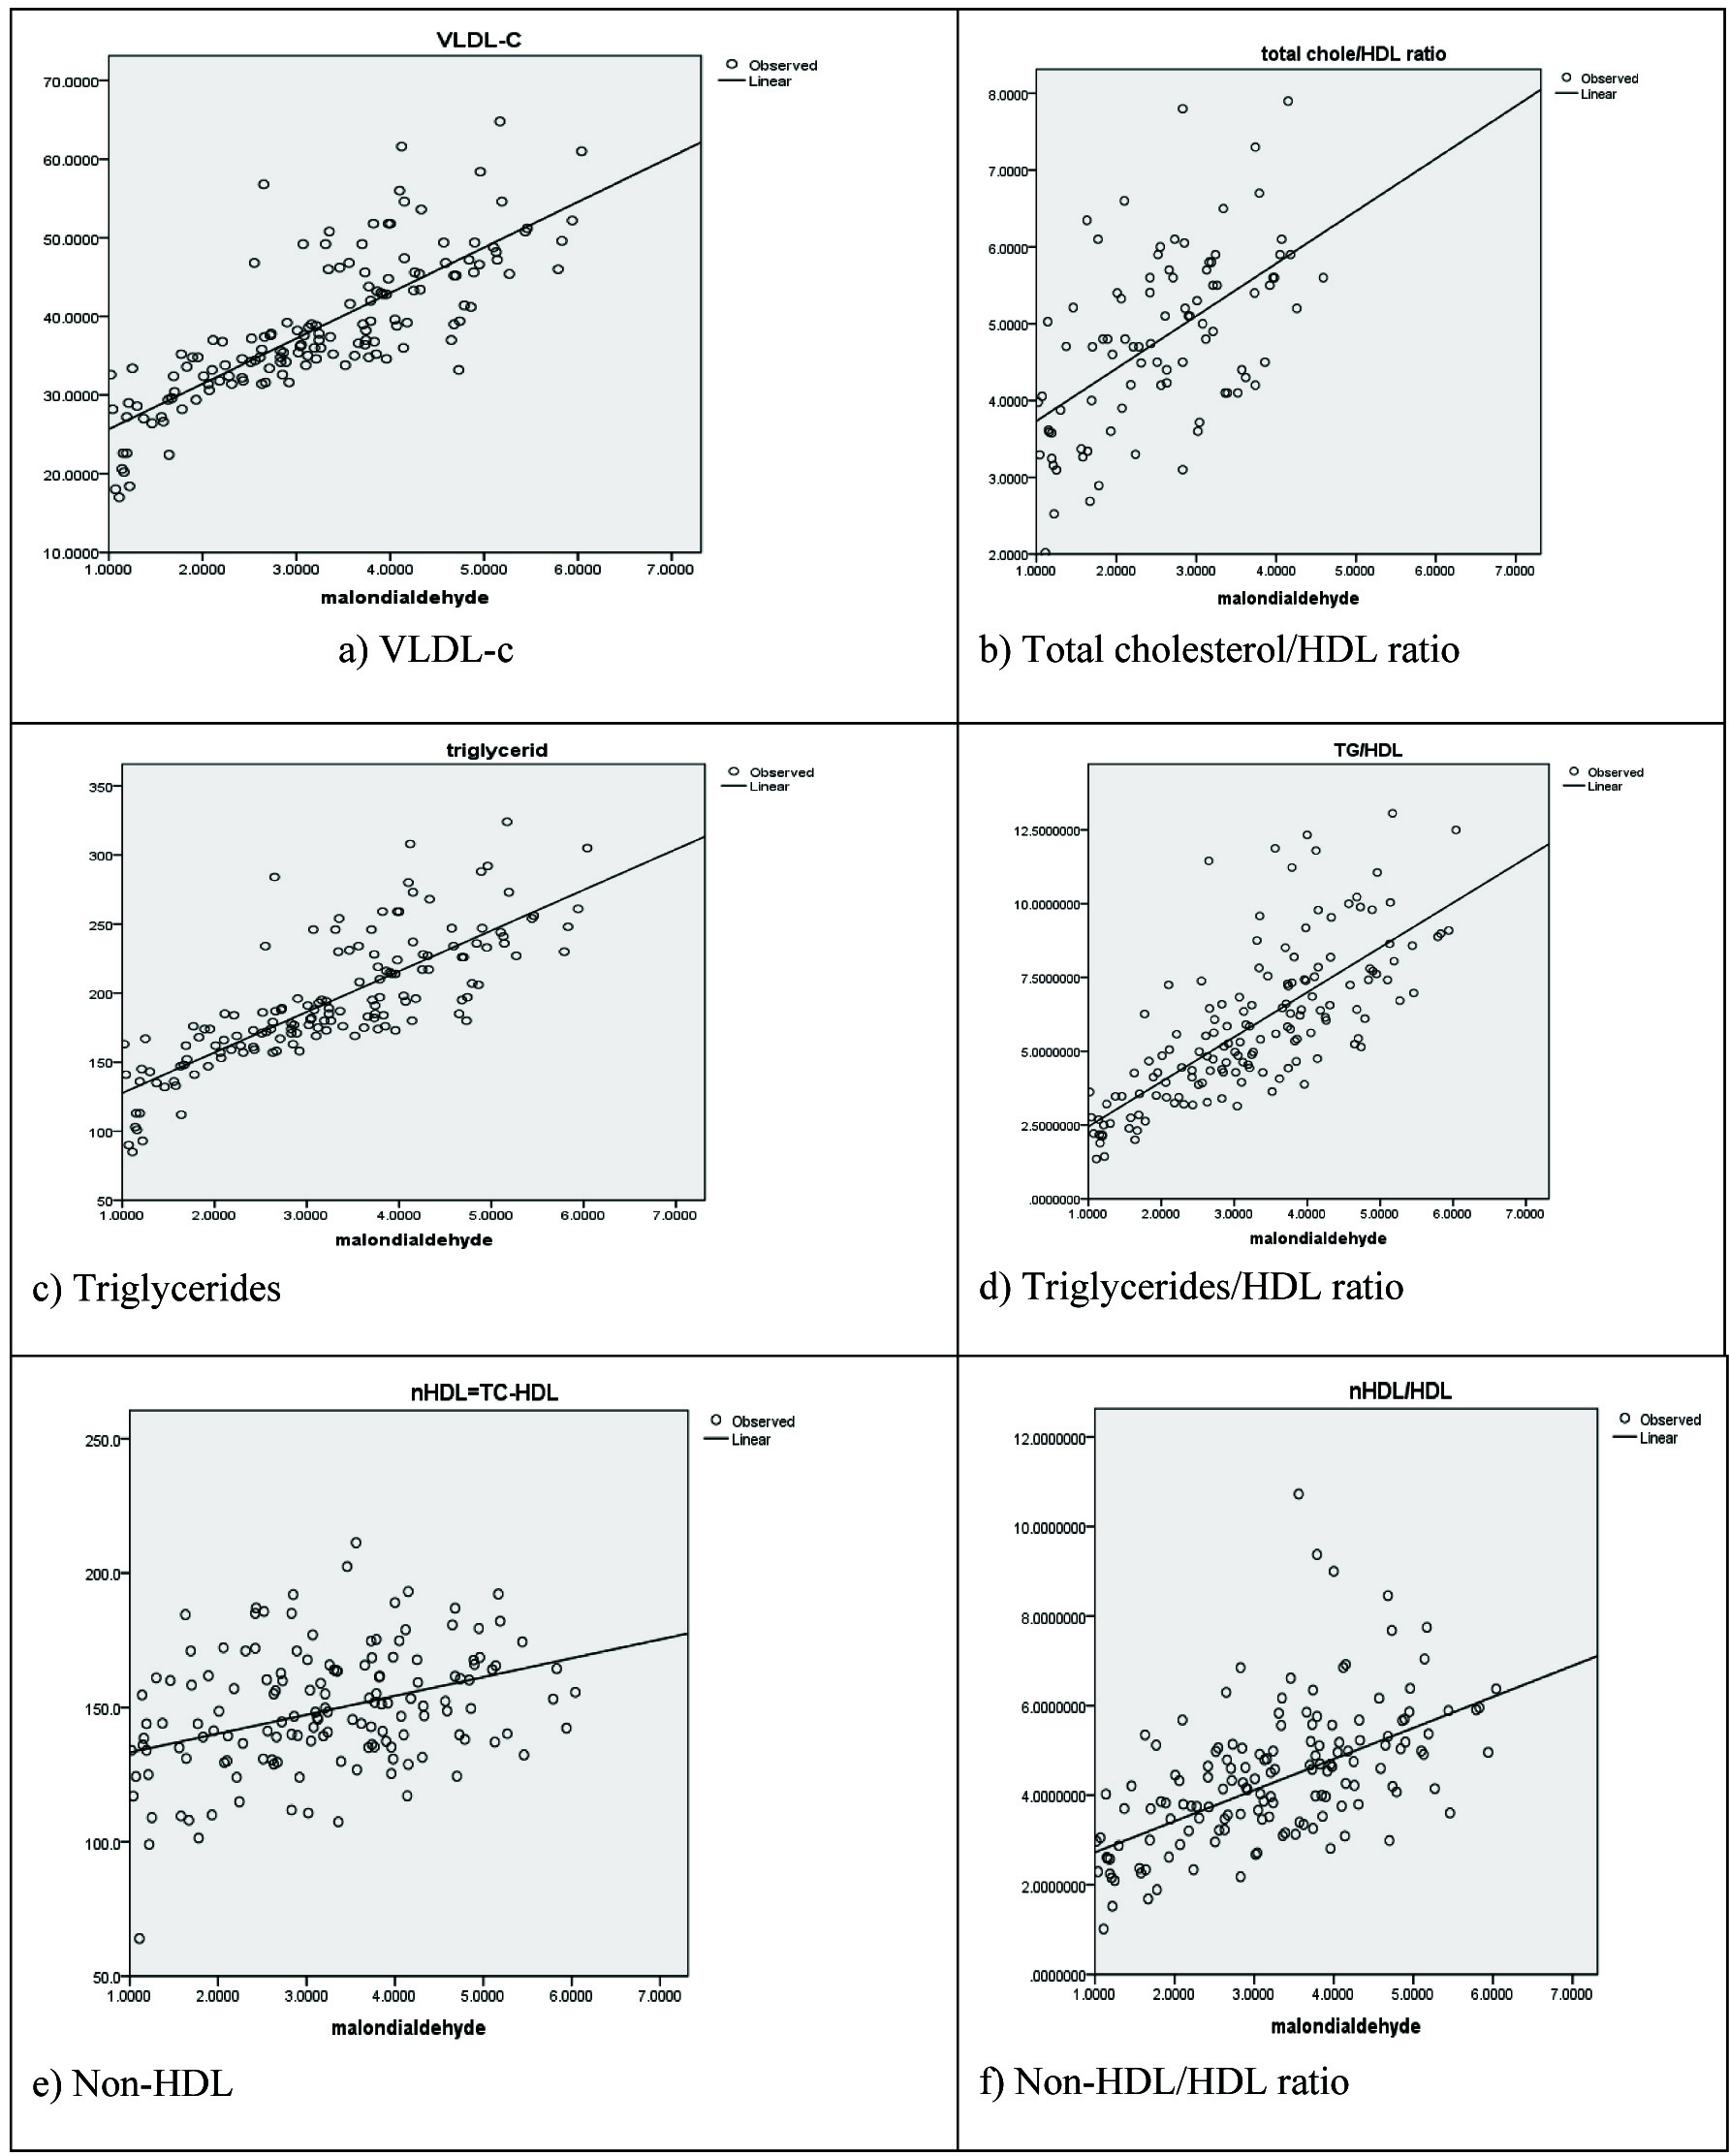
MDA in all subjects was positively correlated with TG, VLDL-c, non-HDL/HDL, and TG/HDL ratio. In addition; MDA in healthy subjects positively correlated with TC, LDL-c, Non-HDL-c, and LDL/HDL ratio. MDA in pre-HD and control groups positively correlated with TC/HDL ratio. Moreover; MDA in pre-HD group positively correlated with monocyte/HDL-c and negatively correlated with HDL-c [Table/Fig-3].
Pearson Correlation between MDA in HD-patients and control.
| Variable | MDA in control No= 30 | MDA in patients No= 60 |
|---|
| Pre-HD | Post-HD |
|---|
| r | p-value | r | p-value | r | p-value |
|---|
| Duration of HD therapy | - | - | -0.2146 | 0.101 | - | - |
| Age (years) | 0.295 | 0.114 | 0.143 | 0.250 | 0.174 | 0.591 |
| Systolic BP (mmHg) | 0.177 | 0.352 | -0.093 | 0.478 | -0.110 | 0.403 |
| Diastolic BP (mmHg) | 0.178 | 0.349 | 0.008 | 0.953 | 0.071 | 0.590 |
| BMI (kg/m2) | 0.107 | 0.574 | 0.138 | 0.357 | 0.106 | 0.342 |
| Hb (g/dL) | 0.200 | 0.290 | 0.077 | 0.560 | 0.021 | 0.872 |
| RDW % | -0.119 | 0.530 | -0.123 | 0.348 | -0.073 | 0.582 |
| WBCs count ×109/L | 0.045 | 0.813 | 0.138 | 0.292 | 0.088 | 0.504 |
| Platelets ×109/L | 0.032 | 0.867 | -0.121 | 0.357 | -0.136 | 0.300 |
| NLR | 0.104 | 0.584 | 0.123 | 0.349 | 0.103 | 0.433 |
| PLR | 0.118 | 0.535 | -0.054 | 0.682 | -0.026 | 0.844 |
| LMR | -0.175 | 0.355 | -0.067 | 0.611 | -0.045 | 0.733 |
| Monocyte/HDL-c | 0.3337 | 0.071 | 0.2643 | 0.041 | 0.098 | 0.461 |
| Urea (mg/dL) | 0.232 | 0.219 | -0.060 | 0.650 | -0.144 | 0.272 |
| S. Creatinine (mg/dL) | 0.145 | 0.443 | 0.121 | 0.357 | 0.137 | 0.298 |
| S. Uric acid (mg/dL) | 0.264 | 0.176 | -0.149 | 0.256 | 0.051 | 0.698 |
| S. Albumin (g/dL) | 0.171 | 0.366 | 0.065 | 0.620 | 0.057 | 0.668 |
| eGFR (mL/min/1.73m2) | -0.262 | 0.162 | -0.084 | 0.524 | -0.183 | 0.162 |
| TC (mg/dL) | 0.613 | <0.001* | .127 | 0.334 | -0.057 | 0.667 |
| LDL-c (mg/dL) | 0.520 | 0.003* | 0.032 | 0.808 | -0.146 | 0.264 |
| HDL-c mg/dL | -0.186 | 0.324 | -0.2623 | 0.043* | -0.235 | 0.070 |
| Triglycerides (mg/dL) | 0.660 | <0.001* | 0.667 | <0.001* | 0.425 | <0.001* |
| VLDL (mg/dL) | 0.659 | <0.001* | 0.667 | <0.001* | 0.408 | <0.001* |
| Non-HDL | 0.584 | <0.001* | 0.206 | 0.114 | 0.018 | 0.892 |
| TC/HDL ratio | 0.442 | 0.014* | 0.284 | 0.028* | 0.122 | 0.353 |
| LDL/HDL ratio | 0.403 | 0.027* | 0.031 | 0.815 | 0.031 | 0.815 |
| TG/HDL ratio | 0.562 | <0.001* | 0.512 | <0.001* | 0.340 | 0.008* |
| Non-HDL/HDL ratio | 0.442 | 0.014* | 0.289 | 0.025* | 0.122 | 0.354 |
Hb: haemoglobin; RDW: red cell distribution width; WBCs: white blood cells; #: absolute; MPV: mean platelets volume; NLR: Neutrophil lymphocyte ratio; PLR: platelets lymphocyte ratio; LMR: lymphocyte monocyte ratio; TC: total cholesterol; HDL-c: High density lipoprotein-cholesterol; LDL-c: Low density lipoprotein-cholesterol; VLDL-c: Very Low density lipoprotein-cholesterol; TG: Triglyceride; non-HDL-c: non-High density lipoprotein-cholesterol; eGFR: estimated glomerular filtration rate; MDA: Malondialdehyde.
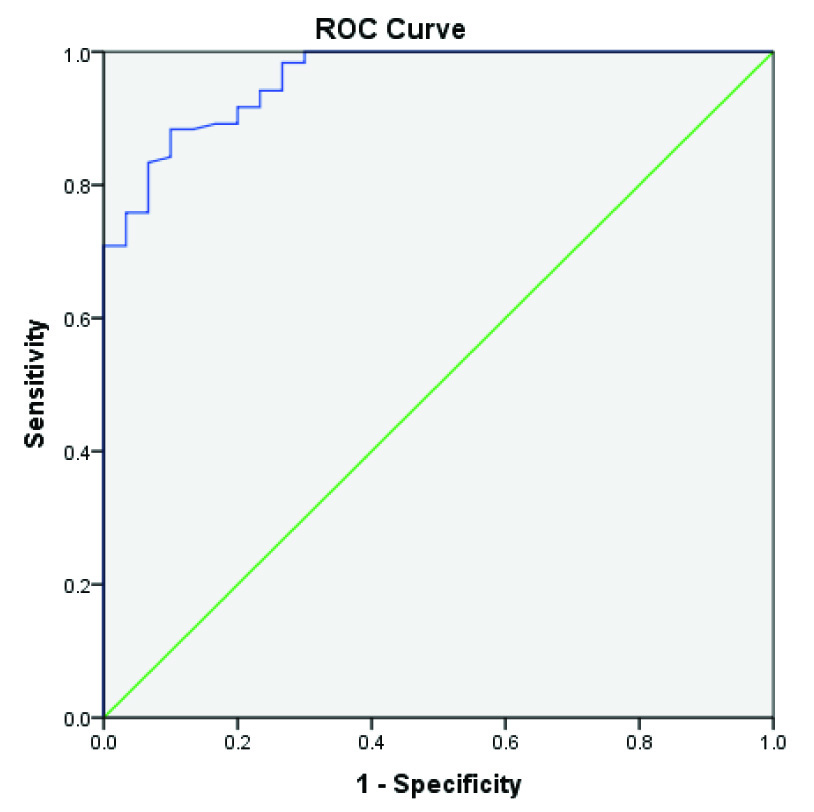
ROC curve shows that the cut-off value of MDA is 2.47, with a sensitivity of 88.3% and a specificity of 90% and Area under the Curve (AUC) was 0.960. This cut off value was used in the following binary logistic regression analysis [Table/Fig-4,5 and Table/Fig-6].
Correlation between MDA and: a) VLDL-c; b) total cholesterol/HDL ratio; c) triglycerides; d) triglycerides/HDL ratio; e) non-HDL; f) non-HDL/HDL ratio.
MDA Receiver Operator Curve (ROC) charactrestics.
| Area | Std. Error | p-value | Asymptotic 95% Confidence Interval |
|---|
| Lower Bound | Upper Bound |
|---|
| 0.960 | 0.016 | <0.001 | 0.929 | 0.991 |
MDA ROC Curve analysis, specificity and sensitivity.
Percentage of normal and abnormal MDA level in control and HD patients groups according to the cut off value calculated from the ROC curve statistic [Table/Fig-7] .
Percentage of normal and abnormal MDA level in all groups according to the cut off value calculated from the ROC curve.
| MDA | Group | Total |
|---|
| Control | Pre-HD | Post-HD |
|---|
| Normal | No (%) | 27(90%) | 14(23.3%) | 0(0.0%) | 41(27.3%) |
| Abnormal | No (%) | 3(10%) | 46(76.7%) | 60(100%) | 109(72.7%) |
| Total | No (%) | 30(100%) | 60(100%) | 60(100%) | 150(100%) |
Chi-square = 82.367, p-value <0.001
Multivariate regression analysis indicates inter-related variables and none were considered independent risk factor [Table/Fig-8].
Multivariate logistic regression analysis in HD patients demonstrating the relationship of MDA with other variables.
| Variable | Odd’s ratio (OR) | 95% CI | p-value |
|---|
| Lower | Upper |
|---|
| HDL-c (mg/dL) | 0.851 | 0.648 | 1.118 | 0.247 |
| Triglycerides (mg/dL) | 0.160 | 0.002 | 50.78 | 0.995 |
| VLDL (mg/dL) | 0.166 | 0.019 | 23.80 | 0.995 |
| Non-HDL (mg/dL) | 1.057 | 0.666 | 1.679 | 0.813 |
| LDL/HDL ratio | 0.011 | 0 | 1032 | 0.916 |
| TG/HDL ratio | 1.004 | 0.992 | 1.105 | 0.994 |
| VLDL/HDL ratio | 0.987 | 0.619 | 2.029 | 0.994 |
| LDL/VLDL ratio | 0.019 | 0 | 4879 | 0.532 |
| Non-HDL/HDL ratio | 11.087 | 0 | 85.86 | 0.871 |
Discussion
In this study, serum urea, creatinine, uric acid showed significantly higher values in the pre-HD and post-HD groups compared to control group with a significant decrease in post-HD compared to pre-HD values. Inversely; Hb, albumin levels, and eGFR showed significantly lower values in the pre-HD and post-HD groups compared to control group with a significant increase in post-HD compared to pre-HD values.
In this study; HD-patients had normocytic normochromic anaemia with significantly lower Hb compared to controls that showed mild increase post-HD when compared to pre-HD, this was in line with other studies [13-16].
In this study; HD-patients had lower WBC count, absolute neutrophil, and lymphocyte counts compared to controls, this was in line with other studies [17-19] but in partial agreement with Suresh et al., who found insignificant decrease in WBC count [14].
In contrast, Alghythan & Alsaeed, Latiwesh et al., reported insignificant difference between WBC count in the pre-HD and the post-HD group compared to control [20,21], but Shittu et al., found that WBC count increases with the disease progression [15], while Ali et al., showed mild increase in WBC post-HD compared to pre-HD [22].
In this study, absolute lymphocyte counts decreased significantly in pre-and post HD when compared to controls but the insignificant difference between pre and post-HD group, this was in agreement with previous studies [14,23,24]. This was partially consistent with Pereira et al., who reported significantly lower absolute lymphocyte counts in the post-HD group compared to control and pre-HD groups [18].
In contrast; Alghythan and Alsaeed reported a significant increase in the leukocyte [20], lymphocyte and monocyte counts in post-HD when compared to the pre-HD count, this could be explained by the existence of hypervolaemia in pre-HD and the RBCs count and Hb level are lower and the increase in post-HD due to the release of RBCs from the splanchnic circulation to reward the hypovolaemic stress during HD [25].
In this study; platelets count were within normal limits but significantly decreased in pre-and post-HD when compared to controls with a significant increase in the post-HD group compared to pre-HD, this was in agreement with previous studies [20,22,26]. In contrast; few reports showed a significant decrease in platelets post-HD compared to pre-HD [27,28].
In this study, the NLR was insignificantly lower in pre-HD and post-HD compared to control and not correlated to lipid profile or uramic findings. In contrast; others found that NLR was significantly higher in HD patients than controls and that it was positively correlated with other inflammatory markers either interleukin-6 (IL-6) and/or high-sensitivity C-reactive protein (hs-CRP) but negatively correlated to Hb, albumin, and total cholesterol and they suggested that this may indicate that HD technique induces a state of inflammation [29,30].
This may be explained by the fact that in ~ 20% HD-patients; the exposure of blood to artificial membranes results in neutrophil activation followed by aggregation and adherence to endothelial surface and subsequent fall in WBC count [31].
In this study monocyte count showed an insignificant difference, though; monocyte/HDL was significantly higher in HD cases and significantly increased in post-HD than pre-HD and had a positive correlation with MDA in the pre-HD group. This was in line with Kanbay et al., who indicated that renal dysfunction was linked by a decline in serum HDL-c and rise of circulating monocyte count [9].
Our findings of elevated MDA levels in HD patients compared to controls with a significant increase in post-HD samples suggest that Chronic renal failure and HD increase the oxidative stress this was in agreement with the previous studies [6,32-36].
In this study, we found that the levels of TC, LDL, and VLDL were within normal limits with insignificant difference observed between cases and controls; this was in agreement with Tsimihodimos et al., [37]. In contrast, other authors found a significant increase in TC in HD cases when compared to controls [34,38,39].
In this study; TG and non-HDL-c were significantly higher in the HD group compared to the control group and were significantly higher in the post-HD than in the pre-HD as a result of haemoconcentration; this result in agreement with several studies [33,34,37,40,41].
In contrast, some reported a significant decrease of TG, TC, LDL, and HDL in post-HD cases compared to pre-HD [42]. Yamamoto et al., found insignificant differences in TG and HDL levels between patients with ESRD-HD and controls [43].
In the present study, HDL was significantly lower in HD patients than controls and it decreases significantly in post-HD compared to pre-HD, this was in accordance with [34,41,44,45].
In the present study, HD patients had significantly higher atherogenic lipid risk ratios {TC/HDL, LDL/HDL, and TG/HDL}. This was in line with previous studies [33,34,37,41,46]. Kim et al., specified that TG/HDL ratio was correlated to insulin resistance and that it is significantly associated with stage 3 CKD or more, among Koreans [46].
In this study; other lipid risk ratios as VLDL/HDL, non-HDL/HDL, and LDL/VLDL were significantly higher in HD patients.
Limitation
The major limitation of our present study is the limited study population and a single centre study besides cross-sectional design.
Conclusion
Cardiovascular risk factors such as anaemia, dyslipidemia, inflammation, OS, and hypertension are prevalent in HD patients. HD worsens OS, caused by uraemia and accentuates existing lipid peroxidation and dyslipidemia, all are probably independent modifiable risk factors that contribute to morbidity and mortality by promoting atherosclerosis and CVD.
Recommendations
Strategies focusing on the improvement of the haemocompatibility of the dialysis system and management of risk factors must be applied to improve outcome, therefore, lipid risk ratios and inflammatory markers may provide a tool for patients monitoring.
BMI: Body Mass Index
*one-way ANOVA; Hb: haemoglobin; RDW: red cell distribution width; WBCs: white blood cells; #: absolute; MPV: mean platelets volume; NLR: Neutrophil lymphocyte ratio; PLR: platelets lymphocyte ratio; LMR: lymphocyte monocyte ratio; TC:
Hb: haemoglobin; RDW: red cell distribution width; WBCs: white blood cells; #: absolute; MPV: mean platelets volume; NLR: Neutrophil lymphocyte ratio; PLR: platelets lymphocyte ratio; LMR: lymphocyte monocyte ratio; TC: total cholesterol; HDL-c: High density lipoprotein-cholesterol; LDL-c: Low density lipoprotein-cholesterol; VLDL-c: Very Low density lipoprotein-cholesterol; TG: Triglyceride; non-HDL-c: non-High density lipoprotein-cholesterol; eGFR: estimated glomerular filtration rate; MDA: Malondialdehyde.
Chi-square = 82.367, p-value <0.001