Introduction
A significant number of measures are undertaken on a daily basis in clinical chemistry laboratories in order to maintain a strict control over the results generated from the laboratory. The constant endeavour to improve the quality of results and to maintain them at those levels constitutes the quality improvement process. The procedures followed to monitor the results in a single laboratory are known as internal quality control (IQC) [1] while the set of procedures followed in order to compare the performance between different laboratories is known as external quality assessment (EQA). Proficiency testing is an integral component of the quality improvement process as it provides an objective assessment of laboratory competence for the consumers, accreditation bodies and regulatory agencies [2].
The IQC aims to maintain the daily precision and accuracy of the particular analytical method while EQA is important for maintaining the long term accuracy of the methods. EQA systems had to be introduced to objectively compare the processes followed in different laboratories as the aliquots of same samples analysed in different laboratories even with same methods showed wide variation in the results. The variation in the results of the laboratories may be in part due to the presence of undetected systematic errors in the methods. The use of EQA subsequently resulted in the standardization of procedures and calibrators in the laboratories so that uniformity could be achieved among the laboratories [3]. Apart from improving the methods and procedures in the participating laboratories, EQA is also an important part of the accreditation process for any clinical chemistry laboratory.
Various EQA programs are available to laboratories, which may be either sponsored by professional societies or may be run by manufacturers of control materials. The participating laboratories analyse the same lot of the quality control material and the results are sent for data analysis. Since at any given time, a large number of laboratories are enrolled in the programs, the data analysis is never possible in real time and is sent to the participating laboratories in a monthly fashion [4]. The data following extensive statistical analysis is provided in multiple forms, though the VIS and SDI are the ones that are most significant. The VIS helps in identifying the performance of each parameter as the result is compared against the designated value and its variance is graded in a score <100 (very good), 100-150 (good), 151-200 (satisfactory) & >200 (not acceptable) [5]. SDI is a measure of the bias in the report and is reported as interpreted as <1.0(excellent),1-1.5 (good);1.5-2.0 (accept with caution) and >2.0 (take corrective action).
The equipments that have been used in the present study are VITROS 4600 (ORTHOCLINICAL DIAGNOSTICS) and DIMENSION EXL 200 (SIEMENS), which are both fully automatic biochemistry analysers, VITROS 4600 being a Dry Chemistry system and DIMENSION EXL 200 a Wet Chemistry Analyser. The current study was done in order to emphasise that use of a dry chemistry analyser over a wet chemistry analyser drastically improves the performance in EQAS.
The current study was done in order to compare the results of EQAS on the analysers DIMENSION EXL 200 (Wet chemistry system) and VITROS 4600 (Dry chemistry analyser).
Materials and Methods
The present observational study was undertaken in the laboratory of a 1000 bedded super specialty service hospital in Delhi from Jan 2016 to Jun 2017. The biochemistry section of the laboratory was enrolled in EQA programme run by Christian Medical College (CMC), Vellore that is handled by the clinical biochemistry department.
The participating laboratory was enrolled in the chemistry Protocol (glucose, urea, creatinine, total bilirubin, total protein, albumin, calcium, phosphorus, uric acid, total cholesterol, triglyceride, HDL cholesterol, sodium, potassium, chloride, bicarbonate, AST, ALT, ALP, amylase, CK-total, iron and magnesium) and urine chemistry protocol (urea, creatinine, calcium, phosphorus, uric acid, sodium, potassium and microalbumin).
The results were uploaded on the EQA website before 20th of each month and the results were put up by the 2nd working day of each month.
For the duration of Jan to Dec 2016, the EQA sample were analysed on Dimension EXL 200 PLATFORM (SIEMENS HEALTHINEERS), a wet chemistry analyser and from Jan to Jun 2017, the samples were analysed on VITROS® 4600 (ORTHOCLINICAL DIAGNOSTICS), a dry chemistry analyser. For platforms, the reagents, controls and calibrators used for performing the tests belonged to the respective original equipment manufacturer. The IQC used was BIORAD for the equipments of SIEMENS whereas performance verifier specific to VITROS® 4600 was used on that equipment.
The data for 2016 for Dimension EXL 200 had 14 parameters in the EQA while VITROS® 4600 had 20 parameters in the EQA list. While comparing the results, the following parameters, albumin, triglyceride, chloride, AST, ALT, phosphorus and CPK were excluded as corresponding data for the duration of interest was not available.
Considering the data of parameters available, the following 14 analytes were compared: Glucose, urea, creatinine, total protein, total bilirubin, alkaline phosphatase, cholesterol, HDL cholesterol, iron, amylase, sodium, potassium, uric acid and calcium.
Daily Internal Quality Control (IQC) was performed on both the analysers and the records were maintained for the same. The mean results of the analytes on IQC on both analysers and Coefficient of Variation (CV) were well within the range given by the CLIA (Clinical Laboratory Improvement Amendments) guidelines.
The result of the EQA from the corresponding period was collected, and the VIS and SDI of each parameter given in the respective result sheets were analysed.
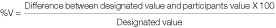
The VIS was calculated from the designated value, the participants’ value and the variation percentage (%V)
The SDI is calculated as:

Results
Of the 14 common parameters from the EQA, 06 (43%) parameters had VIS in the ‘very good’ category <100) on Dimension. On Dimension, 05 parameters (35%) had VIS in the ‘good’ category (100-150) and 02 (14.3%) in the ‘satisfactory’ and 01 parameter (7%) in the ‘not acceptable’ category. On VITROS® 4600, 10 (71%) parameters were in the ‘very good’ category, while the remaining 04 (29%) were in the ‘good’ category, as given in [Table/Fig-1].
VIS of all parameters in Dimension EXL 200 and VITROS® 4600.
| S No. | Analyte | Range of VI S (Dimension EXL 200) | Mean VI S (Dimension EXL 200) | Range of VI S (VI TROS® 4600) | Mean VI S (VI TROS® 4600) |
|---|
| 1 | Glucose | 4-332 | 84.0 | 31-279 | 121.2 |
| 2 | Urea | 13-400 | 91.2 | 11-54 | 28.2 |
| 3 | Creatinine | 18-245 | 119.0 | 25-169 | 79.2 |
| 4 | Total Bilirubin | 2-400 | 78.5 | 0-123 | 50.4 |
| 5 | Total Protein | 0-363 | 105.3 | 7-259 | 100.2 |
| 6 | Calcium | 4-209 | 121.8 | 6-284 | 124.8 |
| 7 | Uric acid | 18-342 | 153.5 | 0-25 | 11 |
| 8 | Cholesterol | 122-400 | 267.4 | 30-176 | 80 |
| 9 | HDL cholesterol | 29-400 | 147.5 | 18-124 | 63.4 |
| 10 | Sodium | 70-400 | 151.3 | 21-92 | 54.4 |
| 11 | Potassium | 8-400 | 103.2 | 19-135 | 91.6 |
| 12 | ALP | 1-245 | 61.4 | 8-81 | 42.8 |
| 13 | Amylase | 12-141 | 49.0 | 27-309 | 112.8 |
| 14 | Iron | 28-187 | 75.1 | 7-181 | 94 |
The SDI of the same parameters on both the equipments were similar with Dimension having 12 (86%) and VITROS® 4600 having 11 (79%) results in the ‘excellent’ category while each had a single parameter in the ‘accept with caution’ category with no parameter requiring any corrective action [Table/Fig-2].
SDI OF all parameters in dimension EXL 200 and VITROS® 4600.
| S No. | A nalyte | Range of SDI (Dimension EXL 200) | Mean SDI (Dimension EXL 200) | Range of SDI (VI TROS® 4600) | Mean SDI (VI TROS® 4600) |
|---|
| 1 | Glucose | 2.43 to -3.77 | 0.4 | 0.5 to 3.3 | 1. 8 |
| 2 | Urea | 1.28 to -5.64 | -0.3 | 0.27 to 1.12 | 0.5 |
| 3 | Creatinine | 1.35 to -1.12 | 0.7 | -1.18 to 1.9 | 0.5 |
| 4 | Total Bilirubin | 9.6 to -1.46 | 0.8 | -0.1 to 1.8 | 0.6 |
| 5 | Total Protein | 2.25 to -1.11 | -0.2 | 0.3 to 2.9 | 1.2 |
| 6 | Calcium | 0.96 to -1.17 | -0.1 | 0.06 to 4.31 | 1.7 |
| 7 | Uric acid | 0.12 to -1.2 | -0.6 | -0.27 to 0.45 | 0 |
| 8 | Cholesterol | 1.4 to -4.5 | -1.6 | -1.84 to 0.59 | -0.4 |
| 9 | HDL cholesterol | 3.36 to -0.79 | 0.6 | 0.2 to 1.37 | 0.7 |
| 10 | Sodium | 0.58 to 4.53 | 1.3 | -0.78 to 0.69 | 0.1 |
| 11 | Potassium | -0.06 to 1.8 | 0.7 | 0.13 to 1.33 | 0.8 |
| 12 | ALP | -0.01 to 1.4 | 0.1 | -0.96 to 0.73 | -0.2 |
| 13 | Amylase | -0.08 to 0.8 | 0.3 | -3.11 to 1.21 | -0.6 |
| 14 | Iron | -1.12 to 1.87 | 0.3 | -1.94 to 0.95 | -0.8 |
The number of parameters in the EQA in both the chemistry analysers was different with 15 in Dimension. Chloride was the only parameter from 2016 that was not included in 2017 in the EQA. Similarly in VITROS® 4600, the following parameters of albumin, triglyceride, AST, ALT, phosphorus and CPK were not included in the present study for comparison.
The overall VIS for the Dimension had 07 parameters (46.7%) VIS (<100) ‘very good’, 05 (33%) VIS (100-150) ‘good category’, 02 (13%) VIS (151-200) in satisfactory and 01 (07%) parameter had VIS (>200) ‘not acceptable’ category as shown in [Table/Fig-1].
The overall VIS for the VITROS® 4600 was had 15 parameters (75%) had VIS (<100) ‘very good’, 04 (20%) had VIS (100-150) ‘good category’, 01 (13%) had VIS (151-200) in satisfactory’ category [Table/Fig-3].
Comparison of VIS between Dimension EXL 200 and VITROS® 4600.
| S No. | VI | Dimension | VITROS® 4600 |
|---|
| 1 | Very good (<100) | 46.7% (n=07) | 75% (n=15) |
| 2 | Good (100-150) | 33.3% (n=05) | 20% (n=04) |
| 3 | Satisfactory (151-200) | 13.3% (n=02) | 5% (n=01) |
| 4 | Not acceptable (>200) | 6.7% (n=01) | Nil |
The results from the IQC from VITROS® 4600 on its performance verifier and Dimension EXL 200 on BIORAD QC material is as per [Table/Fig-4]. The IQC from the same period shows the CV% as to be within the CLIA guidelines [4].
Comparison of internal quality control between dimension EXL 200 (SIEMENS) and VITROS® 4600 (Orthoclinical Diagnostics).
| Analyte | Dimension EXL 200 | VITROS® 4600 | CV % (CLIA) |
|---|
| Actual mean | Observed mean | CV % | Actual mean | Observed mean | CV % |
|---|
| Glucose (mg/dL) | 90.2 | 89 | 1.64 | 85.88 | 87.64 | 2 | Target value ±6 mg/dL |
| BUN (mg/dL) | 14 | 14 | 3.02 | 20.3 | 20.4 | 1.3 | Target value ±2 mg/dL |
| Creatinine (mg/dL) | 2.53 | 2.6 | 2.83 | 1.83 | 1.76 | 3 | Target value ±0.3 mg/dL |
| Total Bilirubin (mg/dL) | 1.18 | 1.2 | 4.98 | 1.73 | 1.73 | 5.9 | Target value ±0.4 mg/dL |
| Total Protein (gm/dL) | 6.82 | 6.8 | 2.15 | 3.87 | 3.81 | 2.4 | Target value ±10% |
| Calcium (mg/dL) | 8.09 | 8.5 | 5.93 | 8.07 | 8.12 | 0.8 | Target value ±1.0 mg/dL |
| Uric acid (mg/dL) | 4.3 | 4.1 | 2.03 | 3.9 | 3.91 | 1.4 | Target value ±17% |
| Cholesterol (mg/dL) | 251 | 238 | 2.35 | 149.6 | 147.9 | 1.4 | Target value ±10% |
| HDL cholesterol (mg/dL) | 46.08 | 45 | 2.65 | 46.6 | 47 | 1.3 | Target value ±30% |
| Sodium (mEq/l) | 139 | 143 | 1.91 | 121.7 | 122.1 | 0.7 | Target value ±4 mEq/l |
| Potassium (mEq/l) | 3.85 | 3.9 | 3.28 | 2.98 | 2.9 | 0.7 | Target value ±0.5 mEq/l |
| ALP (IU/L) | 115 | 113 | 3.04 | 105.4 | 109.5 | 1.6 | Target value ±30% |
| Amylase (IU/L) | 80.4 | 81 | 1.64 | 81.42 | 82.98 | 3.4 | Target value ±30% |
| Iron (μg/dL) | 249 | 244 | 2.38 | 79.3 | 79.4 | 5.4 | Target value ±20% |
Discussion
In any EQA, the participating laboratories are sent aliquots of pooled serum samples and the nominated parameters are performed on the sample and the results submitted to the agency performing the EQA for the statistical analysis of the results. EQA programmes were introduced as it was observed that when aliquots of the same sample were analysed in different laboratories, it was common to have different results. Then the measurement methods and calibration procedures followed by each centre were different and exclusive, hence the variation in the results. Commutability of the EQA sample with clinical patient samples is the single most important concept in the design of the EQA [6-9]. In 2011, the EQA was classified into six categories depending on their ability to verify the standardisation of the participating measurement procedures [10]. The choice as to which particular EQA programme is to be followed has also been studied with authors comparing results from different EQA programmes showing variable results [11]. The steps to be taken by the participating laboratory in handling of the EQA sample and how to choose which specific EQA programme has been studied [12]. The design followed by a particular EQA programme regarding the quality specifications of the control materials and the statistical procedure followed to assess the laboratory performance have a significant impact on the result of the EQA [13,14].
The impact of EQA apart from the standardisation process can also be immense in the post analytical phase steps by using the proper unit of measurement, rounding off and the use of proper decimal points in reporting of the results [15].
EQA programmes catering to a single parameter are also available and have stricter criteria as shown by Elisabet GL et al., in a study of 89 laboratories for serum creatinine, only the laboratories using enzymatic creatinine had results in the acceptable range [16]. The WHO has recently issued the ISO 13528:2015 as a guideline for the use of statistical methods for EQA providers [17]. The recent importance of statistical processes in improving the EQA protocols has also been highlighted by Barbara DS et al., [18]. The importance of the pre and post analytical stages on the reporting of results is also important as different types of EQA catering to pre and post analytical errors are also available [19].
Our centre has been enrolled in the EQA programme run by CMC Vellore for the clinical chemistry section for more than a decade. The EQA samples are received once every quarter and the results are uploaded on the EQA website before the 20th of each month. The results for the same are released on the 2nd working day of each month. The proper method was selected for the particular parameter on the website of the EQA so that the results could be assessed in a proper manner. For 2016, the Dimension EXL 200, a wet chemistry system and its methods were registered in the EQA. VITROS® 4600, a dry chemistry system was introduced in the EQA in 2017.
All proper precautions were taken and procedures followed while performing the assays on the analysers. Of the 15 parameters that were analysed on Dimension, the result was not commendable as overall VIS was highly variable and multiple parameters were present in each category. The marked variability in the results of the Dimension analysers could be due to inherent factors associated with wet chemistry. Comparatively, the overall VIS for the VITROS® 4600 (20 parameters in EQAS) was excellent, with 95% results present in the ‘very good’ and ‘good’ categories. The difference in the VIS in the different analysers is significant as the same EQA programme had produced marked improvement when the sample was shifted from Dimension to VITROS® 4600. Of the 14 common parameters in the EQA, 10 (71.4%) parameters (urea, creatinine, total bilirubin, cholesterol, uric acid, HDL cholesterol, alkaline phosphatase, total protein, sodium and potassium) had improvements in their VIS when shifted over from Dimension to VITROS® 4600. Calcium showed hardly any change in the VIS, whereas iron, amylase and glucose showed increasing VIS values. The parameters which showed an improvement in the VIS constitute more than 80% of the workload in any clinical chemistry laboratory.
The SDI of both the analysers showed very consistent results where no parameter required any corrective action to be taken.
The results from the same period of the IQC did not show any outlier parameter as per the CLIA guidelines. Of the 14 total parameters, the CV% was lesser in 8 parameters (BUN, calcium, cholesterol, HDL cholesterol, uric acid, sodium, potassium and alkaline phosphatase) on VITROS® 4600 as compared to Dimension EXL 200.
For the duration of the study, the results of the IQC were similar in both systems which prove that there were no significant random or systemic errors in the analytical systems. With this result in mind, it can be postulated that the improvement in the VIS results of the parameters may be due to the inherent advantages of a dry chemistry analyser over a wet chemistry analyser and has enabled us to validate results of the EQA sample at our level.
Conclusion
The VIS results from the VITROS® 4600 as compared to Dimension EXL 200 showed marked improvement with 71.4% parameters undergoing a reduction in the VIS values while the SDI results were mostly similar. Thus, EQA with CMC Vellore showed marked improvement when the methods were changed to those on VITROS® 4600.
[1]. Westgard JO, Internal quality control: planning and implementation strategiesAnn Clin Biochem 2003 40:593-611.10.1258/00045630377036719914629798 [Google Scholar] [CrossRef] [PubMed]
[2]. CLSIUsing proficiency testing to improve the clinical laboratory; approved guideline. CLSI document GP27-A2 2007 2nd EditionWayne (PA)CLSI [Google Scholar]
[3]. Miller WG, Jones GRD, Horowitz GL, Weykamp C, Proficiency testing/external quality assessment: current challenges and future directionsClinical Chemistry 2011 57(12):1670-80.10.1373/clinchem.2011.16864121965556 [Google Scholar] [CrossRef] [PubMed]
[4]. Burtis CA, Ashwood ER, Bruns DE, Tietz Textbook of Clinical Chemistry 2013 5th EditionSt LouisElsevier Sanders [Google Scholar]
[5]. Yadav R, Bhartiya JP, Verma SK, Nandkeoliar MK, External quality assessment scheme (EQAS): Our experience as a participating LaboratoryIJRRMS 2013 3(4):1-4. [Google Scholar]
[6]. Miller WG, Myers GL, Rej R, Why commutability mattersClin Chem 2006 52:553-54.10.1373/clinchem.2005.06351116595820 [Google Scholar] [CrossRef] [PubMed]
[7]. Vesper HW, Miller WG, Myers GL, Reference materials and commutabilityClin Biochem Rev 2007 28:139-47. [Google Scholar]
[8]. CLSI. Characterization and qualification of commutable reference materials for laboratory medicine; approved guidelineCLSI document C53-A. Wayne (PA): CLSI 2010 [Google Scholar]
[9]. International Organization for Standardization. In vitro diagnostic medical devices-measurement of quantities in biological samples-metrological traceability of values assigned to calibrators and control materialsISO 17511. Geneva: ISO 2003 [Google Scholar]
[10]. Jansen R, Jassam N, Thomas A, A category 1 EQA scheme for comparison of laboratory performance and method performance: An international pilot study in the framework of the Calibration 2000 projectClin Chim Acta 2014 432:90-98.10.1016/j.cca.2013.11.00324240021 [Google Scholar] [CrossRef] [PubMed]
[11]. Carobene A, Franzini C, Ceriotti F, Comparison of the results from two different external quality assessment schemes supports the utility of robust quality specificationsClin Chim Acta 2004 346(1):87-97. [Google Scholar]
[12]. James D, Ames D, Lopez B, Still R, Simpson W, Twomey P, External quality assessment: best practiceClin Chem Lab Med 2011 49(7):1143-49. [Google Scholar]
[13]. Sciacovelli L, Zardo L, Secchiero S, Plebani M, Quality specifications in EQA schemes: from theory to practiceClin Chim Acta 2004 346(1):87-97.10.1016/j.cccn.2004.02.03715234640 [Google Scholar] [CrossRef] [PubMed]
[14]. Sciacovelli L, Secchiero S, Zardo L, Plebani M, External quality assessment schemes: need for recognised requirementsClin Chim Acta 2001 309:183-99.10.1016/S0009-8981(01)00521-6 [Google Scholar] [CrossRef]
[15]. Ceriotti F, The role of external quality assessment schemes in monitoring and improving the standardization processClin Chim Acta 2014 432:77-81.10.1016/j.cca.2013.12.03224389052 [Google Scholar] [CrossRef] [PubMed]
[16]. Elisabet GL, Jorge DG, Zoraida C, Carmen R, Carmen P, Virtudes A, Category 1 external quality assessment program for serum creatinineAnn Transl Med 2017 5(6):133-41.10.21037/atm.2017.03.7028462213 [Google Scholar] [CrossRef] [PubMed]
[17]. WHO manual for organizing a national external quality assessment programme for health laboratories and other testing sites (2016). Available from: http://www.who.int/diagnostics_laboratory/en/ Accessed on December 21st 2016 [Google Scholar]
[18]. Barbara DS, Piet M, Annette T, Ana MS, Special issue on external quality assessment in laboratory medicine-current challenges and future trendsBiochemia Medica 2017 27(1):19-22.10.11613/BM.2017.00328392722 [Google Scholar] [CrossRef] [PubMed]
[19]. Kristensen GB, Aakre KM, Kristoffersen AH, Sandberg S, How to conduct external quality assessment schemes for the pre-analytical phase?Biochem Med (Zagreb) 2014 24:114-22.10.11613/BM.2014.01324627720 [Google Scholar] [CrossRef] [PubMed]