Standard automated perimetry is integral to the testing of visual function in glaucoma. In the initial tests, it detects and quantifies damage, and in follow-up of a diagnosed patient, it detects stability or progression of glaucomatous damage [1].
Classification of glaucomatous visual field defects and staging its severity is important for effective glaucoma management. This classification is utilized to distinguish between healthy and glaucomatous individuals, to adjust therapy on the basis of disease severity, to describe visual field conditions in a short and simple format, to monitor the progression of the disease, and to provide a common language for both clinical and research purposes [2]. More than 20 severity classification methods have been proposed since 1958 [3].
The staging systems commonly used in research are HPA classification, The Glaucoma Severity Staging System (GSS: this is HPA classification which has been modified by Mills RP et al.,), the Enhanced Glaucoma Severity Staging System (eGSS), the Advanced Glaucoma Intervention Study scoring system (AGIS) [2,4]. The classification systems used in research may be cumbersome and impractical on a daily basis in a busy glaucoma/ophthalmic practice. Availability of a simpler staging system is the need of the hour.
GSI has been introduced in the Humphrey Visual Field single field analysis reports. It is the visual field staging system devised by Vessani RM and Susanna R, at University of São Paulo, Brazil [1,5]. This is a staging system readily available on the print out and is dependent on the VFI to stage the fields into Early, Moderate or Severe damage.
Visual Field Index is a global index developed by Bengtsson and Heijl in 2008 as a new index intended to be less affected by cataract than the Mean Deviation (MD) [6]. It is expressed as a percentage of visual function; with 100% being a perfect age-adjusted visual field and 0% represents a perimetrically blind field. The pattern deviation probability plot (or total deviation probability plot when MD is worse than -20dB) is used to identify abnormal points and age corrected sensitivity at each point is calculated using total deviation numerical map. The central points are given more weightage and the mean of all points is expressed as a percentage i.e., the VFI.
The staging systems till date depend on analysis of various factors like Mean Deviation (MD), Pattern Standard Deviation (PSD), involvement of the central field, number and depth of depressed points on total or pattern deviation plots etc., [2]. The study aims to determine if VFI alone can be depended upon when staging a visual field, as seen in the GSI classification system. The study uses HPA staging for visual field tests comparing it with GSI based classification.
Materials and Methods
The study was a prospective, observational analysis of consecutive visual field tests done between August 2015 and March 2016 at the Glaucoma clinic of a tertiary eye care hospital. In accordance with the Declaration of Helsinki, the Ethics Review Board of the Institution approved the protocol, and visual fields of only those participants who gave written informed consent were included in the study. Patients underwent a comprehensive eye examination including visual acuity measurement, slit lamp evaluation, Intra Ocular Pressure (IOP) measurement, stereoscopic fundus evaluation and visual field evaluation. All participants underwent standard automated perimetry (Humphrey Visual Field Analyser II-i750-8786/5.0 and 745-40053/5.1.1, Carl Zeiss Meditec, Inc., Dublin, CA) using central 30-2 program and the standard Swedish Interactive Threshold Algorithm. Visual fields of all patients were included irrespective of their glaucoma diagnosis.
Visual fields were excluded from analysis if the participants had a history of intraocular surgery other than uncomplicated cataract, glaucoma or combined surgery, or if they had secondary causes of elevated IOP (e.g., iridocyclitis, trauma), other intraocular diseases affecting the visual field (e.g., retinal diseases/lesions), medications known to affect visual field sensitivity, neurological causes of visual field defects. All visual fields with poor reliability were also excluded from analysis. (Reliability was defined as less than 20% fixation losses and less than 33% for both false-positive and false-negative errors) [7].
Data was collected from each visual field which included the MD, Pattern Standard Deviation (PSD), Visual Field Index and also patient demographic details. Each visual field was graded using HPA classification system into four stages- Normal, Early defect, Moderate defect or Severe defect [8]
Staging of visual fields in GSI was noted from the visual fields [1,5]. This staging is readily available on the visual field printout and does not require additional calculations. The GSI Staging System is divided into three parts. The first part defines the visual field defect as Early (E), Moderate (M) or Severe (S) according to VFI. The second part reports if the defect is located outside 10 degrees of the visual field (10+), between 5 and 10 degrees (10) or inside 5 degrees of the visual field (5). The third part describes if the visual field defect is located in only one hemifield (1) or in both hemifields (2) and if it connects to the blind spot (B) or not (A) depending on points depressed below 0.5% level on the pattern deviation probability plot. For example, E96/10+/1A would mean an Early defect with VFI 96%, with visual field defect outside the central 10 degrees, with one hemifield involvement which is not connected to the blind spot.
Statistical Analysis
All statistical analyses were done with SPSS (IBM Corp. IBM SPSS Statistics for Windows, Version 22.0.). From a pilot study it was determined that 18 visual fields were adequate in each of the severity groups for 90% Power of the study with confidence interval 95%. Independent t-test was used for comparison of means between groups and ANOVA for comparison between multiple groups. Correlation analysis determined relationship between global indices. Kappa statistical analysis was conducted to determine the degree of agreement between two classification systems. A p-value less than 0.05 were taken as statistically significant.
Results
One hundred and seventy visual fields of 95 patients were included in the study. Forty patients were women (42.1%) and 55 were men (57.9%). The mean age of all the participants was 65.95±14.06 years.
Based on HPA classification of visual field damage, the Normal group had 41 eyes, the Early defect group 30, the Moderate defect group 36, and the Severe defect group 63. The VFI compared between groups using ANOVA was seen to be significantly different (p<0.001). On comparison of mean VFI values between Normal and Early groups, Early and Moderate groups, Moderate and Severe groups, all were seen to be statistically significantly different at p<0.001.
[Table/Fig-1] depicts the Mean±standard deviation of VFI, MD and PSD among the groups and their significance. It was determined that the MD and PSD were also significantly different among the groups, using ANOVA.
Mean Visual Field Index (VFI), Mean Deviation (MD) and Pattern Standard Deviation (PSD) among the groups as per Hodapp Parrish Anderson (HPA) classification.
| Parameters | Normal | Early Defect | Moderate Defect | Severe Defect | p-value |
|---|
| VFI | 98.49±1.86 | 94.63±2.95 | 84.08±7.23 | 47.44±25.82 | p<0.001 |
| MD | -0.89±1.59 | -2.96±1.56 | -6.61±2.31 | -17.70±7.95 | p<0.001 |
| PSD | 2.53±1.09 | 4.91±2.07 | 7.99±2.42 | 10.36±3.38 | p<0.001 |
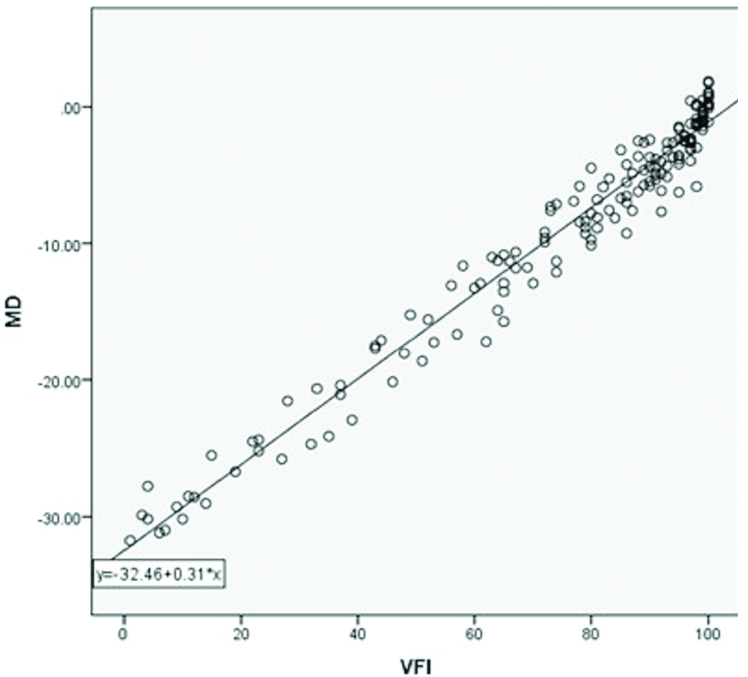
Overall a strong positive correlation was found between VFI and MD with Pearson correlation coefficient (r) being 0.984 (p<0.001) [Table/Fig-2]. Good correlations between VFI and MD were found in groups with Normal, Early or Moderate defects (r-values being 0.743, 0.703 and 0.695 respectively) and excellent positive correlation was seen in the group with severe visual field defect (r = 0.977).
Correlating VFI with MD, r=0.984, p<0.001.
MD: Mean deviation
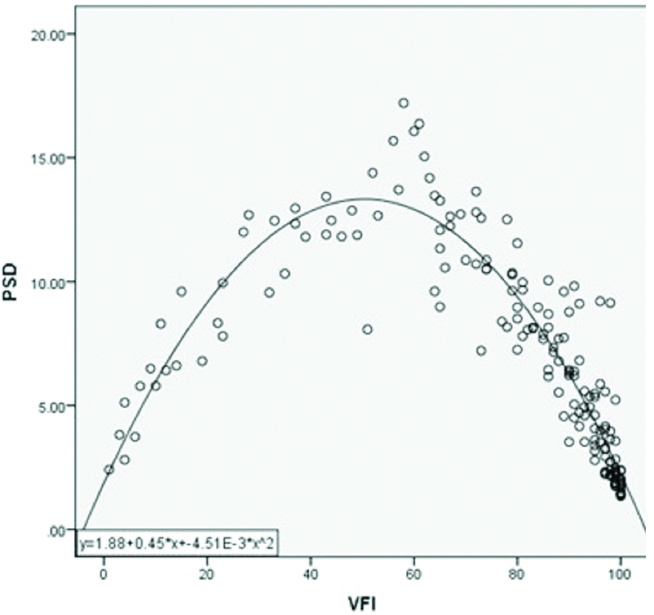
A significant negative non-linear correlation was seen between VFI and PSD (r=-0.472, p<0.001) [Table/Fig-3]. On further analysis of VFI with PSD within individual groups, it was seen that the group with moderate visual field defect showed a strong negative correlation with r= -0.777, the Normal and Early defect groups showed average negative correlations of r-values of -0.682 and -0.483 (p= 0.007) respectively. The severe defect group showed a positive correlation of r-value 0.504. All except early group showed significant correlation at p<0.001.
Correlating VFI with PSD, r= -0.472, p<0.001.
PSD: Pattern standard deviationwith
Using the Glaucoma Staging Indices, the fields were graded into “Normal” in 26 eyes, “Early defect” in 45 eyes, “Moderate defect” in 39 eyes and “Severe defect” in 60 eyes. There exists a strong agreement between HPA and GSI staging systems as seen by a Kappa value of 0.633, p<0.001.
From [Table/Fig-4], it is seen that some amount of overlap of cases exist between the two classification systems. The 15 of visual fields classified as Early defect by GSI were Normal by HPA classification [Table/Fig-5]. Similarly among those classified as Moderate defect by GSI, 11 had severe defect on HPA classification. Eight of those classified as Severe defect by GSI had Moderate defect in HPA classification.
Comparison between Hodapp Parrish Anderson (HPA) and Glaucoma Staging Indices (GSI) classification systems, κ =0.633, p<0.001.
| GSI classification | Total |
|---|
| Normal | Early | Moderate | Severe |
|---|
| HPA Staging | | Normal | 26 | 15 | 0 | 0 | 41 |
| Early Defect | 0 | 24 | 6 | 0 | 30 |
| Moderate Defect | 0 | 6 | 22 | 8 | 36 |
| Severe Defect | 0 | 0 | 11 | 52 | 63 |
| Total | | 26 | 45 | 39 | 60 | 170 |
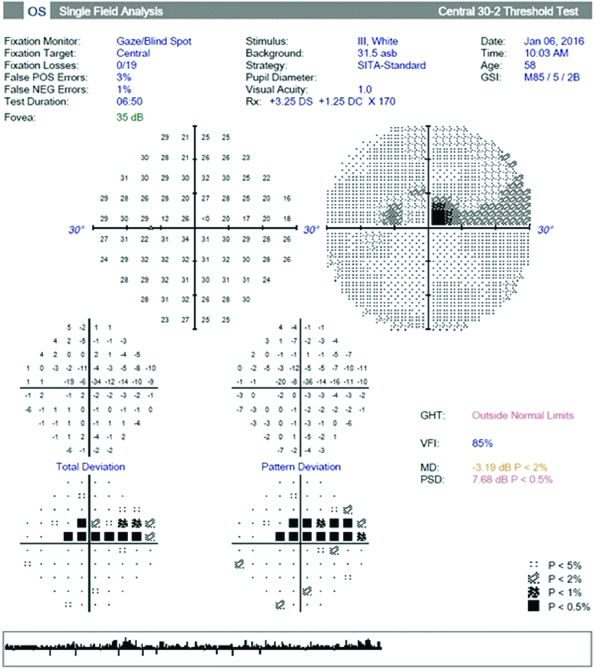
Visual field showing zero sensitivity in the central five degrees of the field and hence classified as a severe defect by HPA classification but is a moderate defect based on GSI classification.
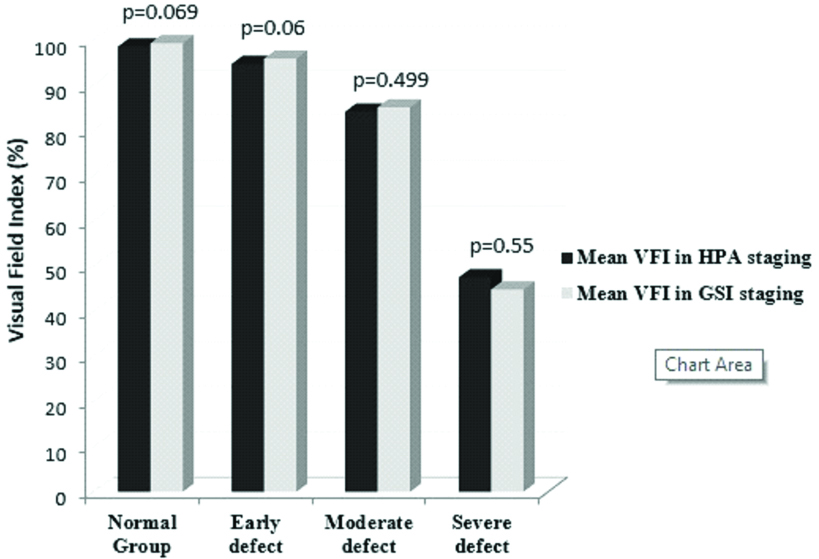
Comparison of VFI across severity stages between the two classification systems.
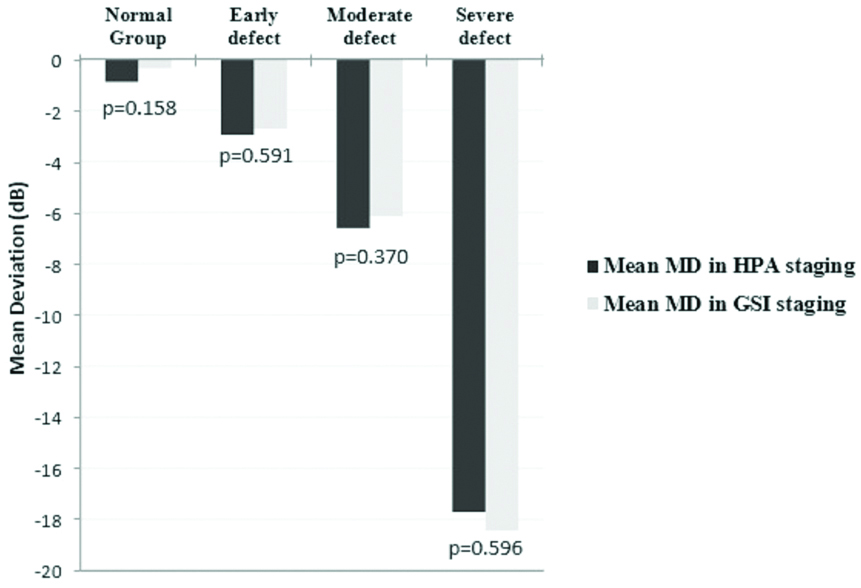
Comparison of MD across severity stages between the two classification systems.
Comparison of Pattern Standard Deviation (PSD) across severity stages between the two classification systems.
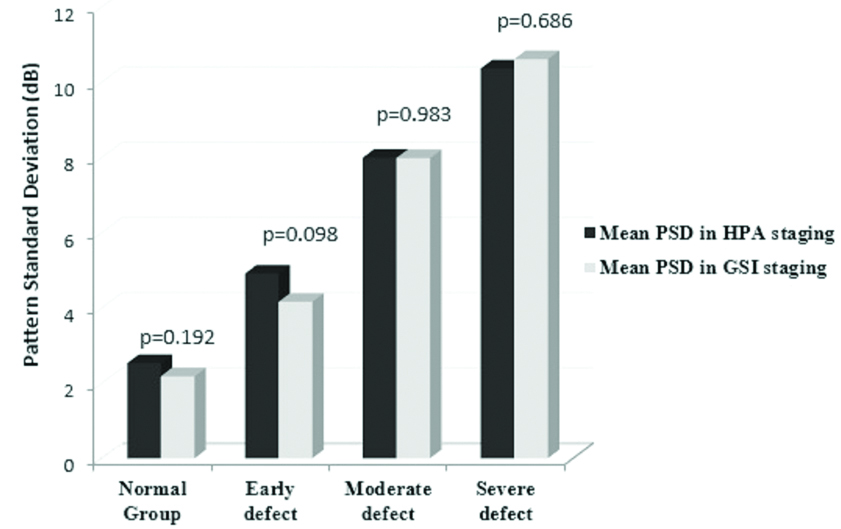
We compared the VFI, MD and PSD for visual fields in each of the severity stages across the two classification systems. Using Independent samples t-test it was found that there were no significant differences in any of the global indices (p>0.05) within each severity group, between HPA and GSI classifications. This is evident from [Table/Fig-6,7 and 8].
Discussion
Of the various visual field classification systems, the HPA is most commonly used in clinical studies [2]. HPA is time consuming and needs analysis of individual fields, whereas GSI is readily available on the single field printout. GSI depends on VFI to make the distinctions between groups of varying visual field damage severity. In the present study we sought to evaluate the agreement between these two staging systems.
In the initial part of present study, we analyzed the VFI values in each of the stages of visual field damage as classified by HPA. VFI values were found to be significantly different in each of the glaucoma severity groups. No studies in current literature have established the significant difference of VFI in different stages of glaucomatous field damage [2,3]. Even though an overlap of VFI values were seen across different stages, it was not statistically significant.
On further analysis it was seen that VFI correlated well, in a positive linear fashion with MD. This correlation was greatest in the severe stage compared to the other stages. We also noted that there were 13 eyes with VFI of 100% and the MD of these eyes ranged widely from 1.88 to -1.14dB. This is possibly due to the ceiling effect of VFI noted in near normal studies and has been previously reported [9,10]. This advises us to exercise caution when trying to differentiate early glaucomatous fields from normal.
In the study by Artes HP et al., it was seen that in eyes with MD better that -5dB, the VFI was close to 100% and suggested that VFI may underestimate the rate of change in eyes with initially normal visual fields that are developing glaucomatous damage [9]. Marvasti AH et al., have reported that the relationship between VFI and estimated retinal ganglion cell counts is nonlinear and the index substantially underestimates the amount of neural loss early in the disease [11].
PSD is known to increase in the initial stages of glaucoma as visual field damage worsens, but after reaching a certain point where there is severe damage and generalized involvement of the visual field, the PSD once again starts decreasing [10]. As expected, in our study, VFI correlates negatively with the PSD in the initial stages of glaucoma and as the visual field damage advances, a positive correlation is seen in the severe stages of glaucoma.
Overall, with these findings we were able to establish that VFI agreed well with the HPA classification system and was a dependable variable to base a visual field severity staging on, except in normal/early cases.
In the present study it was seen that there is a large amount of overlap of VFI values at each adjacent HPA staging group. Vessani RM and Susanna R, had taken this into consideration and preferring to err on the side of classifying a field defect as more severe than less, the higher limits of VFI in each group were taken as cut off points [5]. The cut off for VFI between severe and moderate stages was 78%, between moderate and early was 91%. Significantly, they did not devise a cut-off point between early and normal visual fields. This accounts for the remarkable number of eyes staged as Early defect by GSI staging, and were found to be Normal by the HPA classification (15 eyes i.e., 33%).
In the present study, 11 out of 39 (28.2%) fields classified to be moderate by GSI, had severe defect on HPA classification. Nine of these 11 eyes had VFI ranging from 78%-81%. In the present study, on classifying the visual fields based on HPA staging, showed that the 95th percentile VFI values were 81%, 93.3% and 98.45% for the Severe, Moderate and Early stages respectively. This suggests GSI underestimates the visual field defect in comparison to HPA. And the remaining two severe cases under-classified as moderate by GSI, they had VFI of 85% but had points with zero sensitivity in the central five degrees of the field [Table/Fig-3]. Classification of fields based on VFI alone is likely to miss out on early central field depressions. GSI overcomes this pitfall with the second part of its scale where a mention is made about the degree of central field involvement.
Comparison of global indices at all stages between HPA and GSI staging systems did not show any significant difference. Ng M et al., have compared global indices between AGIS, eGSS and GSS; and found that only AGIS and eGSS were comparable [3]. In the present study, all indices including VFI values were comparable between HPA and GSI systems. Till date, no study has made this comparison between these two classification systems.
When compared to GSI classification system, HPA is time consuming and needs analysis of individual fields. HPA with its broad classifications may not be appropriate for analysing stability or progression over time, whereas GSI includes the VFI which can be utilized for progression evaluation [12]. HPA takes into account number and depth of defective points and its relation to fixation but GSI gives additional information about the location of the defect and its relation to the blind spot [1,5].
It is established that with higher severity of visual field defect, the disability increases [13,14]. As per HPA even a single point in central five degrees with 0dB sensitivity is classified as a severe defect, but this may not have a greater vision related disability for the patient. This needs to be evaluated in future studies wherein quality of vision and life or activity limitation can be evaluated with regard to VFI and visual field grading systems [15,16]. If the HPA staging is overestimating the severity in such cases, GSI may be a more relevant classification.
VFI is a reliable index on which glaucomatous visual field severity staging can be based. In the early stages of the disease, it is fallacious to depend on VFI to make a diagnosis of glaucoma, and it is still left to the treating doctor to make a clinical judgement. In the latter stages, GSI tends to underestimate the severity of visual field defect with reference to HPA classification system. Overall, once glaucoma has been established, GSI is a good dependable glaucoma severity staging system. It is readily available on the single field print out and can be a quick reference for decision making in the management of glaucoma patients.
Limitation
One drawback of the study is that there is no single established gold standard for grading visual fields and we have studied GSI with reference to only one classification system. Additionally, this being a cross sectional study, we have not assessed change with time using these classification systems. A limitation that may be faced is that the GSI classification may not be printed on the single field report, when test is done on a machine without the required software.
Conclusion
VFI is reliable in staging visual field damage except in early stages of glaucoma. GSI is a dependable visual field severity staging system once a clinical diagnosis of glaucoma is established.