Cataract extraction and IOL implantation is one of the most frequent and successful ophthalmic surgical procedures today [1]. Visual outcomes and spectacle independence postoperatively are however dependant on accurate IOL power calculations. The data required for accurate IOL calculations include AL, corneal curvature and anterior chamber depth which are integrated in calculation formulae [2]. Of these, AL measurement is considered to be the most crucial determinant in accurate calculation of the power of the IOL to be implanted [2,3].
The advent of OB devices has improved the accuracy of AL measurement compared to US biometry [4,5]. OB measurements have been found to be operator independent with less measurement variation [6]. Moreover, excellent repeatability [7] and better postoperative refractive outcomes [5] have been reported with OB. OB devices are based on principles of partial coherence interferometry or optical low coherence reflectometry. They are non contact instruments with higher speed and accuracy with a resolution upto 0.01 mm [8]. US biometry on the other hand is operator dependent, requiring corneal contact which may lead to false reading due to indentation of the cornea apart from being a potential source of infection [9]. It is also dependant on the exact axial placement of the probe. The resolution of A-scan US has been reported to be up to 0.15 mm and the accuracy is reported to be 70 to 150 μm [9,10].
OB is however, not possible in eyes with dense cataract and in patients with poor fixation as in macular diseases [5]. In such patients, AL can be measured by US biometry alone. Moreover, in low income settings US biometry is still the most economical and the widely available choice. In our institution, before the acquisition of Nidek AL scan optical biometer, all AL measurements were routinely done using the AL 4000 US biometer (Tomey, Nagoya, Japan) with good postoperative refractive outcomes. The AL Scan (Nidek Co., Ltd., Gamagori, Japan) optical biometer also has the provision of a built in US biometer which can be used in patients in whom OB is not possible. Since there was limited data on the AL measurements as obtained by the built-in US biometer of the Nidek AL scan, this study was undertaken to compare the AL measurements by OB and US biometry as measured by Nidek AL scan. In order to ascertain whether these devices could be used interchangeably, our objective was also to compare these values with AL values obtained by the currently in use Tomey AL 4000 US biometer in our institution.
Materials and Methods
A non-interventional cross-sectional observational study was conducted at the Department of Ophthalmology of a Tertiary Eye Care Centre in February and March 2015. Patients with immature cataract scheduled for surgery who were referred by the treating ophthalmologist to the investigation room for biometry and who met the inclusion criteria were invited for the study.
Inclusion criteria: 1) Patients aged 18 years and above; 2) Patients with immature cataract scheduled for cataract surgery.
Exclusion criteria: 1) OB not possible due to dense cataract; 2) Patients unable to fixate the eyes due to macular disease, nystagmus, poor vision; 3) High myopia ≥-6.00 D sphere; 4) AL >25 mm; 5) Ocular conditions like retinal detachment, dense sub-hyaloid haemorrhage, silicone oil in the eye which could affect AL measurements.
Patients who met the inclusion criteria and were willing to participate in the study were enrolled in the study after informed consent. OB was first performed using Nidek AL scan biometer by an experienced optometrist (JM) with over 8 years experience to reduce the chances of variation in measurements. The Nidek AL OB Scan takes 6 readings of the AL and gives the final average result. The readings were noted by another optometrist posted in the investigation room and the optometrist measuring the ALs was blinded to the readings.
After anaesthetising both the eyes with topical proparacaine hydrochloride (0.5%), the patient was asked to fixate at a distant target and the same experienced optometrist measured the AL of the patient with the US probe of the Nidek AL scan biometer. The Nidek AL US takes 10 readings of the AL and displays the final average reading.
The patient was then asked to wait for 5 minutes so that the effect of indentation produced by the US probe was nullified and the cornea returned to its normalshape. After 5 minutes, both the eyes were re-anaesthetised with topical proparacaine hydrochloride (0.5%) and with the patient fixating at a distant target; the AL was measured by US biometry with Tomey AL 4000 by the same experienced optometrist. The displayed final AL which is the average of 10 AL readings measured by the machine was recorded. For all the three procedures, in order to blind the optometrist to the AL values, the display monitor was covered and the readings were noted by another observer.
AL of both the eyes of each patient was measured as a routine and based on the inclusion and exclusion criteria, either one eye or both eyes were included for the analysis.
Sample Size Calculation
Based on Bai QH et al., the expected mean difference of AL (mm) between the IOL master (Optical biometer) and US methods was 0.56 with standard deviation of 0.34 [11]. We obtained a sample size of 47 for an absolute precision of 0.1 at 95% Confidence interval. To compensate for patient attrition and exclusion we fixed the sample size as 60.
Statistical Analysis
Axial length measurements were measured in millimetres. Data was summarised as mean AL, standard deviation, mean difference, minimum and maximum values.
Interclass Correlation (ICC) was used to find the degree of agreement between the three methods. The maximum likelihood of the agreement and consistency of the methods were given by Bland Altman plots along with Limits of Agreement (LoA) and Lin’s Concordance Correlation Coefficient (CCC). The proportion of eyes in which the measurement was more than 0.3 mm as compared to the Nidek OB values was determined.
The data were entered in Microsoft excel and analysed using STATA 13.1 I/C.
Results
Ninety-eight eyes of 60 patients were included in the study. The mean age of the patients was 62.45±8.75 years and there were 29 females. The mean ALs measured by the three instruments were 23.08±0.81 mm by the Nidek AL OB, 23.24±0.89 mm by the Nidek US A-Scan and 22.97±0.79 mm by the Tomey US. The maximum, minimum, mean differences as well as agreement analysis results are shown in [Table/Fig-1].
Comparison of agreement within different devices.
| Device | Maximum difference (mm) | Minimum Difference (mm) | Mean Difference (mm) | SD | ICC (95% CI) | CCC | Bland Altman Analysis LoA |
|---|
| Nidek AL OB vs Tomey US | 0.69 | 0 | -0.11 | 0.15 | 0.98 (0.95, 0.99) | 0.973 | -0.40, 0.19 |
| Nidek AL OB vs Nidek AL US | 2.33 | 0 | 0.16 | 0.44 | 0.92 (0.87, 0.95) | 0.85 | -0.70, 1.04 |
| Nidek AL US vs Tomey US | 2.25 | 0 | -0.27 | 0.4 | 0.91 (0.77, 0.96) | 0.841 | -1.06, 0.53 |
SD: Standard deviation; ICC: Intraclass correlation coefficient; CCC: Concordance correlation coefficient; LoA: Limits of agreement
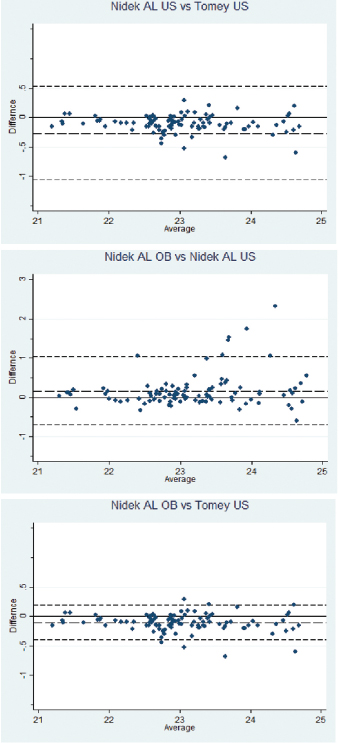
The highest agreement was seen between the Nidek AL OB and Tomey US, ICC=0.98, 95% CI (0.95, 0.99). Though there 2was excellent agreement in AL measurements between all three devices the 95% CI were much wider between the other two pairs [Table/Fig-1]. Similarly, Lin’s CCC showed the highest concordance between Nidek AL OB and Tomey US. The Bland Altman analysis agreementshowed good agreement between all three machines, however the agreement was closest between the Nidek AL OB vs. Tomey US (-0.40, 0.19) [Table/Fig-2]. The ICC and concordance correlation also indicated high agreement between Nidek AL OB vs. Tomey US compared to others, which is supported by LoA constructed [Table/Fig-1,2].
Bland Altman Plots showing agreement analysis for axial length measurements between the three devices. Mean difference in axial length between the two devices is represented by the wider hashed lines; the finer hashed lines represent the limits of agreement (±2 SD).
Though statistically, measurements with all three devices showed good agreement, we looked at the data from a clinical perspective [Table/Fig-3]. Comparing AL values between the Nidek AL OB and Tomey US, difference of 0.3 mm or greater, corresponding to one dioptre or more difference, was found only in 6 (6.1%) eyes and in none of these was the difference greater than 1 mm. However, while comparing AL values between Nidek AL OB and Nidek AL US group, 20 (20.4%) eyes had more than 0.3 mm difference which translates to more than 1 dioptre difference in postoperative refraction. Of these, 7 (7.1%) eyes had more than 1 mm AL difference with AL being overestimated by as much as 2.3 mm in one eye by Nidek AL US as compared to Nidek AL OB.
Comparative clinically significant Axial length difference (mm) between the three devices.
| Axial length difference (mm) | Nidek AL OB Vs Tomey US N (%) | Nidek AL OB Vs Nidek AL US N (%) | Nidek AL US Vs Tomey US N (%) |
|---|
| 0-0.09 | 38 (38.8%) | 37 (37.8%) | 26 (26.5%) |
| 0.1-0.3 | 54 (55.1%) | 41 (41.8%) | 45 (45.9%) |
| >0.3-0.99 | 6 (6.1%) | 13 (13.3 %) | 20 (20.4%) |
| 1 or >1 | 0 | 7 (7.1%) | 7 (7.1%) |
Discussion
All measurements in the present study were done by a single experienced optometrist (JM) to avoid variation due to difference in experience as reported by Goel S et al., and to avoid interobserver variation [6]. The optometrist conducting the measurements was further blinded to the final AL measurement readings to eliminate measurement bias.
In the present study, the Tomey US biometer measurements tended to mildly underestimate the AL as compared to OB measurements using Nidek AL OB. This finding is similar to other authors [9,11,12]. In a study on 137 eyes of 121 patients, Bai QH et al., reported mean AL values of 24.37±3.04 mm and 23.81±2.83 mm by OB by IOL master and US A scan (Digital 2000 Alcon) respectively [11]. The mean inter-device difference reported by them was 0.56±0.34 mm, which is higher than that obtained between any of the devices in the current study [Table/Fig-1]. Aktas S et al., also reported higher AL readings by the Nidek AL-scan as compared to Echo Scan US-800 [13]. Their average inter-device difference was 0.06±0.18 mm which is lower than the inter-device difference seen in present study. Mean AL differences by the two US devices in present study were similar to those reported by Rose LT and Moshegov CN. The mean difference in their study was 0.15±0.26 mm [12]. Shorter measurements by the applanation US method have been attributed to corneal indentation during the procedure causing shorter readings. Moreover, the US A scan measures AL from the corneal surface to the internal limiting membrane while the optical biometer measures up to the retinal pigment epithelial layer leading to longer readings [9,14].
The built in US biometer of Nidek AL Scan however, tended to overestimate AL as compared to Nidek AL scan OB in present 3study. Similar to this Nakhli FR reported longer ALs with US [15]. This result was attributed to US measurements made on the anatomic axis, through the centre of the cornea and OB measurements made on the visual axis as visual axis is shorter than anatomic axis, it is postulated that OB measurements read shorter AL compared to US measurements [14]. We could not attribute any plausible cause for the longer AL measurements obtained with Nidek US apart from possible machine related parameters since the measurements by the Tomey US were shorter. However the study was conducted after calibrating the US biometers. There was excellent agreement between the Nidek AL OB and the Tomey US measurements in present study [Table/Fig-1]. Similar results were obtained by Nakhli FR between the IOL master and the A scan 1000 in a study in 68 eyes on 55 patients [15]. They reported ICC of 0.994 (p<0.0001; 95% CI: 99.0-99.6%) between the two devices. Rose LT and Moshegov CN (2003) [12] reported a similarly correlation coefficient of 0.98 (p<0.001) while studying AL measurements in 51 eyes of 46 patients using the IOL master and the Alcon Ocuscan applanation US. On comparing AL measurements using the Nidek AL -Scan with UB (Aviso A/B, Quantel Medical, MT, USA), Çağlar C et al., reported clinically significant differences (95% LoA=–0.091 to 0.703) [16].
In the current study, this agreement between the Nidek AL OB and Tomey US also held even when considered from a clinical perspective. A difference of 0.3 mm or greater in ALs measurements between Tomey US measurements and Nidek AL OB measurements, was found only in 6 (6.1%) eyes and all values were less than 1 mm. On comparing individual values in the Nidek AL US group as compared to Nidek AL OB, 20 eyes had more than 0.3 mm difference which translates to more than 1 dioptre postoperative refractive difference. Of these 20 eyes, 7 eyes had more than 1 mm difference which would translate to more than 3D postoperative refraction which is clinically unacceptable. In one eye, the AL was overestimated by as much as 2.3 mm by Nidek AL US as compared to Nidek OB which translates to as much as 7 dioptres of postoperative refraction difference. The 7 outliers in AL measured by the Nidek AL US scan were in eyes with AL in the range of 21.8 to 23.70 mm as measured by OB.
There was a wide variation (mean=0.26 mm, range= 0 to 2.33 mm) in measurements with Nidek AL US as compared to the Nidek OB. The variation (mean=0.14 mm, range= 0 to 0.69 mm) was lesser and within clinically acceptable levels with the Tomey AL. By all measures of agreement there was excellent correlation between the Tomey US and Nidek OB and the AL difference was within clinically acceptable range in all patients. To the best of our knowledge there are no reports of agreement analysis between devices used in the current study.
Though OB has emerged as a gold standard in AL measurements with better predictive values and reliability [5,12,17]. Other authors have reported no significant clinical advantage over applanation US [18,19]. The present study also demonstrated high agreement between the Tomey applanation US and the Nidek AL OB. In daily practice this points to the fact that US based AL measurement scan may be used confidentially in the hands of an experienced examiner to get results comparable to the gold standard of OB. This is of special significance in patients where OB is not possible or in low resource settings there optical biometers may not be easily available. It is also advisable to conduct agreement and comparative analysis whenever a new machine is acquired. As shown by this study we found lower agreement as well as clinically unacceptable differences within the US and OB of the same machine and one cannot presume agreement even if the two measurements are done by the same machine. Therefore, all newly acquired devices should undergo agreement analysis and recalibration if required. This is even more relevant in centres with multiple surgeons doing high volume surgery as in such a setting following up on individual refractive outcomes of all cases may not be feasible. Therefore agreement analysis of all newly acquired devices with the already established devices should form part of the quality management practice.
Finally, even though optical biometers are becoming more popular optometrist training should continue to also build on skills and experience in US biometry which will continue to play a role in biometry for mature cataracts and in low resource settings.
Limitation
In eyes where there was large variation in measurements between the methods, biometry was not counter checked by another experienced optometrist.
Conclusion
There was excellent correlation of AL measurements between the Nidek AL OB and Tomey US in the hands of an experienced optometrist. The built-in Nidek US however tended to overestimate AL to clinically unacceptable levels. Present data collected in the study did not show any trend to overestimation occurring in long or shorter eyes. Continued measurements with the three devices along with counterchecking by a second experienced optometrist when differences >0.3 mm are detected and analysis of the data may help in detecting the possible cause for the same.
SD: Standard deviation; ICC: Intraclass correlation coefficient; CCC: Concordance correlation coefficient; LoA: Limits of agreement