Osteoporosis is a silent, slowly progressive systemic metabolic bone disease that leads to bone mineral microarchitecture deterioration resulting in Bone Mineral Density (BMD) decrease and in fragility fracture [1,2]. Although osteoporosis is a frequent disease, it is often undiagnosed and the consequent fractures are a relevant burden on societies worldwide. Fracture incidence varies widely among countries and there is not much information available towards the epidemiology of osteoporosis in Brazilian population [3].
The disease is more frequent in women, particularly in menopause. Approximately 30% to 50% of trabecular bone mass and 25%-30% of cortical bone are lost just before and after menopause [4]. Hence, age is considered a modification factor to BMD, as fragility fractures increase and BMD decreases with aging [1]. Due to fracture complications, patients may experience decreasing in life quality and increasing in mortality [5]. The most relevant predictive factor of mortality is poor health prior to osteoporotic fracture.
Notwithstanding, peripheral DXA has also been recognized as convenient to assess BMD and fracture risk [10]. Nevertheless, DXA is not largely available mainly in developing countries. Therefore, the prevention of osteoporotic fractures by early diagnosis in high-risk groups is impaired as the screening is not usually performed [11]. Once diagnosed, pharmacological therapies and lifestyle modifications can be applied and fracture risk can be substantially decreased.
Meanwhile, panoramic radiographs are commonly used in routine dentistry practice and requested for new patients at the beginning of dental treatments [12,13]. Mandibular cortical bone may reflect changes in bony architecture from other sites of skeleton, [12] since porosity due to reduction in BMD and shape modifications can be assessed by radiomorphometric indices on panoramic radiographs [14], as the MCI [15]. MCI is valuable for screening patients at osteoporosis risk and it is inversely correlated with systemic BMD [14,15].
Fracture incidence varies widely among countries and there is not much information available towards the epidemiology of osteoporosis in Brazilian population [3,16]. Furthermore, Brazil is a developing country and population has limited access to DXA; MCI may be widely applied to screen patients with high risk of low BMD. Thus, this study aims to assess and compare BMD in a sample of Brazilian women according to age ranges using peripheral DXA. Additionally, it aims to analyse the correlation between MCI and peripheral DXA of each site of the forearm.
Materials and Methods
Study Participants
In this retrospective study, a total of 252 women were selected and divided in eight groups, according to age ranges, as described in [Table/Fig-1] (ages from 25 to 83 years). Age range was selected according to the convenience sample available, but excluding women younger than 25-year-old. All patients willing to participate in this study signed an informed consent form. This research was conducted with female patients referred for dental treatment at the Dentistry School in the University of São Paulo, Brazil, during the period from October 2010 to December 2014. This study was approved by the Ethics Committe on Research of the Faculty of Dentistry, University of São Paulo (FR358902). The guidelines of Helsinki Declaration of 1975 (revised in 2000) were followed in this investigation.
Anthropometric characteristics of Brazilian women by age strata and mean T score for each forearm site. The numbers highlighted denote the higher T-scores found for the different forearm sites.
| Age Range (Years) | N | Age (Years) | Weight (kg) | Height (m) | BMI (kg/m2) | Proximal Radius (T Score) | Distal R+U (T Score) | Proximal R+U (T Score) |
|---|
| 25-39 | 15 | 34.06 (3.77) | 59.07 (8.89) | 1.61 (0.1) | 22.87 (2.97) | -1.21 (0.97) | -0.31 (0.84) | -1.33 (0.99) |
| 40-44 | 27 | 41.81 (3.33) | 64.53 (11.52) | 1.59 (0.08) | 25.56 (4.16) | -1.3 (0.96) | -0.03 (1.17) | -1.26 (0.93) |
| 45-49 | 32 | 47.53 (2.47) | 67.78 (9.85) | 1.6 (0.07) | 26.38 (4.12) | -1.24 (0.95) | -0.22 (0.91) | -1.24 (0.88) |
| 50-54 | 38 | 51.84 (2.43) | 66.08 (10.99) | 1.59 (0.06) | 26.22 (4.02) | -1.55 (1.06) | -0.39 (1.09) | -1.66 (0.87) |
| 55-59 | 38 | 56.63 (1.82) | 68.47 (11.09) | 1.58 (0.08) | 27.39 (3.91) | -1.8 (1.21) | -0.9 (1.01) | -1.94 (1.13) |
| 60-69 | 62 | 61.8 (1.47) | 66.63 (15.15) | 1.57 (0.07) | 26.88 (4.7) | -2.98 (1.34) | -1.54 (1.01) | -3.05 (1.34) |
| 70-83 | 40 | 73.7 (3.59) | 61.88 (10.18) | 1.55 (0.07) | 25.79 (4.33) | -3.67 (1.47) | -1.95 (0.95) | -3.79 (1.44) |
Ethics Committee in Research of the Faculty of Dentistry, University of São Paulo, Brazil.
Inclusion and exclusion criteria
Women from the city of São Paulo who live in the community near to the university who had undergone panoramic radiographic examination for initial dental evaluation at the beginning of dental treatment and peripheral DXA for screening osteoporosis were included. Patients filled out a form with personal information (such as age, weight and height), lifestyle habits (alcohol, exercises practice, tobacco use) and complete medical history (menopause period, medication intake, comorbidities).
The presence of metabolic diseases or history of medication intake affecting bone metabolism (for instance: bisphosphonate or glucocorticoids) as well as tobacco or alcohol chronic use, were considered as an exclusion criteria.
Dual X-ray absorptiometry
Bone densitometry measurements were carried out with peripheral DXA (pDEXA, Norland, Norland Medical Systems, Inc., White Plains, NY, USA). The radiation dose was less than 0.03 mSv for each examination. Patients were diagnosed as normal or with low BMD/osteoporotic based on BMD values of the forearm of non-dominant hand, according to a criteria report of a World Health Organization (WHO) study Group for normal (T score > -1.0), osteopenic/low BMD (T score, -1.0 to -2.5) and for osteoporotic bone (T-score < -2.5 SD) [17]. Values of three different sites were collected: proximal radius, proximal radius and ulna (R+U) and distal radius.
Panoramic Radiographs
All digital panoramic radiographic images were obtained using the same panoramic X-ray unit (Kodak 8000, Eastman Kodak Company, Rochester, United States of America), with the same exposure conditions (60 kV, 4 mA, 0.5-mm copper filter). Evaluation of panoramic radiographs were performed using the software Image J (National Institute of Health, Bethesda, MD, USA). Radiographs with technical failures or pathological alterations (such as cystic lesions or tumors) in the area of interest were not included.
Mandibular Cortical Index
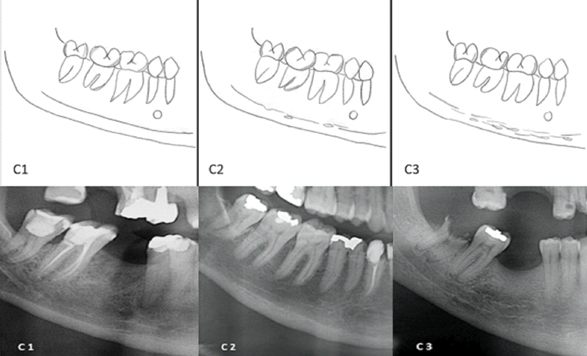
The MCI was evaluated by the appearance of the cortical bone from the mandibular endosteal margin below the mental foramen to the second inferior molar region, using Klemetti E et al., classification on both sides of mandible (right and left) [15]. The appearance of the endosteal margin in the inferior mandibular cortex was classified as follows:
C1 = Normal, with well-defined endosteal margin without porosity or lacunar resorption (oval-shaped radiolucency near and above the margin or in the margin);
C2 = Moderately eroded, with lacunar resorption or endosteal linear cortical residues; multiple lacunar resorptions;
C3 = Severely eroded, with clear lacunae or linear cortical residues or erosions observed. Endosteal margin is poorly evident.
A schematic drawing, (based on the previous published figure that illustrates MCI classification) [16] of the aforementioned classification and its correspondent categories, and an example of each category of this classification is available on [Table/Fig-2].
squematic drawing of Mandibular Cortical Index Classification. In C1 = even and sharp endosteal margin; C2 = moderated eroded; C3 =severely eroded, loss of definition of endosteal margin. Teeth presence or absence doesn’t interfere in the evaluation.
Below, panoramic details to exemplify different MCI classification. From left to right: C1: the endosteal margin, well demarcated, without erosions or defects; C2: presence of some defects in endosteal margin; C3: absence of demarcation of endosteal margin and presence of several radiolucencies (erosions and linear defects).

Correlation between MCI and peripheral DXA
Three observers with expertise in oral radiology and previous experience in MCI performed the MCI classification. Intraobserver reliability was assessed between measurements performed seven days apart to eliminate memory bias. Then, the correlation was performed considering each site of peripheral DXA individually.
Statistical Analysis
Logistic regression was accomplished regarding the relationship between age and T-scores. For the MCI test, intraobserver reproducibility and interobserver reliability were confirmed for MCI categorical measurements (kappa). In addition, non-parametric correlations between MCI and T-scores of the proximal and distal forearms sites were carried out with Spearman’s test. All statistical analyses were performed at a level of significance of 5%, using IBM SPSS Statistics version 17.0, SPSS®, Inc, Chicago, IL.
Results
A total of 252 women were evaluated in eight different groups according to age ranges, as described in [Table/Fig-1]. Assessment according to age range and mean T-scores is also depicted in [Table/Fig-1], as well as comparison between groups in different sites of peripheral DXA.
Demographics
The mean age of the enrolled 252 Brazilian women was 56.42±11.61 years, and their mean Body Mass Index (BMI) was 26.25±4.14 kg/m2. Demographic data divided into different age groups is demonstrated in [Table/Fig-1].
Statistical Analysis: Logistic Regression
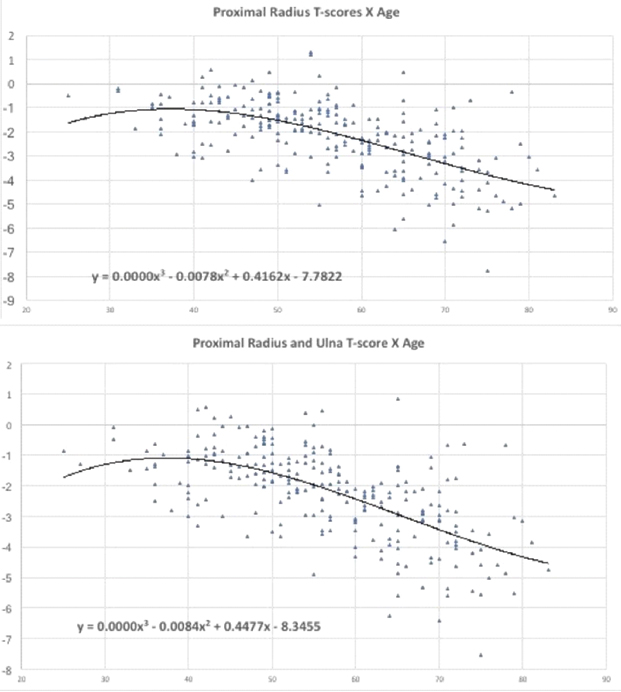
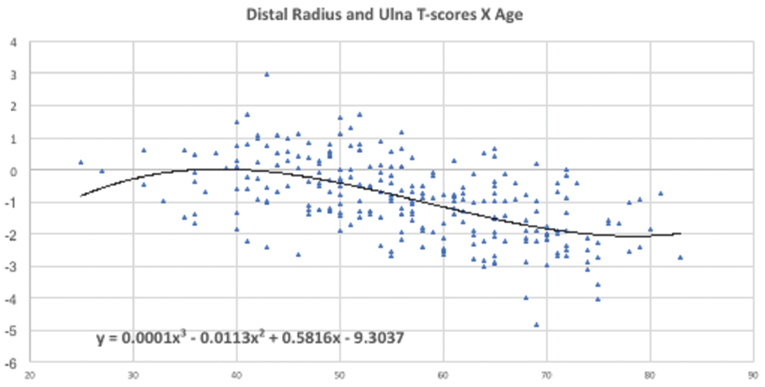
Regression analysis results performed to assess the relationship between BMD and age for each forearm site, are demonstrated in [Table/Fig-3,4].
BMD and age regression analysis results at Proximal radius and at Proximal radius and Ulna.

BMD and age regression analysis results at Distal radius and Ulna.

Age-related bone loss was less significant at distal forearm, as demonstrated in [Table/Fig-4] and markedly more severe in proximal sites, as observed in [Table/Fig-3].
The higher T-score values at the proximal radius were observed in 25-39 age range group; in 40-44 age range group for distal forearm and in 45-49 age range group at the proximal R+U site.
Correlation between MCI and peripheral DXA
Interobserver and intraobserver reproducibility were confirmed for MCI categorical measurements (kappa=0.81, p=0.01).
Different inverse correlations were found between MCI and the different forearm sites: stronger for proximal sites and weaker for the distal site as depicted in [Table/Fig-5].
MCI and T-scores correlation to forearm for each site.
| MCI X T-score |
|---|
| Proximal Radius | Distal Radius | Proximal R+U |
|---|
| r= -0.50p <0.0001 | r= -0.38p <0.0001 | r= -0.50p <0.0001 |
Abbreviations: MCI: Mandibular Cortex Index
R+U: Radius and Ulna
* p value significant if p<0.05
Discussion
Osteoporosis diagnosis is primarily based on the detection of decreased BMD. Peripheral DXA and an adequate clinical evaluation can be used in the disease diagnosis [18]. Forearm measurement is the oldest method of bone densitometry, but the number of publications related to values of peripheral densitometry is surprisingly low [19]. The prevalence of the disease, as well as the mortality due to a fragility fracture [20], increase with aging [1].
Osteoporosis is more prevalent in postmenopause women particularly due to the expressive oestrogen decrease [21], which plays a significant role in bone remodeling physiology [22]. Women bone mass decreases with aging, mainly after menopause period [4]. The main factor that contributes to the development of postmenopausal osteoporosis is the peak of bone mass at younger ages [4]. The average menopause age is variable between the populations. Among Brazilian women the average of last menstrual period is about 47 to 51-year-old [23].
The relationship between age and bone loss was shown by this study: as women ages, BMD decreases in all forearm sites. The proportion of trabecular bone increases in the distal direction along the radius [24], and this fact might explain the lower T-score values found in proximal sites when compared to the distal forearm, which is similar to what has been previously noticed in other studies [25]. Pouilles JM et al., aimed to evaluate pDXA measurement of the forearm to predict low axial BMD in 234 French women, and found the prevalence of osteoporosis to range from 3.4% (distal forearm) to 14.1% (proximal) which is comparable to our results and to other previous studies [25-27].
However, despite these evidences, a previous report found that age-related bone loss was less severe at the proximal radius when compared to the distal forearm [24]. In this latter study, Meszaros S et al., aimed to compare the diagnostic consequences of using either an international or a local Hungarian reference database in peripheral densitometry. They concluded that the BMD of the proximal site was almost twice that at the distal site, and the difference between the regions increased with age, as the age-related bone loss was less severe at the proximal radius [24].
The higher T-score values for proximal radius were observed in the 25-39 age range group and for distal forearm in the 45-49 age range group in the present study; a different age range BMD peak from 30 to 40 years old in all peripheral sites was observed in an another research [24]. As the BMD is influenced by geographical and social circumstances [24], a difference among the populations is expected.
Systemic low BMD can lead to alterations in mandible, especially in the mandibular cortex [28] that can be assessed in panoramic radiographs by radiomorphometric indices, such as MCI. The negative correlation between MCI and T-score in proximal sites of peripheral DXA found in this study evidences the use of panoramic radiography, which is often requested for new patients at the beginning of dental treatments [13], as a useful tool for assessing patients at risk for osteoporosis [15]. This finding is in agreement with previous studies in different populations and women using central DXA [15,29,30]. Nevertheless, a weak inverse correlation was found between MCI and T-score in the distal forearm. To our knowledge, this is the first study that considered the distal site in MCI correlation. The higher T-scores values at distal R+U observed might explain this weak inverse correlation; furthermore, the percentage of trabecular bone in the distal forearm remains approximately constant with age [31].
Limitation
The limitations of the present study are the retrospective design and the small sample size. Larger population-based prospective studies are recommended to clarify the difference between Brazilian women BMD according to age ranges and different sites in peripheral DXA. Another limitation is that no data on the relationship between the forearm BMD and the BMD of other skeletal sites were compared.
Conclusion
Within the limitations of this study, it was concluded that age-related bone loss is more evident in the proximal forearm than in the distal forearm. Furthermore, MCI can express a better inverse correlation with peripheral DXA at the proximal forearm than with the distal forearm.