Z-Score and CIAF–A Descriptive Measure to Determine Prevalence of Under-Nutrition in Rural School Children, Puducherry, India
S Ramkumar1, S Vijayalakshmi2, P Kanagarajan3, Rajkumar Patil4, A Lokeshmaran5
1 Assistant Professor, Department of Community Medicine, Vinayaka Missions Medical College and Hospital, Karaikal, Puducherry, India.
2 Assistant Professor, Department of Community Medicine, Vinayaka Missions Medical College and Hospital, Karaikal, Puducherry, India.
3 Assistant Professor, Department of Community Medicine, Texilas Medical School, Guyana.
4 Professor, Department of Community Medicine, Mahatma Gandhi Medical College and Research Institute, Puducherry, India.
5 Assistant Professor, Department of Community Medicine, Mahatma Gandhi Medical College and Research Institute, Puducherry, India.
NAME, ADDRESS, E-MAIL ID OF THE CORRESPONDING AUTHOR: Dr. S Ramkumar, Assistant Professor, Department of Community Medicine, Vinayaka Missions Medical College and Hospital, Keezhakasakudimedu, Karaikal, Puducherry-609609, India.
E-mail: mailtodrramkumar@gmail.com
Introduction
Under-nutrition is a major public health distress affecting significant number of school children markedly influencing their health, growth and development, and also their school academic performance. Composite Index of Anthropometric Failure (CIAF) and z-score system provides a comprehensive magnitude of undernutrition.
Aim
To determine the magnitude and compare the prevalence of undernutrition using z-score and CIAF in the rural school going children, Puducherry, India.
Materials and Methods
Total 792 school children were enrolled from six schools during November 2013 and January 2014. All the students who were present during the survey were included. The z-score for nutritional indices were calculated using WHO Anthro-Software. Statistical analysis was done using EPI-Info 7. Chi-square test was used to find the associations. A p-value <0.05 was considered statistically significant.
Results
Nearly 48.7% of the children had anthropometric failure. The most common anthropometric failure as per CIAF was underweight with wasting (18.7%). The prevalence of underweight and wasting were more among male children than female children with significant difference (p<0.05), whereas in stunting, no significant difference was found between male and female. Using underweight as the sole criteria for assessing the magnitude of undernutrition in this study would give us an underestimate of undernourished children of about 10%.
Conclusion
Our study also suggests that using conventional method (Weight for Age), centres has chance of missing nearly 10% of the undernourished children. Thus, by using z-score system we have an advantage of identifying school children with wasting and stunting in addition to the children who are underweight. Also, by using CIAF classification, undernourished children were disseminated into different groups, which helps to identify children with multiple anthropometric failures and priority can be set for planning the management.
Anthropometric failure, Nutritional status, Public health distress
Introduction
Under-nutrition is a major public health distress affecting a significant number of school children which markedly influences their health, growth and development, and also their school academic performance [1]. Vicious interactions between undernutrition, poor health, and impaired cognitive development set children on lower development paths and lead to irreversible changes and thus conditions of early life provide the foundations for adult life [2,3].
Globally, one third of the children deaths (7.6 million) occur before their fifth birthday are primarily due to undernutrition [4]. According to a report made by World Health Organization (WHO), the nutritional status of school-age children impacts their health, cognition, and subsequently their educational achievement [5]. In the developing countries, 52% and 34-62% of the school-age children are stunted and underweight, respectively [4].
The school is an opportune setting to provide health and nutrition services to disadvantaged children. Although diagnosis of undernutrition is very simple and yet, school-age children are not commonly included in health and nutrition surveys and it may go undiagnosed over a long period of time. So an up-to-date overview of their nutritional status across the world is not available [4].
WHO has recommended the use of z-score to grade malnutrition but z-score system does not provide comprehensive magnitude of undernutrition [5,6]. Anthropometric indices can serve only as proxies for evaluating the prevalence of undernutrition among children. Therefore, for a comprehensive measurement of overall prevalence of undernutrition needs a single aggregate indicator. Such an aggregate indicator was proposed by Peter Svedberg called CIAF i.e., Composite Index of Anthropometric Failure [7]. Svedberg’s model identifies six groups, to these subgroups one more subgroup Y has been added by Nandy SM et al., which represents children who are only underweight [Table/Fig-1] [8]. This comprehensive measurement provides a consolidated prevalence of under-nutrition, whereas other conventional methods are not sufficient to measure the overall prevalence of malnutrition among school going children.
| Criteria | Interpretation |
|---|
| A | Normal or no anthropometric failure |
| B | With wasting only |
| C | Wasting and underweight |
| D | Wasting, stunting and underweight |
| E | Stunting and underweight |
| F | Stunting only |
| Y | Underweight only |
So, realizing the importance of undernutrition in school going children, the present study was conducted to determine the prevalence of undernutrition status using WHO z-score and CIAF classification among school going children from age group of 7 to 15 years in a rural area of Puducherry, India. Aim of the study was to determine the magnitude of undernutrition using z-score and CIAF in the rural school going children in Puducherry and to compare prevalence of CIAF classification and z-score criteria used in school health programme.
Materials and Methods
Study area and Population
The study was conducted as a part of the school health survey conducted in rural Puducherry. The study population comprised of all the school children with the age group of 7 to 15 years from seliamedu village, Bahour commune, Puducherry, India.
Written permission was obtained from the Directorate of School Education, Government of Puducherry. Prior to the start of the study, informed consent was obtained from the school heads in the seliamedu village. The ethical clearance was also obtained from Institutional Human Ethical Committee. The importance of the study was explained to the staffs, students and teachers in their local language.
Study Design
Out of 815, 792 (97.2%) students who were present during survey were enrolled from six schools during November 2013 and January 2014. All the students who were present during the survey were included.
Anthropometric measurement like height, weight and mid-arm circumference were recorded as per the standard recommendations [6]. The heights of the students were measured using a portable height measuring device in a standing position. A standard weighing machine was calibrated and the zero error was checked before starting the examination every day. The weight and height were recorded to the nearest 0.1 kg by weighing scale and 0.5 cm by measuring scale respectively.
The z-score for nutritional indices were calculated using WHO Anthro-Software. The prevalence of underweight, stunting and wasting was calculated at cut-off level <-2SD (z-score <-2). Prevalence of severe underweight, stunting and wasting was calculated at cut-off level <-3SD (z-score <-3) [6]. The children on the basis of the z-score were categorized as per the subgroups of Svedberg’s model and Nandy et al., to get the overall CIAF prevalence of undernutrition [7,8]. Statistical analysis was done using EpiInfo 7 [9]. Chi-square test was used to find the associations. A p-value <0.05 was considered statistically significant.
Results
Total 792 school students participated in the study. The response rate was 97.2%. Majority of the students belonged to Hindu religion (91%); 56% of the students were living in nuclear family. Most of the families (64%) belonged to class IV socio-economic status.
Among 792, boys and girls were in nearly equal number (Boys 47.3% and Girls 52.7%) and more than one third of study population (36.4%) belonged to the age group > 158 months followed by 108-132 months [Table/Fig-2].
Age and sex wise distribution of the study population (n=792).
| AGE(months) | Sex | Total |
|---|
| Male (n=375)n (%) | Female (n=417)n (%) | n (%) |
|---|
| <84 | 43 (11.5) | 61 (14.6) | 104 (13.1) |
| 84-108 | 67 (17.9) | 64 (15.3) | 131 (16.5) |
| 108-132 | 72 (19.2) | 79 (18.9) | 151 (19.1) |
| 132-158 | 45 (12) | 73 (17.5) | 118 (14.9) |
| >158 | 148 (39.5) | 140 (33.6) | 288 (36.4) |
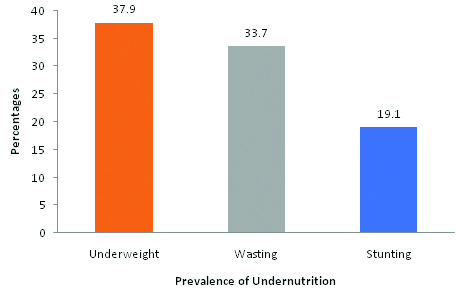
[Table/Fig-3] shows prevalence of undernutrition among school going children. Around 38%, 34% and 19% of the school children were under-weight, wasting and stunting respectively as per the WHO z-score criteria.
Prevalence of undernutrition based on WHO z-score (n=792).
*undernutrition denotes “below-2 SD” and “below-3 SD”
[Table/Fig-4] shows the sex wise prevalence of under nutrition among the school going children. It was observed that, the prevalence of underweight and wasting were more among male children than female children with significant difference (p<0.05), whereas in stunting, no significant difference found between male and female.
Sex wise prevalence of under nutrition (n=792).
| Sex | Underweight*% below | Stunting*% below | Wasting*% below |
|---|
| <-2SD | <-3SD | <-2SD | <-3SD | <-2SD | <-3SD |
|---|
| Male(n=375) | 109 (29.1) | 47 (12.5) | 70 (18.7) | 7 (1.9) | 90 (24) | 64(17.1) |
| Female(n=417) | 108 (25.9) | 36 (8.6) | 62 (14.9) | 12 (2.9) | 68 (16.3) | 45(10.8) |
| Total | 217 (27.4) | 83 (10.5) | 132 (16.7) | 19 (2.4) | 158 (19.9) | 109 (13.8) |
| Chi-squarevaluep-value | 4.190.04 | 0.930.33 | 17.23<0.001 |
* “below-2 SD” denotes undernutrition and “below-3 SD” denotes severe undernutrition.
[Table/Fig-5] shows the age wise nutritional status of the school children. It was observed that the prevalence of under-nutrition increased as the age advanced among school children with significant difference (p<0.05).
Age wise prevalence of indices of under nutrition (n=792).
| AGE(months) | Underweight*n(%) below | Stunting*n(%) below | Wasting*n(%) below |
|---|
| <-2SD | <-3SD | <-2SD | <-3SD | <-2SD | <-3SD |
|---|
| <84 (n=104) | 34 (32.7) | 6 (5.8) | 11(10.6) | 5 (4.8) | 21 (20.2) | 18 (17.3) |
| 84.1-108(n=131) | 33 (25.2) | 22 (16.8) | 15 (11.5) | 3 (2.3) | 29 (22.1) | 29 (22.1) |
| 108.1-132(n=151) | 47 (31.1) | 20 (13.2) | 19(12.6) | 1(0.7) | 33 (21.9) | 29 (19.2) |
| 132.1-158(n=118) | 39 (33.1) | 12 (10.2) | 25 (21.2) | 4 (3.4) | 26 (22) | 10 (8.5) |
| >158(n=288) | 64 (22.2) | 23 (8) | 62(21.5) | 6 (2.1) | 49 (17) | 23 (8) |
| Total(n=792) | 217 (27.4) | 83 (10.5) | 132 (16.7) | 19 (2.4) | 158 (19.9) | 109 (13.8) |
| Chi-Squarep-value | 12.290.015 | 12.810.012 | 21.18<0.001 |
*Below-2 SD” denotes undernutrition and “below-3 SD” denotes severe undernutrition.
[Table/Fig-6] shows the nutritional status of the students as per CIAF, based on their anthropometric status. Out of 792, 51.3% of the children were anthropometrically normal; 48.7% of the students were suffering from one or more form of anthropometric failure. It was observed that 6.4 %, 4.4 % and 4.5% of students had only wasting, stunting and underweight respectively. Compared to all the groups, undernourishment was high in C group (wasting +Underweight) that is 18.7%.
CIAF Classification of children by their anthropometric status (n=792).
| Group | Anthropometric status | No of children | % |
|---|
| A | No failure | 406 | 51.3 |
| B | Wasting only | 51 | 6.4 |
| C | Wasting + Underweight | 148 | 18.7 |
| D | Wasting +Underweight+ Stunting | 68 | 8.6 |
| E | Stunting+ Underweight | 48 | 6.1 |
| F | Stunting only | 35 | 4.4 |
| Y | Underweight only | 36 | 4.5 |
| Total | 792 | 100.00 |
Discussion
The present study was done in a Bahour commune in Puducherry district. The principle focus of the study was to assess the magnitude of undernutrition using z-score and CIAF in the rural school going children. The study participant’s age groups were between 7 to 15 years, 36.4% of the participants were from the age group of 13 to 15 years. Female students (52.7%) enrolment were little higher than the male students (47.3%) in the present study area. This shows that pattern of sex ratio in Puducherry (i.e.,) higher female sex ratio than males [10].
As per WHO z-score system of classification, it was observed that underweight (37.9%) was the most prevalent form of under-nutrition followed by wasting (33.7%) in the current study area, which was similar to the study conducted in Coimbatore, Tamilnadu [11]. In contrast, studies conducted in rural area of Tamilnadu and Kashmir among school children reported higher prevalence (89% and 74%) [12,13]. This stresses the factor that wide range of undernutrition was prevalent in and around Puducherry. This may be due to prevailing socio-economic cultures in the area.
In the present study prevalence of under-nutrition as per WHO z-score system increases as the age advanced among school children with significant difference. Similar to our study, Rema N and Vasanthamani G, and Caroline PK et al., also reported similar pattern of under nutrition prevalence in their studies [11,12]. This stresses the fact that children as age advances have high physical activity leads to excess energy loss together with infections and lack of adequate nutrition could make them more undernourished.
It was observed that the prevalence of underweight and wasting were more among male children than female children using z-score system. Similar to our study, Rema N and Vasanthamani G, reported higher prevalence of underweight among males compared with females whereas Caroline PK et al., reported that prevalence of underweight were common for females than males [11,12]. Higher prevalence of undernutrition among male children was probably due to lack of awareness, delay in seeking health care facility and low education among rural mothers.
As per CIAF criteria in the present study, “children with no failure” (Group A) accounts for 51.3% while children with “Group C” consists of 18.7% and children in Group D “Wasting and Stunting and Underweight” accounts for 9.3%. Relatively high prevalence of wasting and underweight (Group C) was observed among school children is indicative of chronic illness and also food deprivation among them. In contrast, the study done by Nandy et al., reported that, “Children with no failure” (Group A) account for 40.2% while children with “Wasting and Stunting and Underweight” (Group D) account for 7.2% and in another study done by Seetharaman N et al., (31.4%) children were normal and 5.7% of children had “Wasting and Stunting and Underweight” (Group D) [8,14].
By using the conventional growth monitoring used in school health programme based on weight for age i.e., as per WHO method, we can assess only magnitude of undernutrition belonging to groups C, D, E and Y in CIAF method which is about 37.9%. Further we will miss the children in group B and F which form about 10.9% of study population. Therefore, these 86 children (10.9% of study population) who are actually undernourished will be labelled as normal if only weight for age criterion is used. So CIAF can be used to identify the actual number of undernourished children and also by using CIAF classification, undernourished children were disseminated into different groups, which helps to identify children with multiple anthropometric failures and priority can be set for planning the management. Combining WHO along with CIAF method would be better to identify all types of undernutrition instead of using weight for age alone as the criteria.
Conclusion
Prevalence of under-weight, wasting and stunting as per WHO criteria were 38%, 34% and 19% respectively. As per CIAF classification around 49% of the children had anthropometric failure. Using weight for age as the sole criteria for assessing the magnitude of undernutrition in school health programme would give us an underestimate of undernourished children of about 10%.
In India only very few studies had conducted to determine the prevalence of undernutrition using CIAF especially in school children. The study recommends incorporating CIAF system of classification in routine growth monitoring activities in schools to identify the different anthropometric failures, so that priority for policy development can be set for multiple growth failure children followed by others.
* “below-2 SD” denotes undernutrition and “below-3 SD” denotes severe undernutrition.
*Below-2 SD” denotes undernutrition and “below-3 SD” denotes severe undernutrition.
[1]. Maurice H King, Nutrition for developing countries. Reprint 1976 1976 NairobiOxford University Press [Google Scholar]
[2]. Svedberg P, Can indicators of child malnutrition be improved – and for what purposes?Taking action for the world’s poor and hungry people 2007 Beijing, China [Google Scholar]
[3]. Sachdev HPS, Assessing Child Malnutrition - Some Basic IssuesNutritional Foundation of India archives 156 1996 New DelhiNFI [Google Scholar]
[4]. Van den Broeck J, Willie D, Younger N, The World Health Organization child growth standards: expected implications for clinical and epidemiological researchEur J Pediatr 2009 168(2):247-51.10.1007/s00431-008-0796-918670787 [Google Scholar] [CrossRef] [PubMed]
[5]. United Nations system standing committee on nutrition: Report of the standing committee on nutrition at its thirty-third session. WHO; 2006. http://www.unscn.org/files/Annual_Sessions/33rd_SCN_Session/33rd_session_REPORT.pdf. Retrieved February 22, 2015 [Google Scholar]
[6]. World Health Organization. Expert Committee on nutrition and physical status: Uses and interpretations of anthropometry Geneva: WHO;1995 [Google Scholar]
[7]. Svedberg P, Poverty and under nutrition - Theory, measurement and Policy 2000 New DelhiOxford India Paperbacks [Google Scholar]
[8]. Nandy SM, Irving M, Gordon D, Subramanian SV, Davey Smith G, Poverty, child undernutrition and morbidity: new evidence from IndiaBull World Health Organ 2005 (83):210-16. [Google Scholar]
[9]. CDC. EPI-Info software, version 7.4.4 [Internet]. USA: CDC; 2015 [cited 2015 Jan 23]. Available from: URL: http://wwwn.cdc.gov/epiinfo/7/ [Google Scholar]
[10]. Government of Puducherry. Population census2011. Puducherry [online]. 2011 [cited 2013 Feb 23]. Available from: URL: http://www.census2011.co.in/census/district/482-puducherry.html [Google Scholar]
[11]. Rema N, Vasanthamani G, Prevalence of nutritional and lifestyle disorders among school going children in urban and rural areas of Coimbatore in Tamil Nadu, IndiaIndian Journal of Science and Technology 2011 4(2):131-40. [Google Scholar]
[12]. Caroline PK, Seenivasan P, Praveen H, Amala GM, Annapoorani V, Shuruthi DRS, A study on nutritional status of school children in rural, semi urban and urban areas of TamilnaduStanley Medical Journal 2014 1(1):01-09. [Google Scholar]
[13]. Fazili A, Mir AA, Pandit IM, Bhat IA, Rohul J, Shamila H, Nutritional Status of School Age Children (5-14 years) in a Rural Health Block of North India (Kashmir) Using WHO Z-Score SystemOnline Journal of Health and Allied Sciences 2012 11(2):02-03. [Google Scholar]
[14]. Seetharaman N, Chacko TV, Shankar SRL, Mathew AC, Measuring malnutrition, the role of Z-scores and the Composite Index of Anthropometric Failure (CIAF)Indian J Comm Med 2007 32(1):35-39.10.4103/0970-0218.53392 [Google Scholar] [CrossRef]