Computerised tomography is an integral part of medical diagnosis and interventional procedures [1]. The head and neck CT scans find their utility in Ophthalmology, Otolaryngology, Neurology and Dental or maxillofacial diagnosis. These scans are often cautioned for high effective dose of radiation and associated with risk of associated cancers and teratogenic changes [2]. Genotoxicity in buccal cells is reported to occur due to a number of reasons like habitual, environmental, occupational hazards including radiation exposure. Studies have shown that micronuclear assays can estimate these changes, which are initial signs of carcinogenesis [3]. Micronucleus originates from a chromosome fragment that lags behind during anaphase of cell division and serves as a simple method in estimating DNA damage, while the associated nuclear abnormalities reflects on chromosomal abnormalities [4].
Diagnostic radiation is overlooked cause of gene damage as evident from significant finding in terms of micronucleus formation when exposed to low dose dental panoramic radiation [4,5]. The study was planned considering that CT scans have higher dose than diagnostic dental radiation and that their indication is increasing in recent decade [2]. Routine literature search clearly reports on DNA damage studies resulting from dental radiation, occupational radiation exposures, therapeutic radiation, but not on head and neck CT scans related oral cell genotoxicity [3-5]. Thus, the current study was planned to quantify these changes in buccal mucosal cells after head and neck CT scans.
Materials and Methods
The present study was an observational study, completed over a period of 12 months i.e., from August 2015-2016 in Mahatma Gandhi Medical College and Research Institute, Puducherry, India.
Sample size: The sample of 35 was obtained using the standard formula,

where, the Standard Deviation (SD) was taken from previous study [5] (SD=0.86), the Za is predetermined as 0.05, Zb is obtained from the Z table and d referred to precession. An estimated attrition of 10% was considered while calculating the size of 39, which was rounded off to 40.
Inclusion criteria: Patients undergoing head and neck CT scans (region of interest as per radiological anatomy-skull base to hyoid bone). These limits were given so that the buccal mucosal cells were in line of the radiation to assess desired outcome. All the exposure parameters were recorded while the scans were made. [Table/Fig-1].
Exposure parameters of different head and neck CT scans.
| S. No. | CT view | Exposure parameters |
|---|
| 1 | CT B | Voltage (kVp) | 80-100 |
| Current (mA) | 100-120 |
| Time (seconds) | 1 |
| Effective dose (mSv) | 2 |
| 2 | CT PNS | Voltage (kVp) | 85-100 |
| Current (mA) | 100-120 |
| Time (seconds) | 1 |
| Effective dose (mSv) | 2 |
| 3 | CT CS | Voltage (kVp) | 200-250 |
| Current (mA) | 100-120 |
| Time (seconds) | 1-2 |
| Effective dose (mSv) | 5 |
kVp*: kilovoltpeak; mA†: milliampere; mSv‡: microsievert
Exclusion criteria: Any notable cause of genotoxicity in buccal mucosal cells was excluded, including patients with history to habits (smoking, tobacco/alcohol or areca nut chewing), patients with potentially malignant or malignant conditions, previous radiation exposure (diagnostic or therapeutic), who had occupational hazards (i.e., industrial, pesticide and forensic lab workers), patients on long-term drugs (antibiotics/cancer chemotherapy) and who were uncooperative/unwilling for the study.
Sample selection: A brief hospital based survey was done to determine the mean number of cases reporting to department for CT scans in head and neck region and was found to be around 43 per month. The kth formula sample (K)= Total population/sample size was used i.e., K=43/40=1.075 (approximately=1) to obtain the sampling method. Thus, consecutive systematic sampling was adopted (K=1) where in every patient indicated for head and neck CT scan falling under the study criteria was included in the study [6]. The study was approved by Institutional Review Board and an ethical clearance was obtained (Reference code: IGIDSIEC2015NDP03PGSPOMR). The study was conducted after obtaining patient’s consent in both English and local language. Study Proforma was designed following the standards for micronuclear assays [7].
Methodology: Micronuclear assay of buccal cells is a feasible and non invasive method reported as “biological dosimeter” to monitor DNA damage. The standard criteria by Tolbert PE et al., (1992) [8], was used in micronuclear assay. The other micronuclear abnormalities also were scored owing to the fact that they act as alternate markers of genotoxicity. BN cells [9] reflect failed cytokinesis and chromosomal non disjunction, (NBUDs) are associated with gene amplification and MMN cells reflect on multiple chromosomal alterations and increased cell proliferation capacity [9-13]. The MMN containing cells are more sensitive to radiation damage [9] compared to other markers and are thus appropriate in context of the current study. The buccal cell PI [14] was calculated with the above quantified abnormalities.
This study was performed as per the STROBE guidelines [15] wherein a set of collections were done, which included a baseline collection prior to exposure to CT scan (equipment used was Make GE, model: Optima 660 128 slice scanner) and second collection done after 8-10 days of exposure. The lag period of 8-10 days is explained as time required for basal cell to complete the turnover in buccal epithelial layers [3]. Patients were asked to gargle their mouth with distilled water and then two buccal smears from right and left buccal mucosa of patients were made by gentle scraping using a wooden spatula and then it was evenly spread on the glass slides (Micro slides, manufactured by Blue star Ltd., Mumbai). The method involved placing the smeared content onto one end of the glass slide and spread uniformly over the slide by using another glass slide at 45° angulation to avoid overlapping of cells while analysing under microscope. The glass slides were stored in appropriate media having absolute alcohol (2% iso-propranol, manufactured by Emplura) solution. Then these slides were dried and fixed under PAP stain. The PAP reagent kit (Nice chemicals private Ltd, Kerala) with PAP Eosin Azure (EA-36) stain and PAP solution-OG 6 were used as per standard protocols for staining all the smears.
Scoring method: The stained smears were examined under light microscope (UMDOB 3 model, Olympus research and clinical system solutions, Tokyo, Japan) by two observers at 100X magnifications. The cells were observed as per standards established by Tolbert’s criteria (1992) [8], by a senior oral pathologist and a research associate in medical genetics (two experts) that were blinded. A data analyst (third person) considered all readings. Bland-Altman test was used to find the agreement between the two observers. The test showed that the bias (difference) between the two observers was close to zero (-0.05) and the values lied between the lower and upper line of agreement {mean-2 (standard deviation) and mean+2(standard deviation)} with a correlation r=0.87 (p=0.001), indicating a high agreement between the two observers.
Scoring criteria for micronucleus [9], the associated markers [9-13] and for cell PI [14] are depicted in [Table/Fig-2].
Criteria for scoring positive cells micronucleus and related abnormalities.
| Micronuclear abnormality | Identification/calculation | Reference |
|---|
| Micronuclear cells (MN) | Cells with-Rounded smooth perimeter (suggestive of a intact membrane)Having extra nucleus-Less than 1/3rd diameter of the associated nucleus, staining and texture as original nucleus.It must be in same focal plane as nucleus with absence of overlaps. | Tolbert PE et al., [8] |
| Bi-nucleate cells (BN) | The cells with two near identical sized nuclei, without any other micronucleus | Fenech M et al., [11] |
| Nuclear buds (NBUDs) | The cells with micronucleus-like bodies attached to the nucleus or with an apparent sharp constriction at one end of the nucleus (11) | Goyal P et al., [12] |
| Multi micronucleated cells (MMN) | Multiple micronuclei in a cell. Cells with 3 (tri nucleated) or 4 (tetra nucleated) | Jois SH et al., [9] |
| Proliferative index (PI) of cells | PI= (1×% of mono-nuclear cells)+(2 ×%bi-nucleated cells)+(3×% tri-nucleated cells))+(4×% tetra-nucleated cells). | Sinitsky M et al., [13] |
Statistical Analysis
All the comparisons before and after exposure were evaluated by paired t-test by using the Statistical Package for Social sciences (version 20.0. SPSS Inc, Chicago, IL, USA) software.
Results
The obtained results were categorised based on obtained views of head and neck CT (CT brain and facial bones, CT paranasal sinuses and CT cervical spine). [Table/Fig-1] shows the exposure parameters of these three scans. The comparison of overall pre and post exposure counts of various markers of DNA damage and PI are discussed below.
i. DNA Damage- Micronuclear Count Comparisons
The results showed significant difference comparing pre and post exposure scores. [Table/Fig-3] shows the comparison of micronuclear counts for various CT scans.
Comparison of DNA damage before and after head and neck CT scans.
| CT View | Variable | Mean±SD | 95% CI of the difference | t value | df | p-value |
|---|
| Upper | Lower |
|---|
| CT B | Micronucleus pre exposure | 4.59±1.764 | 9.815 | 6.912 | -11.98 | 21 | <0.001 |
| MicronucleusPost exposure | 12.95±3.57 |
| CT PNS | Micronucleus pre exposure | 4.78±0.52 | 12.39 | 5.606 | -6.114 | 8 | <0.001 |
| MicronucleusPost exposure | 13.78±1.341 |
| CT CS | Micronucleus pre exposure | 4.33±0.745 | 20.15 | 10.518 | -7.34 | 8 | <0.001 |
| MicronucleusPost exposure | 19.67±1.84 |
| All CT scans | Pre exposure | 4.58±1.8 | 11.7 | 8.44 | -12.4 | 39 | <0.001 |
| Post exposure | 14.65±4.9 |
Test used for comparison of data: paired t-test*
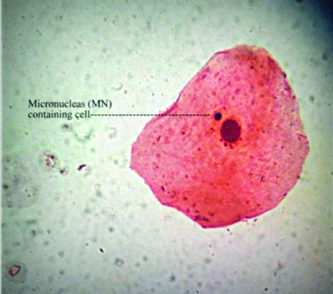
[Table/Fig-4] shows a typical cell with micronucleus, at 100X magnification.
A cell with micronucleus (MN) at 100X magnification (PAP stain).
ii. Other Micronucleus Associated Markers Comparison
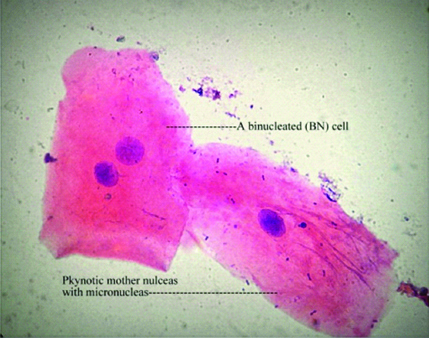
a. BN cells: The counts revealed 0.05% positive cells before and 0.16% positive cells after CT scan, which were statistically significant (p<0.001) [Table/Fig-5]. [Table/Fig-6] shows a BN cell (towards left side) and another (towards right side) cell with MN at 100X magnification.
Comparison of micronuclear associated marker before and after head and neck CT scans.
| Micronuclearabnormality | Exposure (pre/post) | Mean±SD | 95% CI of the difference | t value | df | p-value |
|---|
| Upper | Lower |
|---|
| BN cells | pre exposure | 0.50±0.8 | 1.73 | 0.51 | -3.72 | 39 | 0.001 |
| Post exposure | 1.63±1.8 |
| NBUDs | pre exposure | 4.78±0.52 | 12.39 | 5.606 | -6.114 | 8 | <0.001 |
| Post exposure | 13.78±1.341 |
| MMNCells | pre exposure | 4.33±0.745 | 20.15 | 10.518 | -7.34 | 8 | <0.001 |
| Post exposure | 19.67±1.84 |
Test used for comparison of data: paired t-test*
A bi-nucleated cell (towards left side) and another (towards right side) cell with micronuclei (MN) at 100X magnification (H&E stain).
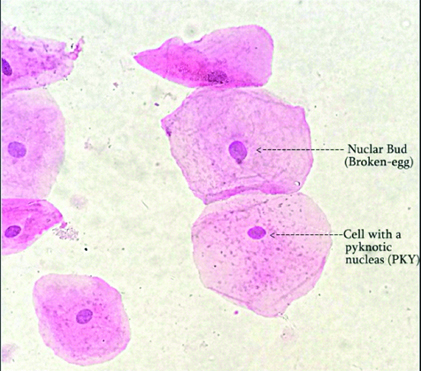
b. NBUDs: The counts revealed 0.47 % positive cells before and 1.37% positive cells after CT scan, which were statistically significant (p<0.001) [Table/Fig-5]. [Table/Fig-7] shows a cell with nuclear bud and another cell showing pyknosis, at 100X magnification.
Cell with nuclear bud (NBUDs) (another cell showing pyknosis), at 100X magnification (H&E stain).
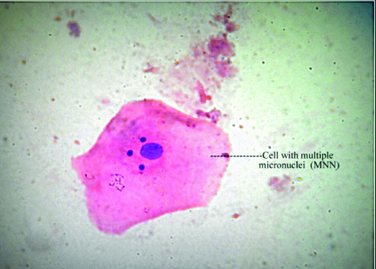
c. MMN Cells: The counts revealed 0.43% positive cells before and 1.9% positive cells after CT scan, which were highly statistically significant (p<0.001) [Table/Fig-8] shows a typical cell with multiple micronuclei, at 100X magnification. [Table/Fig-5] shows comparisons of various micronuclear associated markers of genotoxicity.
A cell with multiple micronuclei (MNN) at 100X magnification (H&E stain).
d. Proliferative Index (PI) of buccal cells: Eastmond DA and Tucker JD (1989) [14] have first proposed on PI of cells based on number of nucleated abnormalities among micronuclear cells observed. This PI was estimated using micro-nucleated cell variants, where values in health do not exceed 2.0 as per the standard formula given by the authors PI= (1x% of mono-nuclear cells) + (2x% bi-nucleated cells) + (3x% tri-nucleated cells) + (4x% tetra-nucleated cells) [13,14]. In current study the calculated PI = {1(0.4) +2(0.05) +3(0.03) +4(1.4)} = 6.2.
Discussion
The CT scan is an essential diagnostic aid in medical practice. An epidemiological survey [2] showed that there is an increased incidence of patients subjected to CT scans. This increase is cautioned for cancer induction among exposed individuals [1]. The easy availability of CT, has render it to become an ideal choice for 3D imaging for dental surgeon. The prime indications of head and neck CT are facial fractures, disorders of temporomandibular joint or paranasal sinuses and in planning dental implants [16].
The common head and neck CT scans, include those taken for head (brain), facial bones and neck (spine) where the mean dose ranged between 4-6 mGy [17]. The scans taken for paranasal sinuses (CT paranasal sinuses) are predicted with risk of 20 to 36 thyroid malignancies per 1,000,000 [18]. The cervical spine scan, the mean excess lifetime thyroid cancer risk is highest for the female patients below age of 10 [19]. Considering the brain and facial bones CT is one of the most common views indicated amongst the head and neck scans, with an estimated mean lifetime cancer risk of 0.04% to 0.09% per scan [20]. A retrospective study [21] showed that CT cervical spine imaging is associated with incidence of thyroid cancers. A 60 fold, rise in paediatric patients was reported as opposed to controls who were subjected to plain film imaging of cervical spine [20]. Recent retrospective model, predicted cancer risks in individuals who underwent the above head and neck CT scans [22].
The mean values of MN were higher for those exposed to CT cervical spine compared to those exposed to other CT scans. Also, CT cervical spine cancer induction period is 2-5 years of exposure, which is reported to be more than 10 years duration for CT brain and facial bone [19,22]. Thus, CT cervical spine (effective dose ranging from 4-6 mSv) is cautioned when female patients (age <18 years) are indicated, considering the high micronuclear counts observed and reported risk of thyroid cancers. Similarly, the commonly indicated CT brain (effective dose ranging from 2-3 mSv) when indicated for age below 22 years, have similar implication. [Table/Fig-3] shows micronuclear count comparison between CT scans.
Holland N et al., have reported baseline frequencies for micronucleated cells in the buccal cells within the range of 0.5-2.5 micronucleated cells/1,000 cells examined in healthy individuals [3]. The pre-exposure micronucleus score obtained in the current study were having a mean±standard deviation=4.58±1.8 which was consistent with controls who were not exposed to any genotoxins in Indian studies [12,23]. Many studies [3,24-26] have shown significant micronuclear formation after diagnostic dental radiation (panoramic views). In the current study, the mean±standard deviation was 14.65±4.9 for CT scan doses [Table/Fig-3].
BN cells are considered to be alternate markers of DNA damage. The micronuclei in these cells are known to occur due to lagging chromosomes and terminal acentric fragments during mitosis. They are indicative of failed cytokinesis succeeding the last nuclear division in the basal cell layer. The chromosomal non disjunction occurs with a higher frequency in BN cells [9]. The BN:MN is reported to be an important biomarker for identifying cytokinesis failure caused by rates of aneuploidy, which is reported to reflect on stochastic effects [9,10]. The BN cells along with MN cells have significance in understanding chromosomal lagging, failed cytokinesis and nondisjunction defects of cell cycle. Fenech et al., have given criteria [Table/Fig-2] for scoring BN cells which was used in current study [11].
Nuclear buds are micronucleus-like bodies attached to the nucleus by a thin nucleoplasmic connection formed during in S-phase of cell division [12]. They are obtained due to elimination of nuclear material by budding process, thus appear as sharp construction on end of the mother nucleus. These cells (NBUDs) are also referred to as Broken-eggs [27]. The Nucleoplasmic Bridges (NPBs) originate from dicentric chromosomes in which the centromeres have been pulled to the opposite poles of the cell in the anaphase. The formation of NPBs is chromosomal rearrangement while the later (NBUD formation) is a marker of gene amplification [11]. Lindberg H et al., have stated that nuclear buds occurred due to entrapment of DNA by nuclear membrane after division or leaked excess DNA from the nucleus [28]. The nuclear buds counts are shown in [Table/Fig-5]. Thus, to understand on incidence of gene amplifications and to improve the sensitivity of testing DNA damage, the NBUDs scoring is recommended. These findings are more sensitive biomarkers to MN analysed earlier and novel in the current study, considering for head and neck CT doses.
Fenech M and Morley A have reported on cells containing multiple micro nuclei (MMN cells) to be specifically found in radiation abuse cases. [27]. These micronuclear abnormalities cells are markers of clastrogenic damage occurring on chromosomes affected by genotoxins and radiation [9]. They have higher importance as markers of persistent damage or when cell PI is considered. These cells have 3-4 times higher chance of replicating and mutating. These cells are unlike the mononuclear micronucleus cells (transient cells) that could be eliminated based by regular exfoliation or by auto repair functions of the host immunity [12]. Thus, these cells were scored, considering specificity in radiation damage.
Thus, each of these micronuclear abnormalities has specific roles in reflecting DNA damage and chromosomal instabilities. The scoring of cells based on number of micronuclei, facilities further in understanding the altered cell kinetics, quantifiable by cell PI.
A study model has shown mean PI more than 2.0, wherein oxidative damage induced the micronuclei. [29]. Sinitsky M et al., have shown value of 3.0 for children below 18 years due to effect of added background radiations [13], while the report of CT scan in the present study was much higher i.e., PI of buccal cells was calculated to be 6.1. This indicates a 3 fold rise in cell proliferative capacity. The buccal cell PI, due to CT radiation dose is novel to current study.
The following recommendations are suggested considering the stochastic effects observed in the current study. Justification protocol (ALARA -As Low As Reasonably Achievable) should be followed while prescribing for a CT scan. The Computed Tomography Dose Index (CTDI) should be used to document every scan, repeated scans or multiple scans [30]. Whenever possible a CBCT to CT should be encouraged, considering upto 20 fold dose reductions [31]. However, a recent survey [32] in India to evaluate the primary method of radiographic investigation for planning dental implants showed that CT was found to be the common method when a 3D view was desired.
Topical mouthwash [33] having phenylephrine (14 mM to 136 mM) applied once to the oral cavity 20 minutes before therapeutic radiation (19-30 Gy) in rodent models provided 100% protection. The most common method, CT protection impregnated Shielding, offers 40-60% protection [34].
Regular bio-monitoring and antioxidant therapy is recommended for risk groups like technicians, radiologists, patients with multiple CT exposures. Micronuclear assay serves this purpose. Vitamins C and E, beta-carotene, coenzyme Q, vegetables, fruit and carotenoid rich products, have been shown to improve on DNA damage [35]. The patients having notable DNA damage or raised PI due to MNN can be prescribed antioxidants. In current study young patients (age group 20 year and below) were prescribed antioxidants (Oral Alpha Lipoic acid 600 mg/day for a course of 30 days).
The advantage of the study is the use of simple, non invasive method that can sensitively quantify MN cells and associated genotoxic changes. The disadvantage of the study is choosing a heterogeneous cohort indicated for head and neck CT scan. The study can be improvised by adopting cytochrome blocked micronuclear assay or by using fluorescence in situ hybridisation centromere staining technique. The specificity of the test for radiation can be increased with the scoring of minute NPBs. The computed software (ex Cellprolifer 2.0) that auto detect specified cell abnormalities also may benefit in quick scoring. Further studies can be performed with molecular correlations to incidence of micronuclear abnormities (e.g., BN/MN counts to non disjunctions/failed cytokinesis) for better understanding of initial stochastic effects.
Conclusion
Computed tomography scans taken for head and neck region cause significant DNA damage (MN cells), genotoxicity (BN cells, NBUDs and MMN cells) and raise the PI of buccal cells. The CT cervical spine has shown more damage than CT brain and facial bone and CT paranasal sinuses in terms of these micronuclear abnormalities. Protocols for prevention/management of DNA damage can be employed and this method can be used as a simple detective and prognostic tool.
kVp*: kilovoltpeak; mA†: milliampere; mSv‡: microsievert