Introduction
Diabetes mellitus is a chronic metabolic disorder that arises due to absolute or relative lack of insulin production by the beta-cells of the pancreas. Impaired secretion of this protein affects glucose metabolism, and consequently, results in hyperglycaemia [1]. Unregulated levels of blood glucose can lead to several debilitating conditions such as nephropathy, neuropathy, retinopathy, cardiovascular disease, stroke, and amputations of extremities [2]. About 90 to 95% of the patients are affected by type 2 diabetes [2] which is characterized primarily by insulin resistance, hyperinsulinemia, and beta-cell dysfunction [3].
Trace elements facilitate numerous biochemical reactions [4], including those related to insulin and glucose metabolism. The transport of zinc into the beta-cells of the pancreas is essential for insulin production and its efficient packaging into vesicles [5]. Moreover, zinc finger protein 407 [6] and zinc-alpha2-glycoprotein [7,8] have been shown to enhance the expression of the Glucose transporter type 4 (GLUT 4) protein in adipocytes and skeletal muscles, thereby mediating insulin-induced glucose uptake into these cells. Manganese is another trace element involved in carbohydrate metabolism [9]. Animal studies have indicated an association of manganese with optimal insulin synthesis and secretion [10]. Manganese also increases the binding of insulin to its receptor, thereby facilitating the physiological action of this hormone [11]. In a study conducted by Baly et al., manganese deficient rats had diminished insulin-stimulated glucose oxidation in the adipose tissue, and fewer insulin receptors compared to controls [12]. In contrast, elevated levels of copper [13] and iron [14,15] have been linked to increased oxidative stress, which in turn could lead to insulin resistance, impaired glucose tolerance, and type 2 diabetes [16]. Consistently, greater copper and iron statuses have been associated with increased insulin resistance in humans [17,18] Thus, copper and iron also are important while investigating trace element status in type 2 diabetes.
Research comparing zinc, manganese, copper and iron levels between type 2 diabetes patients and healthy individuals has reported inconsistent results. For example, some studies have indicated greater levels of these trace elements in type 2 diabetes patients compared to controls [4,19,20]; whereas other investigations have demonstrated reduced status [20-25]. Thus, this meta-analysis aimed to summarize the existing literature on difference in zinc, manganese, copper and iron levels between type 2 diabetic and nondiabetic individuals. Ceruloplasmin and ferritin levels were additionally utilized to indicate copper and iron statuses, respectively. It is hypothesized that diabetic patients will have lower zinc and manganese concentrations, and elevated copper and iron statuses compared to nondiabetic controls.
A secondary goal of this research is to explore the influence of age, Body Mass Index (BMI) and gender on the primary outcomes of interest by a moderator analysis. It is well established that age > 45 years, [26] gender [27] and overweight/ obesity [28] may influence trace element concentrations in humans, and are associated with a higher incidence of type 2 diabetes [29-31]. Moreover, the presence of fat depots around organs has been reported to negatively impact the status of minerals when compared to subcutaneous fat. Consequently, gender may influence the development of type 2 diabetes since the incidence of visceral adiposity is higher in men as compared to women [32].
Materials and Methods
Search Strategy
A literature search of Embase, PubMed, EBSCOHost, ScienceDirect, Scopus, Cochrane library and Web of Science electronic databases was conducted to identify studies published between 1970 and November 2016 investigating trace element concentrations in type 2 diabetes mellitus patients and healthy controls. Keywords used were type 2 diabetes, diabetes, hyperglycaemia, insulin, glucose, HbA1c, trace elements, micronutrients, zinc, manganese, copper, ceruloplasmin, iron and ferritin.
Data Extraction
Two investigators independently carried out the literature search and recorded the data in the database. The studies recorded by each investigator were then matched to remove duplicate studies. The titles and abstracts were read for each retrieved record to select studies meeting the inclusion criteria. The reference lists of all the retrieved studies also were reviewed by each investigator to minimize the chance of missing relevant studies.
Inclusion and Exclusion Criteria
The inclusion criteria for the studies that were retrieved using the search terms were: a) use of a cross-sectional or case-control design; b) reporting of plasma/serum values of zinc/copper/ceruloplasmin/iron/ferritin/manganese of type 2 diabetic patients and healthy controls; and b) absence of any diabetes-related complications in patients.
Studies were excluded if: a) they reported statistics jointly for patients with and without complications in type 2 diabetes group; b) the text was not available in English; and c) adequate information was not available in the text to calculate effect sizes.
All articles were assessed based on the inclusion/exclusion criteria and any disagreements were resolved by discussion with a nutrition professor having expertise in field of trace elements.
Statistical Analysis
The author, year and country for investigations that met the inclusion criteria were identified. The primary outcome, status of trace elements (zinc, copper, iron and manganese), in the control and diabetic groups were extracted. Other characteristics included for the analysis were type of biomarker (serum/plasma), age, BMI, and percentage of men in the control and diabetic arms. Difference in BMI between the control and diabetic groups was documented. The weighted average of age and proportion of males were determined, with the number of participants in each group representing the weights.
The primary studies reported trace element status in varying units of concentrations. Thus, a standardized mean difference, the bias corrected Hedges’ g, [33] was utilized as the effect size for the meta-analysis. The hypothesis to be tested was that the status of zinc and manganese would be lower in diabetic subjects, whereas that of copper, ceruloplasmin, and iron and ferritin would be higher. Since these trace elements have been shown to interact with each other, the use of a univariate model to determine their effect sizes could inflate Type I error rates. Methods utilized to handle dependency of multiple related outcomes in meta-analysis included Robust Variance Estimation (RVE) method and Generalized Least Squares (GLS) estimation. Unlike GLS estimation, the RVE approach does not require use of the correlations between pairs of multivariate outcomes. Thus, the RVE method was chosen for this meta-analysis due to the lack of reporting of correlations between trace elements in the primary studies.
Computations in the ensuing section were performed using the Statistical Package for Social Sciences (SPSS Version 22, Armonk, NY, 2013). The standard deviations of the trace element biomarker values in the control and diabetic groups, and the associated sample sizes were used to calculate the pooled sample variances. Trace element values of the diabetic subjects were subtracted from the controls when calculating effect sizes. Negative effects indicated that the trace element levels were lower in the diabetic arm as compared to the nondiabetic control. The resulting differences were divided by the pooled sample variances to compute Hedges g, to which the small-sample bias correction was applied. Bias-corrected Hedges g, thus obtained, represented the effect size for each study. The variance and 95% confidence intervals estimates for the effect sizes were calculated using the associated standardized mean difference and sample sizes in each group.
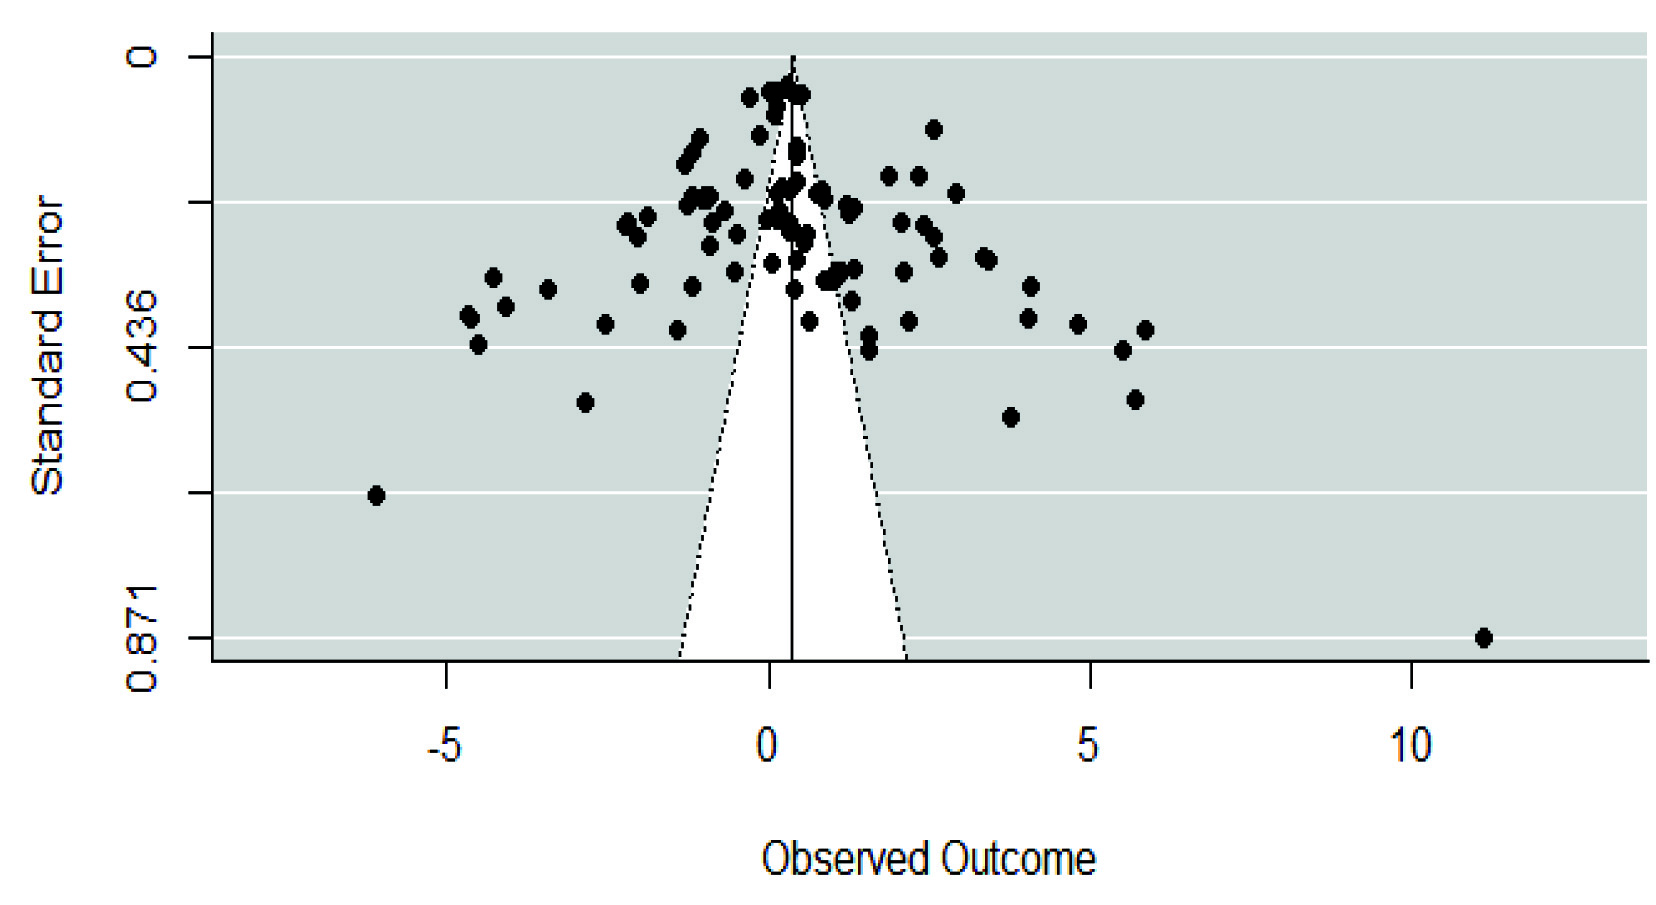
The statistical software, R with macro robumeta, were used to calculate the pooled average effect size and variance using the RVE method to apply Tipton’s [34] small sample bias correction. Statistics reported were 95% CIs, and two-sided Z-statistic to assess the statistical significance of the pooled average effect size. The effects of type of biomarker, age, difference in BMI, and percent males were evaluated by including these variables in the mixed-effects, meta-regression model. Publication bias was assessed by visualization of funnel plots. The I2 statistic was used to assess heterogeneity across studies. Cut-off values of 0, 25, 50 and 75% indicated no, low, moderate and high heterogeneity. A symmetrical funnel plot evidence for lack of publication bias in the meta-analysis. The Egger’s regression test also was performed, with p<0.05 suggesting significant publication bias.
Results
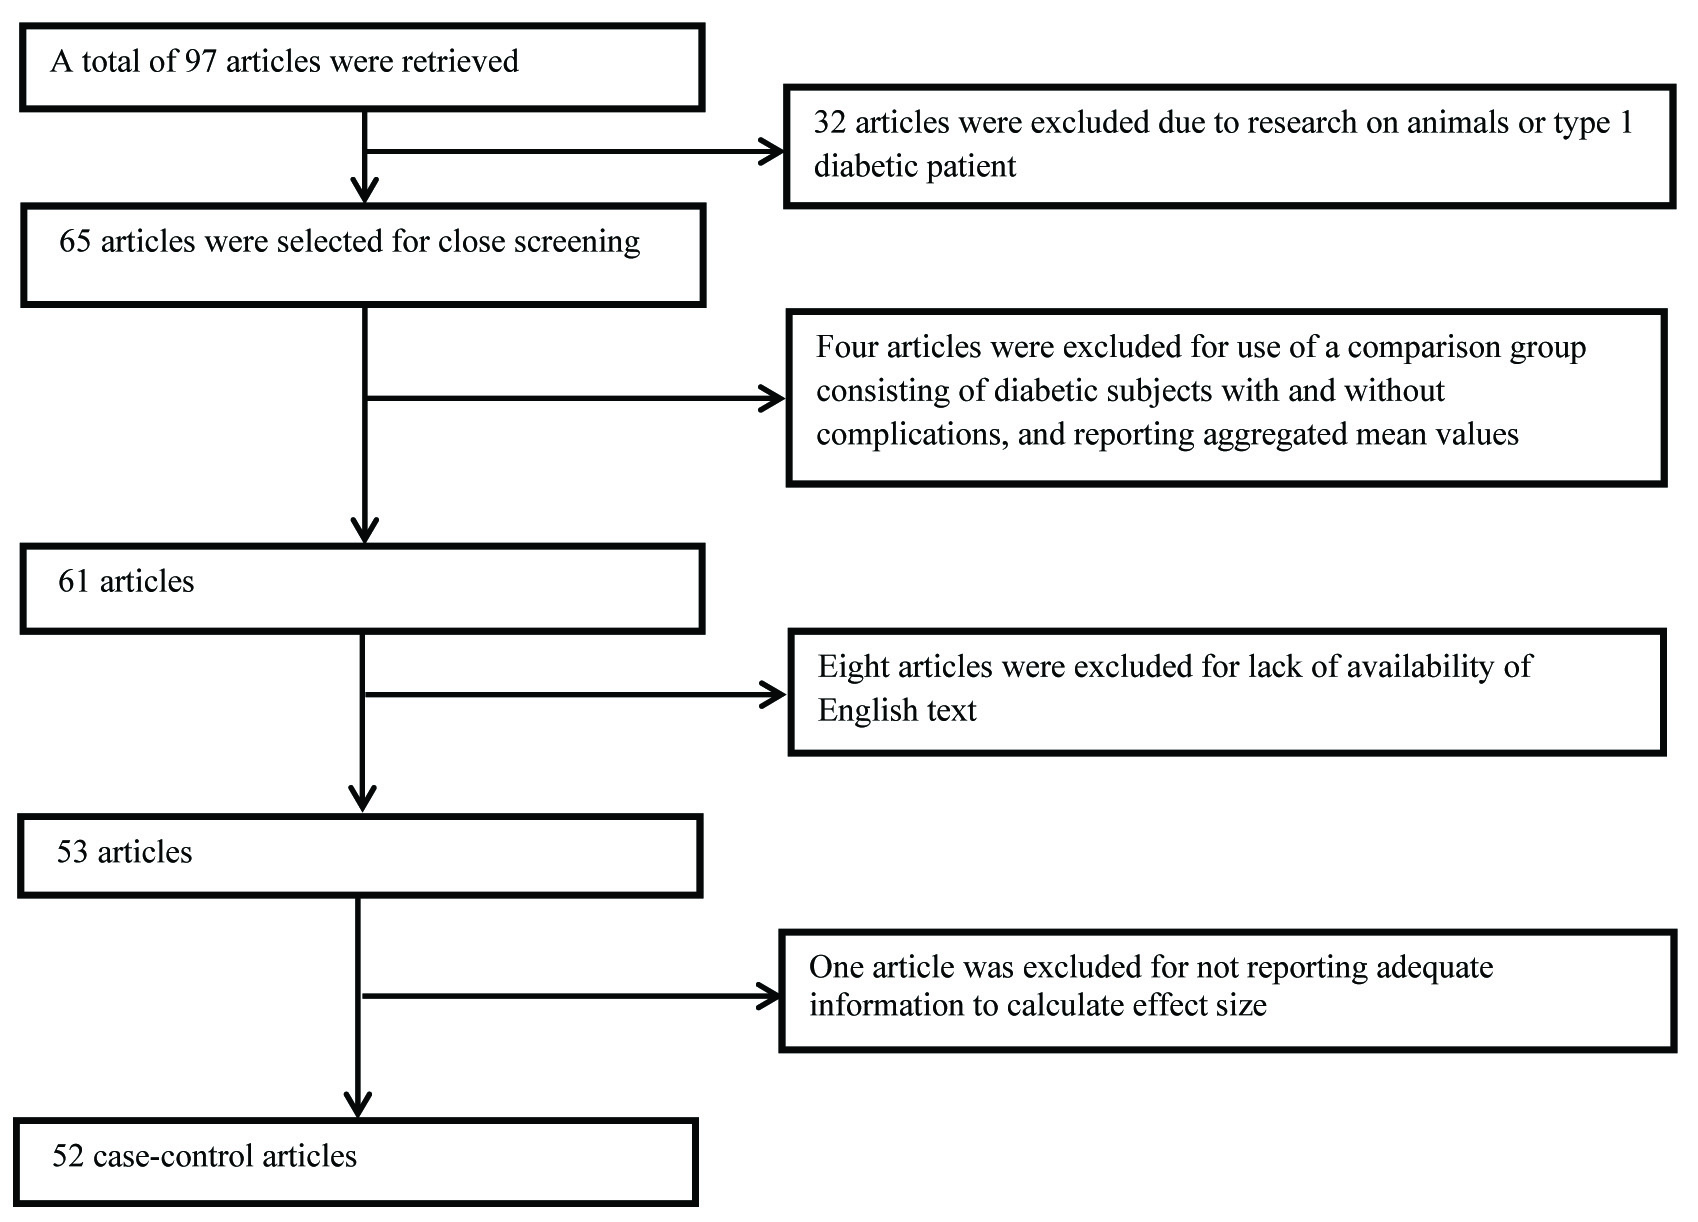
[Table/Fig-1] illustrates the flow diagram of the screening involved in the selection of articles for the meta-analysis. A total of 97 articles were retrieved, with a final number of 52 case-control studies [1,4,19,20,22-25,35-79] with 20183 participants were included in the meta-analysis.
Flow diagram of the screening process involved in inclusion of articles.
Summary of Included Studies
The characteristics of the included studies are presented in [Table/Fig-2]. The number of included studies reporting values for zinc, copper, ceruloplasmin, iron, ferritin, and manganese were 25, 20, 12, 9, 16 and 7, respectively. A few investigations reported mean trace element levels separately for men and women, thereby resulting in two effect sizes per study. Thus, the total number of effect sizes for zinc, copper, ceruloplasmin, iron, ferritin and manganese were 27, 21, 12, 10, 19 and 9, respectively.
Forest plot of effect size estimates and its 95% confidence intervals representing difference in zinc levels between healthy and diabetic subjects.
| First Author | Year | Country | Biomarker | Agea | Proportion of malesa | Difference in body mass indexb | Sample size | Effect size |
|---|
| Control | Diabetic | Zinc | Copper | Ceruloplasmin | Iron | Ferritin | Manganese |
|---|
| Pidduck | 1970 | England | Plasma | 52.95 | 100 | --c | 40 | 36 | 5.71 | 0.18 | -- | -- | -- | -- |
| Pidduck | 1970 | England | Plasma | 57.43 | 0 | -- | 46 | 42 | -4.07 | 1.26 | -- | -- | -- | -- |
| Mateo | 1978 | Spain | Serum | -- | -- | -- | 10 | 49 | 1.2 | 1.29 | 0.39 | -- | -- | -- |
| Raz | 1989 | Israel | Serum | 50.51 | 49.15 | 1.7 | 21 | 38 | 0.58 | -0.9 | -- | -- | -- | -- |
| Car | 1992 | Yugoslavia | Serum | 45.5 | 46.67 | 4.3 | 15 | 15 | -1.42 | -2.86 | -- | -- | -- | -- |
| Williams | 1995 | UK | Plasma | 51.55 | 46.15 | -- | 26 | 26 | -6.09 | -1.99 | -- | -- | -- | -- |
| Hughes | 1998 | Singapore | Serum | -- | 100 | 1.3 | 248 | 72 | -- | -- | -- | -- | 0.44 | -- |
| Hughes | 1998 | Singapore | Serum | -- | 0 | 1.5 | 282 | 54 | -- | -- | -- | -- | 0.46 | -- |
| Daimon | 1998 | Japan | Serum | 57.05 | -- | -- | 158 | 637 | -- | -- | 2.58 | -- | -- | -- |
| Ekmekcioglu | 2000 | Austria | Plasma | 67.05 | -- | 0 | 50 | 53 | 0.31 | 0.2 | -- | --d | -- | 0.2 |
| Kim | 2000 | Korea | Serum | 57.03 | 46.67 | 2.4 | 25 | 50 | -- | -- | -- | -- | 0.32 | -- |
| Olaniyan | 2001 | Nigeria | Serum | 57.03 | 39.81 | -- | 50 | 53 | -0.99 | 0.74 | -- | -- | -- | -- |
| Ekin | 2003 | Turkey | Serum | 56.98 | 0 | 1.2 | 29 | 108 | -4.27 | --d | -- | 5.86 | -- | --d |
| Ekin | 2003 | Turkey | Serum | 56.28 | 100 | 1.6 | 21 | 92 | -4.64 | --d | -- | 4.83 | -- | --d |
| Memisogullari | 2003 | Turkey | Serum | -- | -- | -- | 18 | 21 | -- | -- | 0.86 | -- | -- | -- |
| Memisogullari | 2004 | Turkey | Serum | 54.49 | -- | -- | 21 | 29 | -- | -- | 1.35 | -- | -- | -- |
| Qin | 2004 | China | Serum | -- | -- | -- | 110 | 104 | -- | -- | 2.33 | -- | -- | -- |
| Elis | 2004 | Israel | Serum | 63 | 40.59 | -- | 40 | 29 | -- | -- | -- | -0.04 | 0.15 | -- |
| Jiang | 2004 | USA | Plasma | 56.45 | 0 | 4.1 | 716 | 698 | -- | -- | -- | -- | 0.42 | -- |
| Elsammak | 2005 | Egypt | Serum | -- | -- | -- | 18 | 22 | -- | -- | -- | -- | -1.19 | -- |
| Kaviarasan | 2005 | India | Plasma | 54.24 | -- | 5.21 | 18 | 20 | -- | -- | 3.76 | -- | -- | -- |
| Virgolici | 2005 | Romania | Plasma | 53.4 | 50 | 11.4 | 20 | 20 | -- | -- | 1.02 | -- | -- | -- |
| Al-Maroof | 2006 | Iraq | Serum | 45.73 | -- | 1.69 | 133 | 101 | -1.18 | -- | -- | -- | -- | -- |
| Abou-Shousha | 2006 | Egypt | Serum | 48.52 | 0 | -- | 10 | 20 | -- | -- | -- | -- | 0.65 | -- |
| Lee | 2006 | Korea | Serum | 58.6 | 67.35 | -- | 47 | 48 | -- | -- | -- | 0.15 | 0.86 | -- |
| Adewumi | 2007 | Nigeria | Serum | 46.67 | 100 | 6.25 | 50 | 28 | -- | --d | -- | -- | -- | -0.89 |
| Adewumi | 2007 | Nigeria | Serum | 44.12 | 0 | 3.43 | 40 | 62 | -- | --d | -- | -- | -- | -1.03 |
| Viktorinova | 2009 | Slovak | Plasma | 42.49 | 47.46 | 0.55 | 34 | 25 | -0.49 | 0.53 | -- | -- | -- | -- |
| Rajpathak | 2009 | USA | Serum | 50.3 | 36.4 | 1.5 | 280 | 280 | -- | -- | -- | -- | 0.11 | -- |
| Flores | 2010 | Mexico | Serum | -- | -- | -- | 12 | 76 | 0.04 | 1.05 | -- | -- | -- | 1.15 |
| Sarkar | 2010 | India | Plasma | 54.39 | 62.19 | -- | 78 | 123 | -- | 2.94 | -1.3 | -- | -- | -- |
| Ashourpour | 2010 | Iran | Serum | 53.29 | -- | 0.29 | 53 | 54 | -- | -- | -- | -- | 3.41 | -- |
| Chacko | 2010 | India | Serum | -- | 52.87 | -- | 47 | 40 | -- | -- | 11.13 | -- | -- | -- |
| Nasli-Esfahani | 2011 | Iran | Serum | 50.6 | 34.96 | -- | 151 | 150 | -1.05 | --d | -- | -- | -- | -0.13 |
| Kim | 2011 | Korea | Serum | 51.27 | 100 | 0.8 | 3384 | 727 | -- | -- | -- | -- | 0.3 | -- |
| Kim | 2011 | Korea | Serum | 50.17 | 0 | 2.2 | 3869 | 327 | -- | -- | -- | -- | 0.54 | -- |
| Ferdousi | 2012 | Bangladesh | Serum | -- | -- | 5.15 | 60 | 60 | -0.38 | 0.46 | -- | -- | -- | -- |
| Savu | 2012 | Romania | Plasma | 40.99 | 41 | -- | 15 | 15 | -- | 1.56 | 1.55 | -- | -- | -- |
| Ganesh | 2012 | India | Serum | 42.7 | 38.35 | -1.86 | 30 | 30 | -- | -- | -- | 0.39 | 0.6 | -- |
| Praveeena | 2013 | India | Serum | -- | -- | -- | 40 | 40 | -3.41 | -- | -- | -- | -- | -- |
| Farid | 2013 | Saudi Arabia | Serum | 59.51 | 100 | -- | 55 | 55 | -1.19 | 0.84 | -- | -- | -- | --d |
| Dosa | 2013 | Romania | Plasma | -- | -- | 3.86 | 17 | 30 | -2.53 | 0.44 | -- | -- | -- | -- |
| Kundu | 2013 | India | Serum | -- | -- | | 30 | 30 | -- | -- | -- | 0.33 | 2.1 | -- |
| Santa | 2014 | India | Serum | -- | -- | 5.42 | 40 | 60 | -4.66 | 5.5 | -- | -- | -- | -- |
| Oyedeji | 2014 | Nigeria | Plasma | -- | 0 | -- | 35 | 50 | -2.03 | --d | -- | 2.66 | -- | -- |
| Kumar | 2014 | India | Serum | 48.5 | 74 | -- | 50 | 50 | -1.86 | 2.07 | -- | -- | -- | -- |
| Alam | 2014 | Pakistan | Serum | 40.4 | -- | -- | 44 | 67 | -- | -- | -- | -- | 2.4 | -- |
| Nagarajrao | 2015 | Saudi Arabia | Serum | 49.43 | 55.24 | 0.04 | 58 | 47 | -2.18 | 4.09 | -- | 3.33 | -- | -- |
| Maheshwari | 2015 | India | Serum | 48.28 | | | 50 | 50 | | | -- | | 2.58 | |
| Badran | 2016 | Egypt | Serum | 52.88 | 57.89 | 0.96 | 36 | 40 | -4.51 | --d | -- | --d | -- | --d |
| Atari-Hajipirlo | 2016 | Iran | Serum | 52.46 | 53.12 | -- | 50 | 46 | -1.25 | 1.21 | -- | 1.35 | -- | -- |
| Wang | 2016 | China | Serum | 67.58 | 100 | 0.87 | 529 | 289 | -- | -- | -- | -- | -- | 0.15 |
| Wang | 2016 | China | Serum | 67.63 | 0 | -2 | 751 | 494 | -- | -- | -- | -- | -- | -0.29 |
| Devi | 2016 | India | Serum | -- | 47.5 | -- | 40 | 40 | -0.67 | 4.06 | -- | -- | -- | -- |
| Goud | 2016 | India | Serum | -- | -- | -- | 20 | 20 | -- | -- | 0.97 | -0.51 | 2.17 | -- |
| Jeppu | 2016 | Malaysia | Serum | -- | -- | -- | 50 | 50 | -- | -- | -2.21 | -- | -- | -- |
| Borah | 2016 | India | Serum | 53.93 | 56.5 | 2.17 | 92 | 92 | -- | -- | -- | -- | 1.87 | -- |
| Eva | 2016 | Banglade | Serum | 47.79 | 54 | 0.36 | 50 | 50 | -0.96 | -- | -- | -- | -- | -0.9 |
| Zhang | 2017 | China | Serum | 55.91 | 34.68 | 1.2 | 1327 | 510 | 0.16 | 0.15 | -- | -- | -- | 0.02 |
a Represents the weighted average where the weights are the number of individuals in control and diabetic groups
b Represents the difference in the body mass index between diabetic and control groups
c Not reported in the primary study
c Data did not meet the inclusion criteria
Pooled Average Effect Size for Zinc, Copper, Ceruloplasmin, Iron, Ferritin and Manganese
The Forest plots in [Table/Fig-3,4,5,6,7 and 8] depict the average pooled effect size, 95% CI and statistical significance for zinc, copper, ceruloplasmin, iron, ferritin and manganese, respectively. For investigations that report separate values for men and women, a weighted average of the effect size was calculated with the number in each gender as weights. Zinc levels were significantly lower in type 2 diabetic subjects when compared to non-diabetic individuals (pooled effect size = -1.73, p<0.01), whereas that for copper (pooled effect size = 1.10, p<0.05) and ferritin (pooled effect size = 1.05, p<0.05) were significantly higher. Patients diagnosed with type 2 diabetes also had higher values for ceruloplasmin (pooled effect size = 1.85, p=0.06) and iron (pooled effect size = 1.42, p=0.06), but lower manganese concentrations (pooled effect size = -0.27, p=0.34) than nondiabetic controls. However, these effect sizes were not significant. The I2 statistic for the meta-analysis was 97.6%.
Forest plot of effect size estimates and its 95% confidence intervals representing difference in zinc levels between healthy and diabetic subjects.
| First Author | Year | Effect Size (95% CI) | Forest Plot | Weight (%)a |
|---|
| Williams | 1995 | -6.09 (-7.38, -4.80) |  | 1.37 |
| Santa | 2014 | -4.66 (-5.42, -3.90) | 2.31 |
| Badran | 2016 | -4.51 (-5.36, -3.66) | 2.06 |
| Ekinb | 2003 | -4.44 (-5.14, -3.74) | 2.50 |
| Praveeena | 2013 | -3.41 (-4.09, -2.73) | 2.59 |
| Dosa | 2013 | -2.53 (-3.31, -1.75) | 2.24 |
| Nagarajrao | 2015 | -2.18 (-2.66, -1.70) | 3.66 |
| Oyedeji | 2014 | -2.03 (-2.55, -1.51) | 3.39 |
| Kumar | 2014 | -1.86 (-2.34, -1.38) | 3.66 |
| Car | 1991 | -1.42 (-2.23, -0.61) | 3.66 |
| Atari-Hajipirlo | 2016 | -1.25 (-1.69, -0.81) | 4.01 |
| Farid | 2013 | -1.19 (-1.58, -0.80) | 4.48 |
| Maroof | 2006 | -1.18 (-1.46, -0.90) | 6.34 |
| Nasli-Esfahani | 2011 | -1.05 (-1.33, -0.77) | 6.34 |
| Olaniyan | 2001 | -0.99 (-1.38, -0.60) | 4.48 |
| Eva | 2016 | -0.96 (-1.35, -0.57) | 4.48 |
| Devi | 2016 | -0.67 (-1.11, -0.23) | 4.01 |
| Viktorinova | 2009 | -0.49 (-1.01, 0.03) | 3.39 |
| Ferdousi | 2012 | -0.38 (-0.72, -0.04) | 5.18 |
| Flores | 2010 | 0.04 (-0.58, 0.66) | 2.83 |
| Zhang | 2017 | 0.16 (0.05, 0.27) | 16.37 |
| Ekmekcioglu | 2000 | 0.31 (-0.08, 0.70) | 4.48 |
| Pidducka | 1970 | 0.46 (-0.41, 1.34) | 2.00 |
| Raz | 1989 | 0.58 (0.03, 1.13) | 3.17 |
| Mateo | 1978 | 1.30 (0.59, 2.01) | 2.49 |
| Pooled effect size | | -1.73 (-2.50, -0.97) | 100 |
| Test for Overall Effect: Z= -4.46 (p<0.01) | |
aThe weight of each study indicates its influence on the pooled effect size. A higher percentage weight is shown by a larger box and narrower confidence interval for the respective study in the forest plot
bData represented as weighted average of the effect size for men and women
Forest plot of effect size estimates and its 95% confidence intervals representing difference in copper levels between healthy and diabetic subjects.
| First Author | Year | Effect Size (95% CI) | Forest Plot | Weight (%)a |
|---|
| Car | 1991 | -2.86 (-3.88, -1.84) | 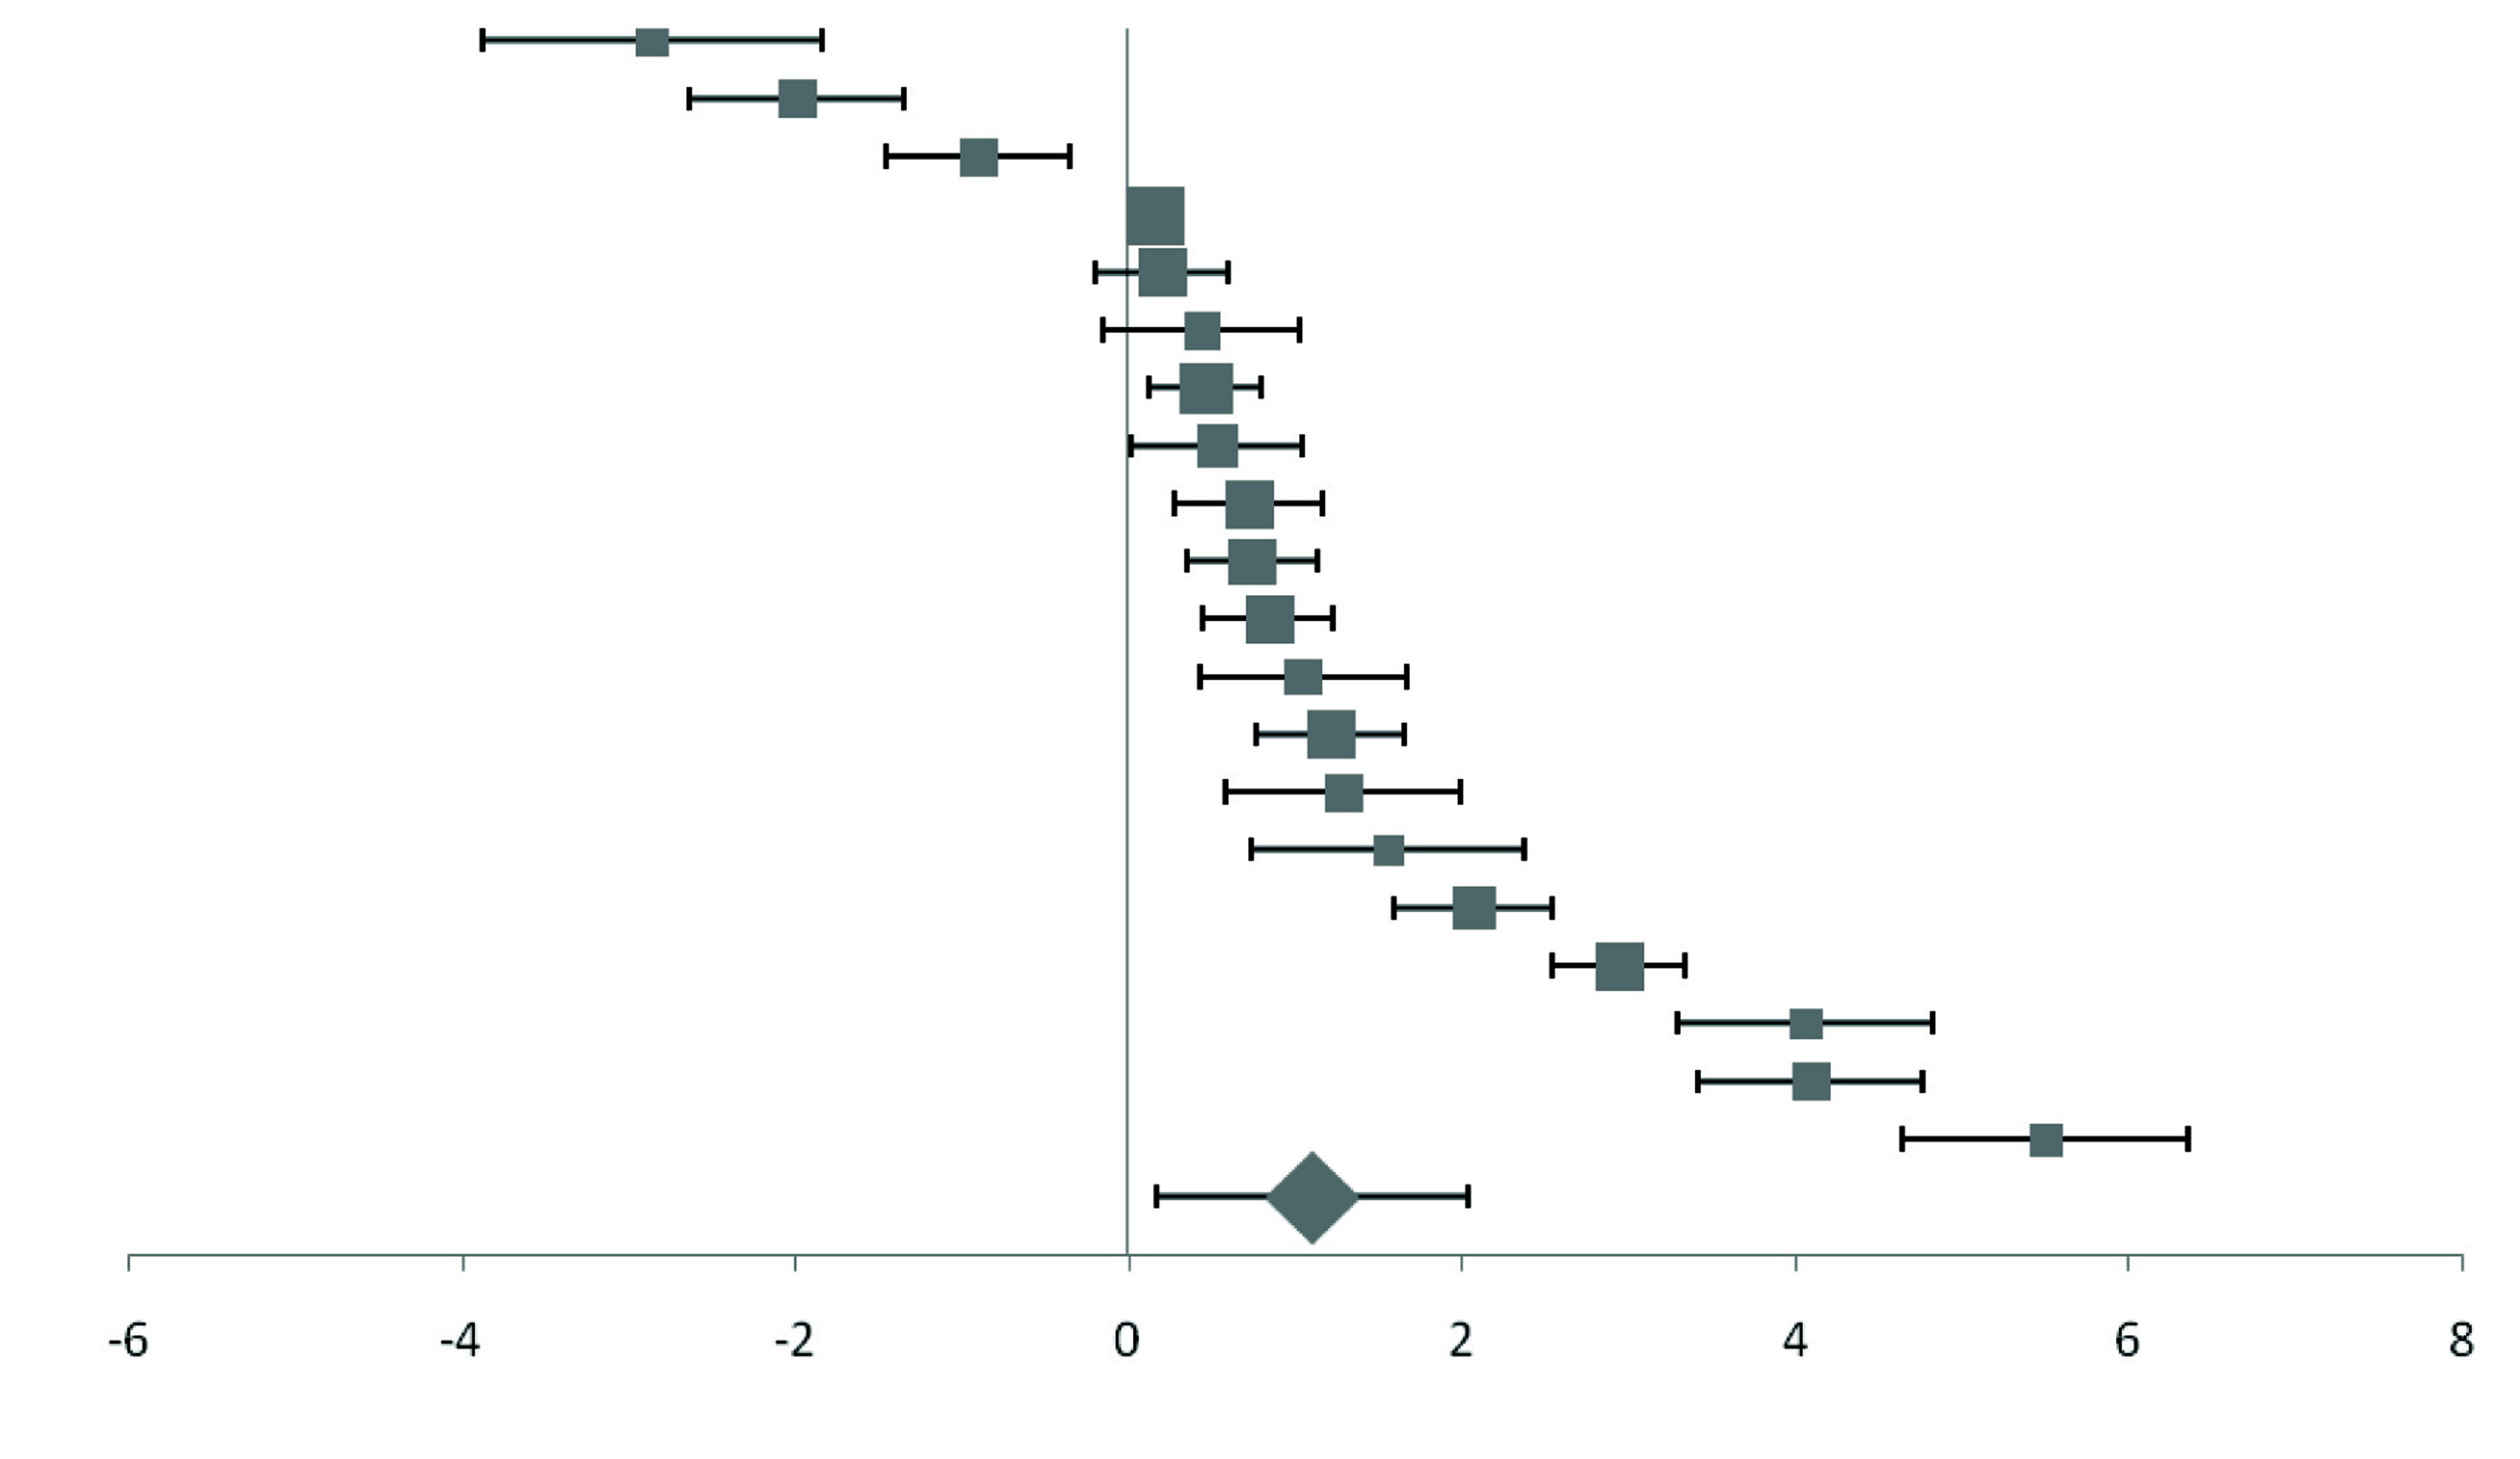 | 2.17 |
| Williams | 1995 | -1.99 (-2.64, -1.34) | 3.4 |
| Raz | 1989 | -0.90 (-1.45, -0.35) | 3.98 |
| Zhang | 2017 | 0.15 (0.04, 0.26) | 20.57 |
| Ekmekcioglu | 2000 | 0.20 (-0.19, 0.59) | 5.63 |
| Dosa | 2013 | 0.44 (-0.15, 1.03) | 3.76 |
| Ferdousi | 2012 | 0.46 (0.12, 0.80) | 6.51 |
| Viktorinova | 2009 | 0.53 (0.01, 1.05) | 4.26 |
| Pidduckb | 1970 | 0.72 (0.28, 1.16) | 5.04 |
| Olaniyan | 2001 | 0.74 (0.35, 1.13) | 5.63 |
| Farid | 2013 | 0.84 (0.45, 1.23) | 5.63 |
| Flores | 2010 | 1.05 (0.43, 1.67) | 3.56 |
| Atari-Hajipirlo | 2016 | 1.21 (0.77, 1.65) | 5.04 |
| Mateo | 1978 | 1.29 (0.58, 2.00) | 3.13 |
| Savu | 2012 | 1.56 (0.74, 2.38) | 2.7 |
| Kumar | 2014 | 2.07 (1.59, 2.55) | 4.6 |
| Sarkar | 2010 | 2.94 (2.55, 3.33) | 5.63 |
| Devi | 2016 | 4.06 (3.30, 4.82) | 2.91 |
| Nagarajrao | 2015 | 4.09 (3.41, 4.77) | 3.25 |
| Santa | 2014 | 5.50 (4.65, 6.35) | 2.59 |
| Pooled effect size | | 1.10 (0.22, 1.99) | 100 |
| Test for Overall Effect: Z= 2.46 (p<0.05) | |
aThe weight of each study indicates its influence on the pooled effect size. A higher percentage weight is shown by a larger box and narrower confidence interval for the respective study in the forest plot
bData represented as weighted average of the effect size for men and women
Forest plot of effect size estimates and its 95% confidence intervals representing difference in ceruloplasmin levels between healthy and diabetic subjects.
| First Author | Year | Effect Size (95% CI) | Forest Plot | Weight (%)a |
|---|
| Jeppu | 2016 | -2.21 (-2.69, -1.73) | 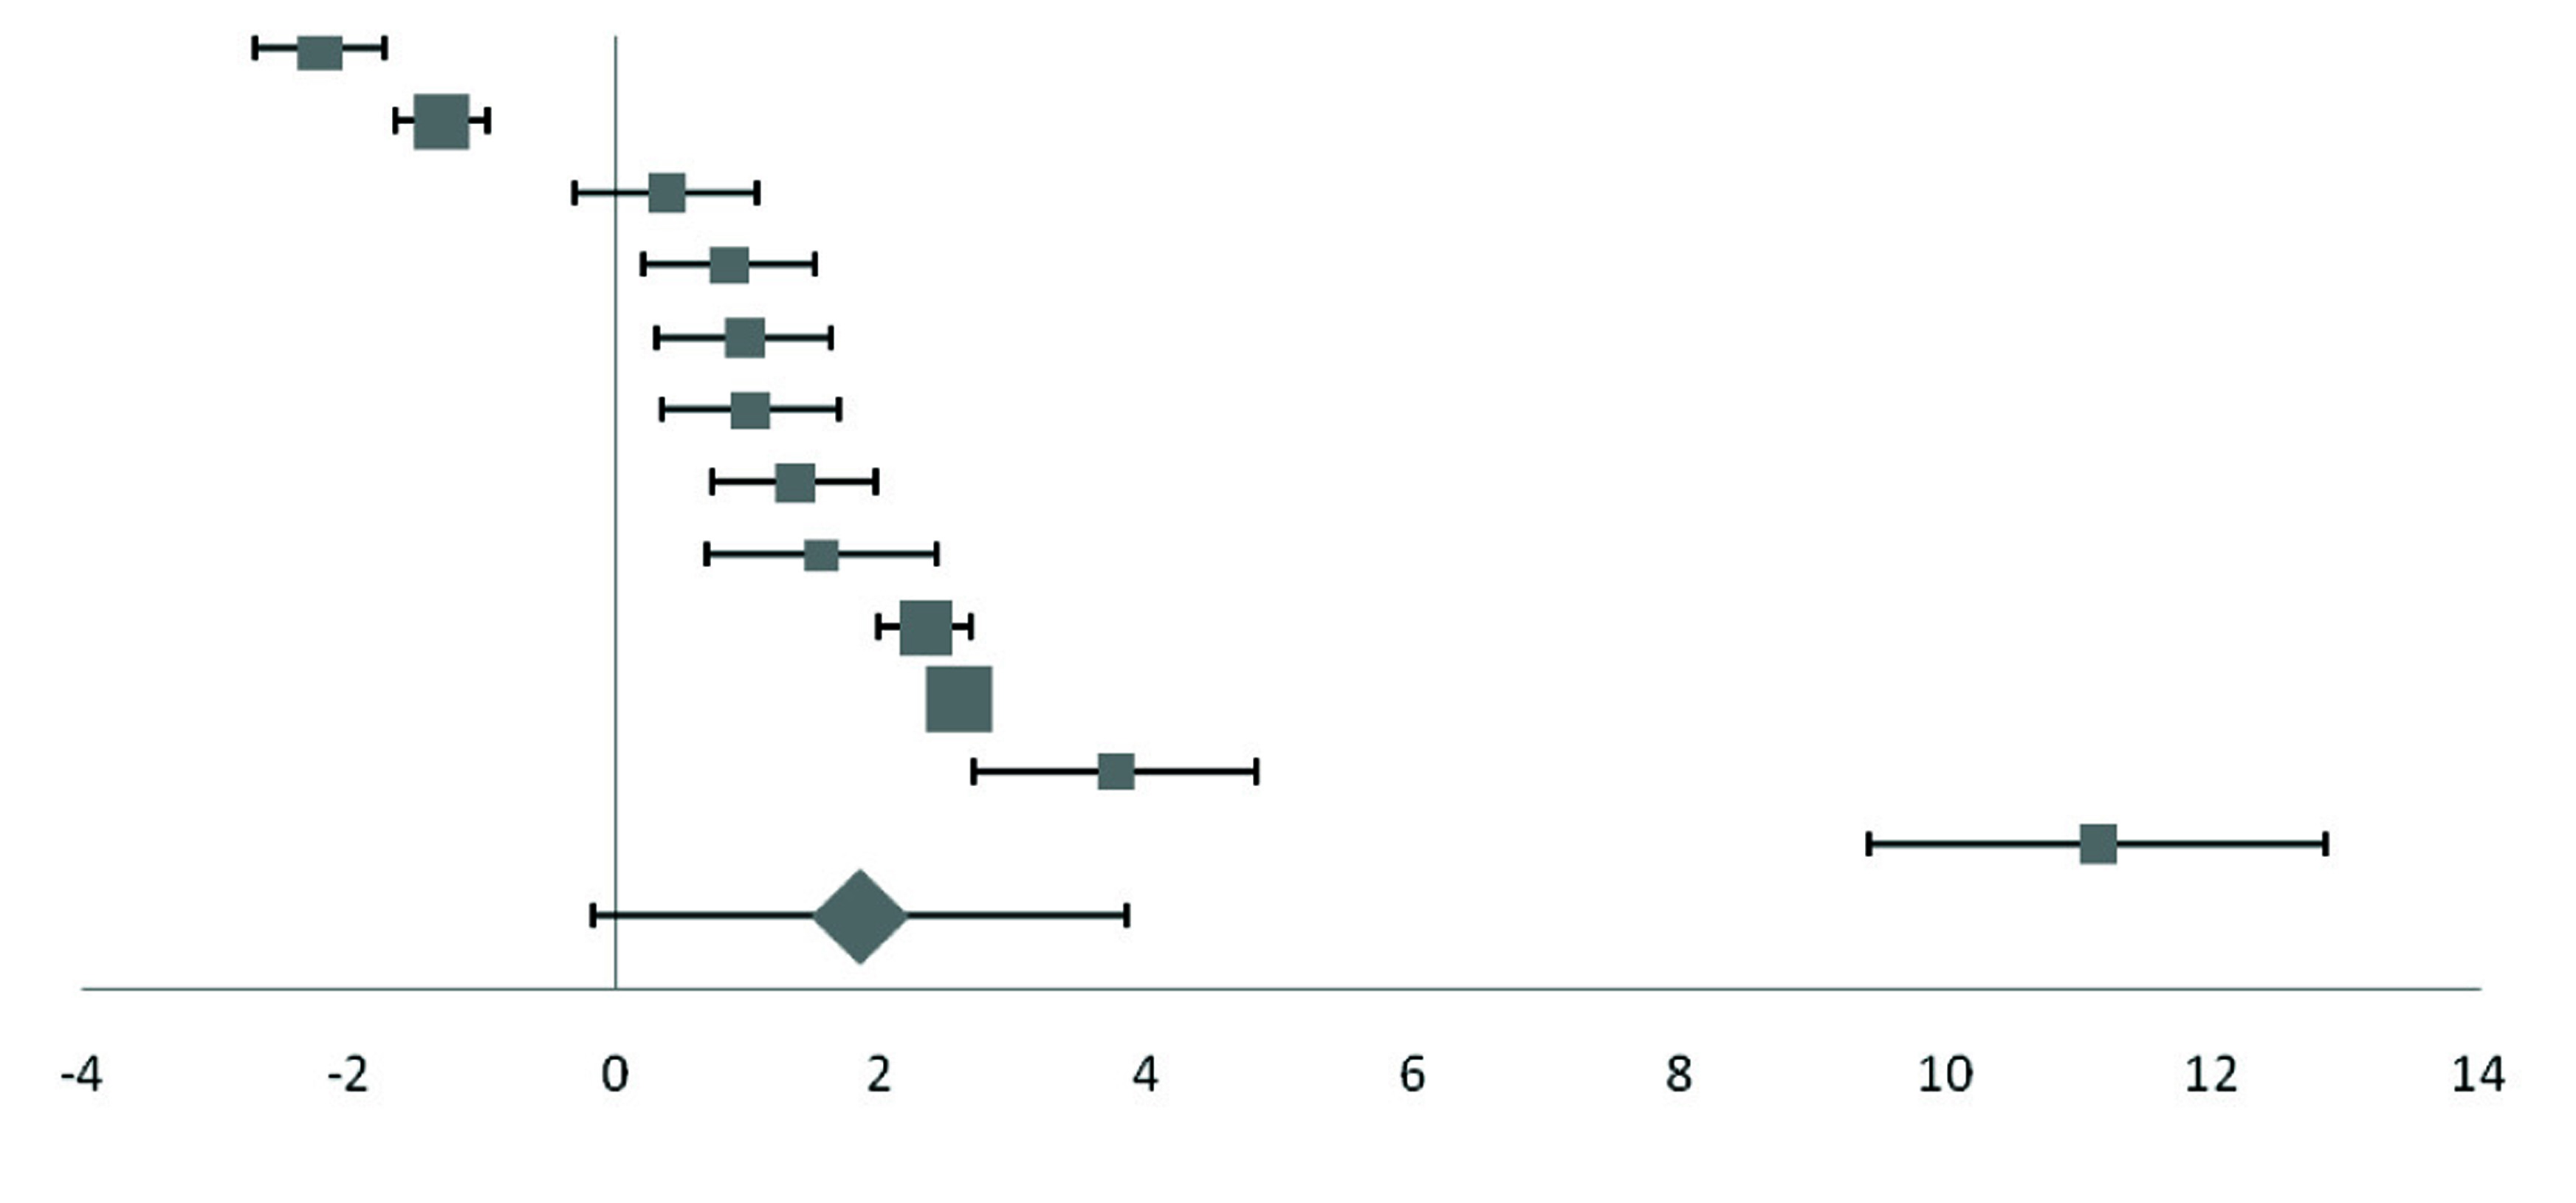 | 8.88 |
| Sarkar | 2010 | -1.30 (-1.64, -0.96) | 12.56 |
| Mateo | 1978 | 0.39 (-0.29, 1.07) | 6.28 |
| Memisogullari | 2003 | 0.86 (0.21, 1.51) | 6.56 |
| Goud | 2016 | 0.97 (0.32, 1.62) | 6.56 |
| Virgolici | 2005 | 1.02 (0.36, 1.68) | 6.47 |
| Memisogullari R | 2004 | 1.35 (0.73, 1.97) | 6.88 |
| Savu | 2012 | 1.55 (0.68, 2.41) | 4.94 |
| Qin | 2004 | 2.33 (1.99, 2.67) | 12.56 |
| Daimon | 1998 | 2.58 (2.38, 2.78) | 21.76 |
| Kaviarasan K | 2005 | 3.76 (2.70, 4.82) | 4.04 |
| Chacko | 2010 | 11.13 (9.42, 12.84) | 2.5 |
| Pooled effect size | | 1.85 (0.10, 3.59) | 100 |
| Test for Overall Effect: Z= 2.07 (p<0.10) | |
aThe weight of each study indicates its influence on the pooled effect size. A higher percentage weight is shown by a larger box and narrower confidence interval for the respective study in the forest plot
Forest plot of effect size estimates and its 95% confidence intervals representing difference in iron levels between healthy and diabetic subjects.
| First Author | Year | Effect Size (95% CI) | Forest Plot | Weight (%)a |
|---|
| Goud | 2016 | -0.51 (-1.13, 0.11) | 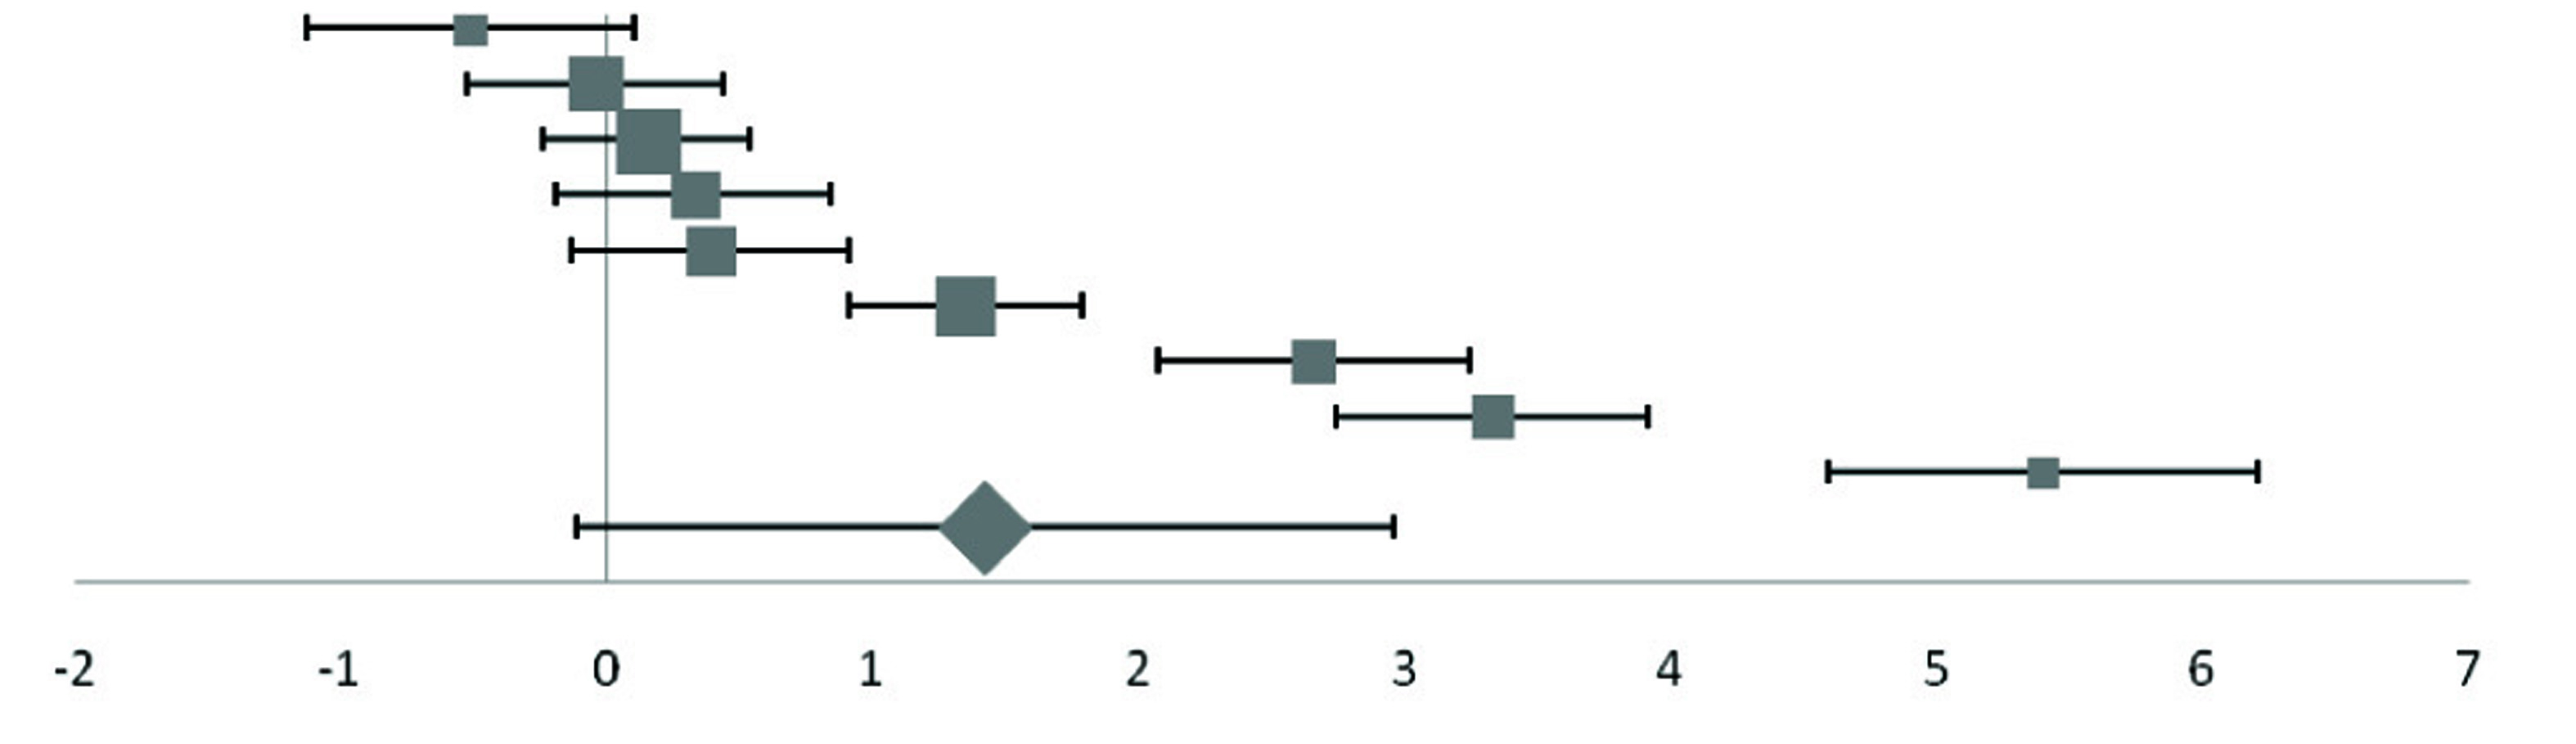 | 9.48 |
| Elis | 2004 | -0.04 (-0.52, 0.44) | 12.23 |
| Lee | 2006 | 0.15 (-0.24, 0.54) | 14.98 |
| Kundu | 2013 | 0.33 (-0.19, 0.85) | 11.33 |
| Ganesh | 2012 | 0.39 (-0.13, 0.91) | 11.33 |
| Atari-Hajipirlo | 2016 | 1.35 (0.91, 1.79) | 13.4 |
| Oyedeji | 2014 | 2.66 (2.07, 3.25) | 9.99 |
| Nagararao | 2015 | 3.33 (2.74, 3.92) | 9.99 |
| Ekinb | 2003 | 5.40 (4.59, 6.21) | 7.27 |
| Pooled effect size | | 1.42 (0.13, 2.71) | 100 |
| Test for Overall Effect: Z=2.15 (p<0.10) | |
aThe weight of each study indicates its influence on the pooled effect size. A higher percentage weight is shown by a larger box and narrower confidence interval for the respective study in the forest plot
bData represented as weighted average of the effect size for men and women
Forest plot of effect size estimates and its 95% confidence intervals representing difference in ferritin levels between healthy and diabetic subjects.
| First Author | Year | Effect Size (95% CI) | Forest Plot | Weight (%)a |
|---|
| Elsammak | 2005 | -1.19 (-1.87, -0.51) | 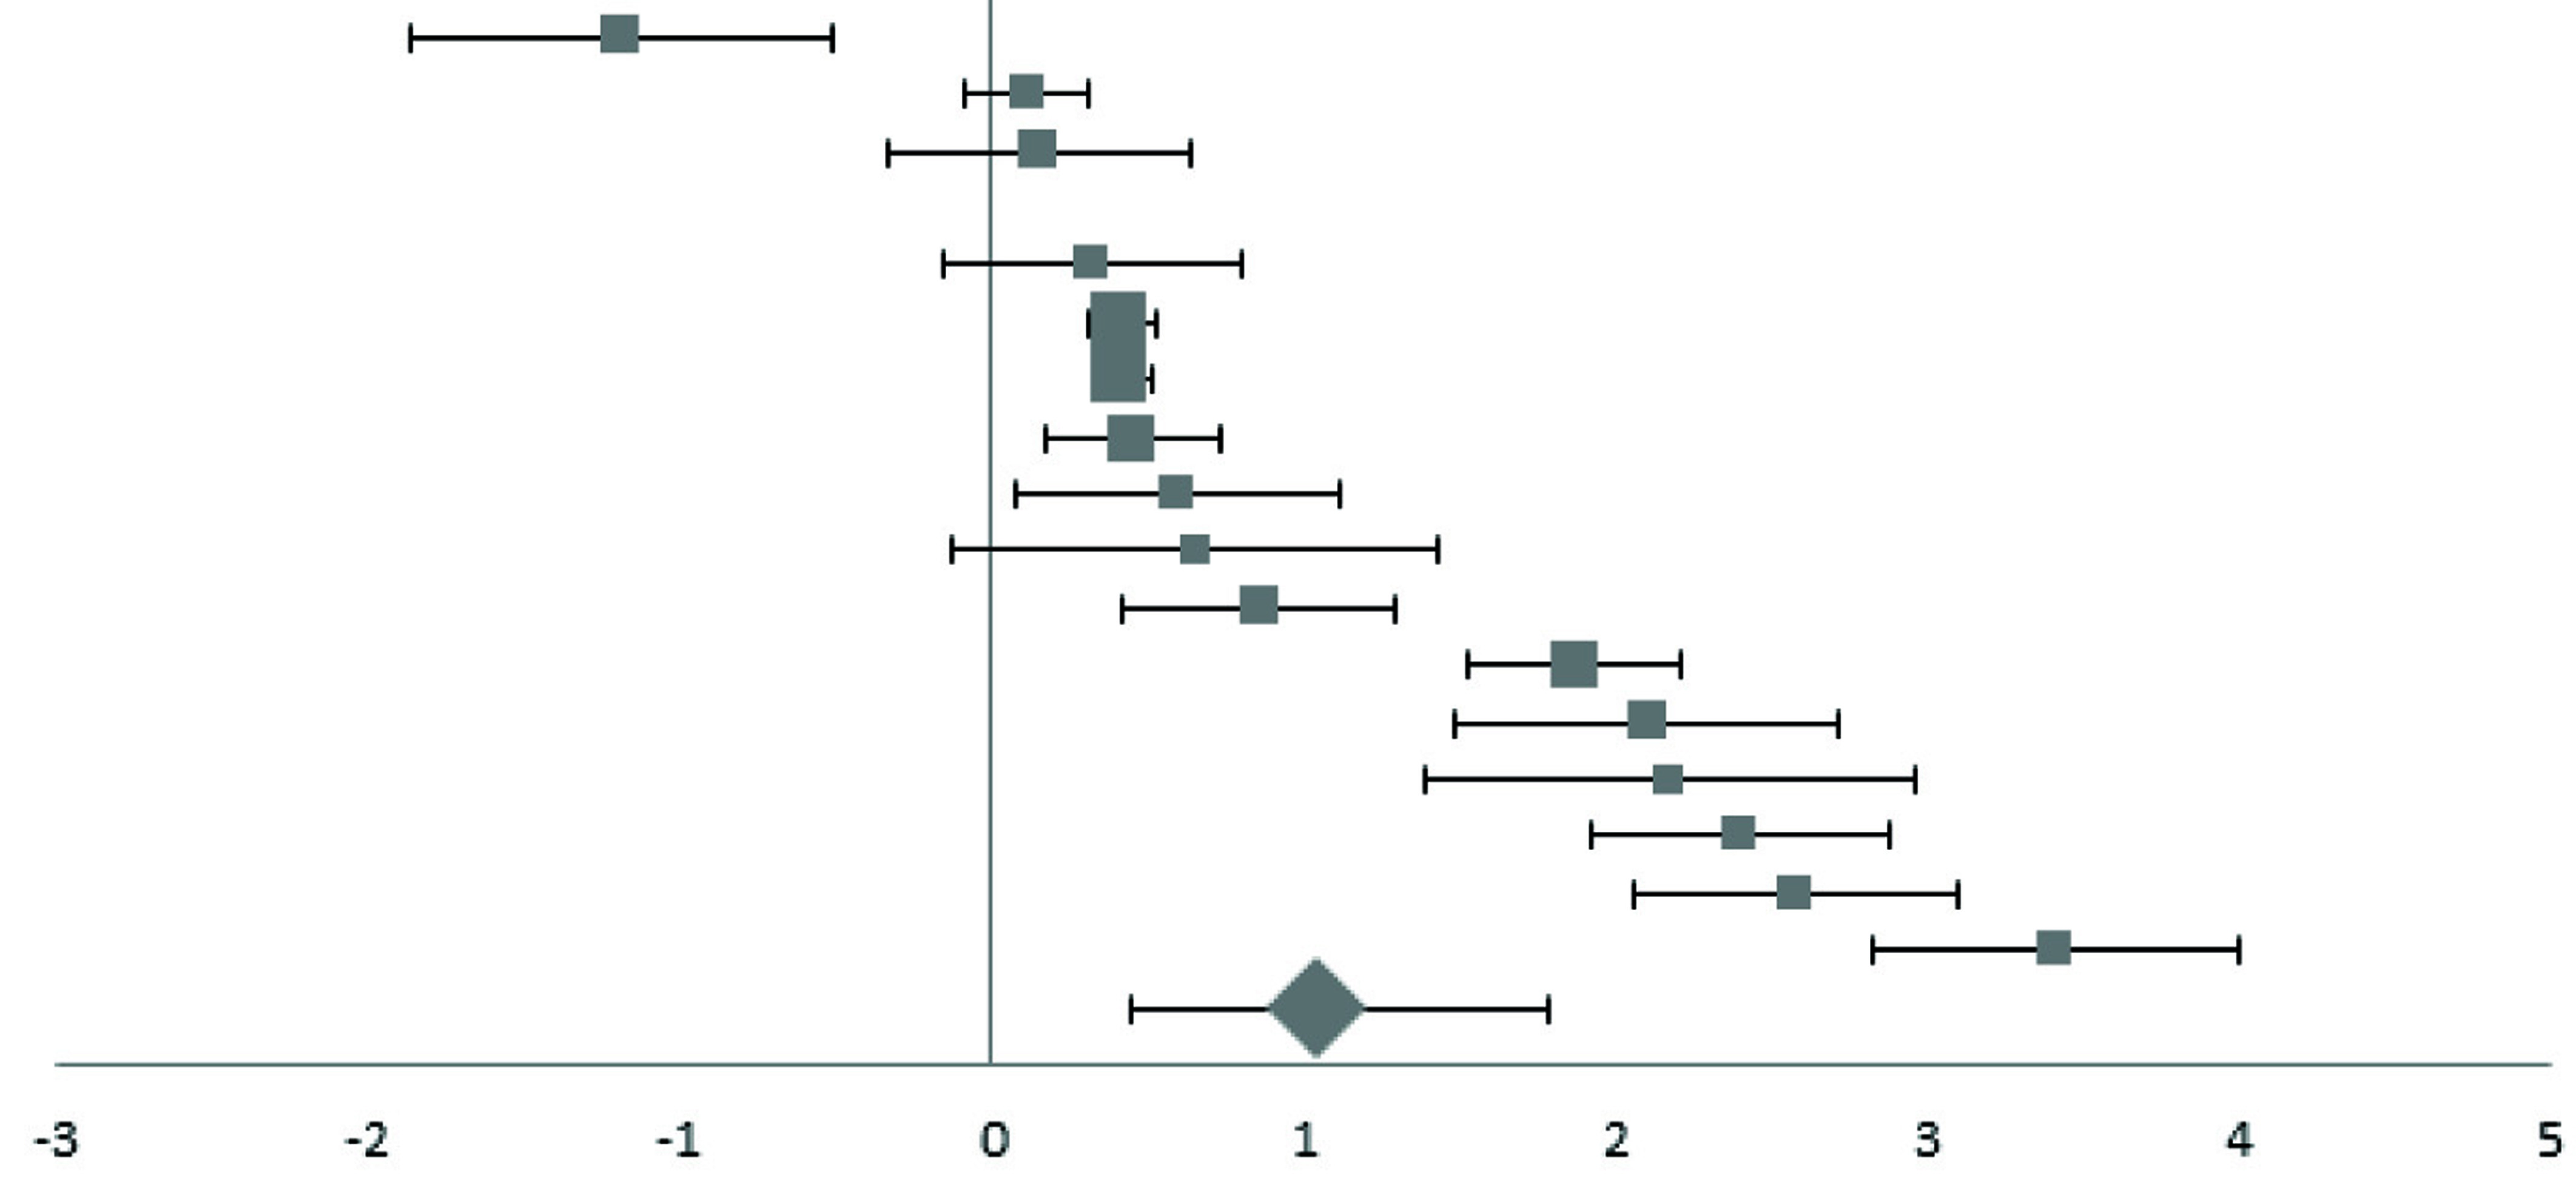 | 2.75 |
| Rajpathak | 2009 | 0.11 (-0.09, 0.31) | 9.54 |
| Elis | 2004 | 0.15 (-0.33, 0.63) | 3.89 |
| Kim | 2000 | 0.32 (-0.16, 0.80) | 3.89 |
| Kimb | 2011 | 0.42 (0.32, 0.52) | 19.05 |
| Jiang | 2004 | 0.42 (0.31, 0.53) | 17.41 |
| Hughesb | 1998 | 0.45 (0.17, 0.73) | 6.74 |
| Ganesh | 2012 | 0.60 (0.08, 1.12) | 3.6 |
| Abou-Shousha | 2006 | 0.65 (-0.13, 1.43) | 2.38 |
| Lee | 2006 | 0.86 (0.42, 1.30) | 4.27 |
| Borah | 2016 | 1.87 (1.53, 2.21) | 5.51 |
| Kundu | 2013 | 2.10 (1.48, 2.72) | 3.02 |
| Goud | 2016 | 2.17 (1.39, 2.95) | 2.38 |
| Alam | 2014 | 2.40 (1.92, 2.88) | 3.89 |
| Maheshwari | 2015 | 2.58 (2.06, 3.10) | 3.6 |
| Ashourpour | 2010 | 3.41 (2.82, 4.00) | 3.18 |
| Pooled effect size | | 1.05 (0.38, 1.60) | 100 |
| Test for Overall Effect: Z= 3.17 (p<0.01) | |
aThe weight of each study indicates its influence on the pooled effect size. A higher percentage weight is shown by a larger box and narrower confidence interval for the respective study in the forest plot
bData represented as weighted average of the effect size for men and women
Forest plot of effect size estimates and its 95% confidence intervals representing difference in manganese levels between healthy and diabetic subjects.
| First Author | Year | Effect Size (95% CI) | Forest Plot | Weight (%)a |
|---|
| Adewumib | 2007 | -0.96 (-1.42, -0.50) | 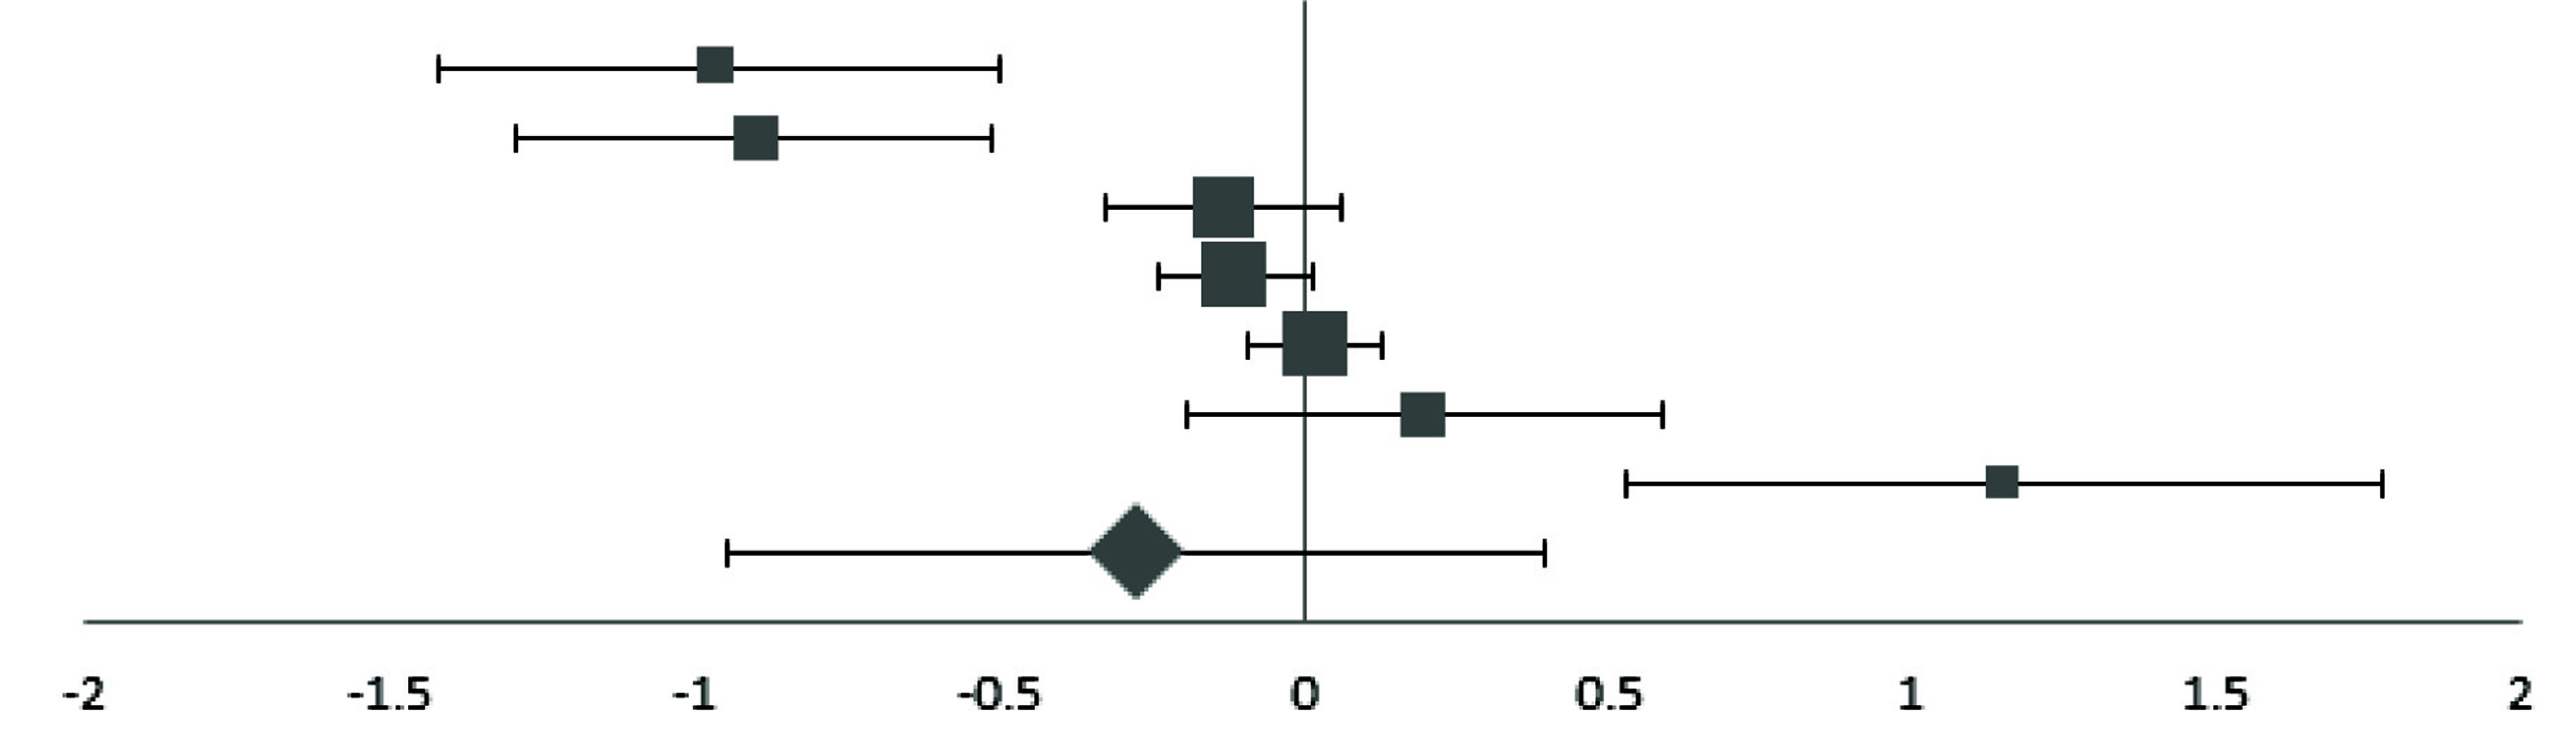 | 6.93 |
| Eva | 2016 | -0.90 (-1.29, -0.51) | 8.13 |
| Nasli-Esfahani | 2011 | -0.13 (-0.33, 0.07) | 16.26 |
| Wangb | 2016 | -0.11 (-0.23, 0.01) | 25.71 |
| Zhang | 2017 | 0.02 (-0.09, 0.13) | 29.69 |
| Ekmekcioglu | 2000 | 0.20 (-0.19, 0.59) | 8.13 |
| Flores | 2010 | 1.15 (0.53, 1.77) | 5.14 |
| Pooled Effect Size | | -0.27 (-0.78, 0.24) | 100 |
| Test for Overall Effect: Z= -1.07 (p>0.10) | |
aThe weight of each study indicates its influence on the pooled effect size. A higher percentage weight is shown by a larger box and narrower confidence interval for the respective study in the forest plot
bData represented as weighted average of the effect size for men and women
Moderator Analysis
The influence of biomarker type for quantification of trace element status, age, gender and BMI on effect size was carried out as separate, additional analyses. The weighted average of age and percentage of men were used to represent age and gender, respectively, with the number of individuals in the control and diabetic groups serving as the weights. The weighted mean of the difference in BMI also was used as a moderator.
Z-statistics for testing the type of biomarker, age, gender and BMI as moderator effects were -0.504, -0.219, 0.982, and 0.459 respectively. Furthermore, none of the moderators had a significant influence on any of the effect sizes.
Publication Bias
[Table/Fig-9] indicates a fairly symmetrical funnel plot. Furthermore, the Egger’s regression showed no evidence for significant publication bias in the included studies.
Discussion
This meta-analysis found that zinc and manganese concentrations were lower in type 2 diabetic individuals compared to nondiabetic controls; while levels of copper, ceruloplasmin, iron and ferritin were higher. However, the bias-corrected Hedges g was not significant for ceruloplasmin, iron and manganese. The inconsistent findings between copper and ceruloplasmin, and iron and ferritin could be due to difference in the number of studies investigating levels of these biomarkers. It is important to note that the greatest effect size was observed for ceruloplasmin, followed by iron. The smaller number of studies reporting ceruloplasmin and iron values could have resulted in lower statistical power, and subsequently, non-significant effect sizes. The use of plasma vs serum, age, BMI, and gender did not significantly influence the effect sizes in the present meta-analysis.
The results of this meta-analysis suggest possible zinc deficiencies and elevated copper and iron (as indicated by ferritin) statuses in type 2 diabetic individuals. The findings are comparable to previous research which demonstrates abnormal metabolism of zinc in type 2 diabetes patients, marked by malabsorption and increased urinary losses of this micronutrient [80]. Further, the greater ceruloplasmin [40,81] and lower transferrin [40] levels observed in type 2 diabetic individuals could result in elevated levels of free copper and iron, respectively. Increased levels of these transition metals have been linked to greater oxidative stress [82], and subsequently, increased insulin resistance and type 2 diabetes [16]. The concomitant decrease in trace elements that function as antioxidants, such as zinc [83] and manganese [84,85], may cause an impaired scavenging mechanism of free radicals, and may further exacerbate the prognosis of diabetes. Collectively, these results indicate the need for cohort studies to explore the role of these trace elements in the progression of type 2 diabetes.
The results of this meta-analysis are subject to certain limitations. Since the meta-analysis did not include longitudinal studies, it is not possible to establish causal inferences on the association between altered trace element status and type 2 diabetes. Another limitation is that the results could have been influenced by exclusion of articles that lacked availability of text in English. Further, the high level of heterogeneity in this meta-analysis could have affected the validity of the overall pooled effect size estimate. Nevertheless, the analysis is strengthened by the use of a model that handles dependency between multiple outcomes.
Conclusion
In conclusion, this meta-analysis found altered levels of trace minerals in type 2 diabetes patients in comparison with controls. Inadequate zinc and a concurrent excess of copper and iron levels may be associated with an increased level of oxidative stress, and may exacerbate the condition. Longitudinal studies could help in understanding the association between trace element variations and onset and progression of type 2 diabetes.
Financial Support
This research received no specific grant from any funding agency, commercial or not-for-profit sectors. Lead author’s effort was supported in part by the intramural research program of the National Institutes of Health, Eunice Kennedy Shriver National Institute of Child Health and Human Development.
[1]. Praveena S, Pasula S, Sameera K, Trace elements in diabetes mellitusJ Clin Diagn Res 2013 7(9):1863-65. [Google Scholar]
[2]. Center for Disease Control and Prevention. National diabetes statistics report: estimates of diabetes and its burden in the United States, 2014. 2014. Atlanta (GA): US Department of Health and Human Services. 2014 [Google Scholar]
[3]. Stumvoll M, Goldstein BJ, van Haeften TW, Type 2 diabetes: Principles of pathogenesis and therapyLancet 2005 365(9467):1333-46.10.1016/S0140-6736(05)61032-X [Google Scholar] [CrossRef]
[4]. Ekmekcioglu C, Prohaska C, Pomazal K, Steffan I, Schernthaner G, Marktl W, Concentrations of seven trace elements in different hematological matrices in patients with type 2 diabetes as compared to healthy controlsBiol Trace Elem Res 2001 79(3):205-19.10.1385/BTER:79:3:205 [Google Scholar] [CrossRef]
[5]. Chistiakov DA, Voronova NV, Zn(2+)-transporter-8: a dual role in diabetesBiofactors 2009 35(4):356-63.10.1002/biof.4919655390 [Google Scholar] [CrossRef] [PubMed]
[6]. Buchner DA, Charrier A, Srinivasan E, Wang L, Paulsen MT, Ljungman M, Zinc finger protein 407 (ZFP407) regulates insulin-stimulated glucose uptake and glucose transporter 4 (Glut4) mRNAJ Biol Chem 2015 290(10):6376-86.10.1074/jbc.M114.62373625596527 [Google Scholar] [CrossRef] [PubMed]
[7]. Miranda ER, Dey CS, Effect of chromium and zinc on insulin signaling in skeletal muscle cellsBiol Trace Elem Res 2004 101(1):19-36.10.1385/BTER:101:1:19 [Google Scholar] [CrossRef]
[8]. May JM, Contoreggi CS, The mechanism of the insulin-like effects of ionic zincJ Biol Chem 1982 257(8):4362-68. [Google Scholar]
[9]. Hurley LS, Keen CL, Baly DL, Manganese deficiency and toxicity: effects on carbohydrate metabolism in the ratNeurotoxicology 1984 5(1):97-104. [Google Scholar]
[10]. Baly DL, Curry DL, Keen CL, Hurley LS, Effect of manganese deficiency on insulin secretion and carbohydrate homeostasis in ratsJ Nutr 1984 114(8):1438-46.10.1093/jn/114.8.14386379130 [Google Scholar] [CrossRef] [PubMed]
[11]. Ueda M, Robinson FW, Smith MM, Kono T, Effects of divalent cations on the regulation of insulin-sensitive glucose transport and cAMP phosphodiesterase in adipocytes. Insulin-like effects of divalent cationsJ Biol Chem 1984 259(15):9520-25. [Google Scholar]
[12]. Baly DL, Schneiderman JS, Garcia-Welsh AL, Effect of manganese deficiency on insulin binding, glucose transport and metabolism in rat adipocytesJ Nutr 1990 120(9):1075-79.10.1093/jn/120.9.10752204694 [Google Scholar] [CrossRef] [PubMed]
[13]. Bo S, Durazzo M, Gambino R, Berutti C, Milanesio N, Caropreso A, Associations of dietary and serum copper with inflammation, oxidative stress, and metabolic variables in adultsJ Nutr 2008 138(2):305-10.10.1093/jn/138.2.30518203896 [Google Scholar] [CrossRef] [PubMed]
[14]. Wessling-Resnick M, Iron homeostasis and the inflammatory responseAnnu Rev Nutr 2010 30:105-22.10.1146/annurev.nutr.012809.10480420420524 [Google Scholar] [CrossRef] [PubMed]
[15]. Deb S, Johnson EE, Robalinho-Teixeira RL, Wessling-Resnick M, Modulation of intracellular iron levels by oxidative stress implicates a novel role for iron in signal transductionBiometals 2009 22(5):855-62.10.1007/s10534-009-9214-719190985 [Google Scholar] [CrossRef] [PubMed]
[16]. Park K, Gross M, Lee DH, Holvoet P, Himes JH, Shikany JM, Oxidative stress and insulin resistance: the coronary artery risk development in young adults studyDiabetes Care 2009 32(7):1302-07.10.2337/dc09-025919389821 [Google Scholar] [CrossRef] [PubMed]
[17]. Brudevold R, Hole T, Hammerstrom J, Hyperferritinemia is associated with insulin resistance and fatty liver in patients without iron overloadPLoS One 2008 3(10):e354710.1371/journal.pone.000354718958176 [Google Scholar] [CrossRef] [PubMed]
[18]. Kim HN, Song SW, Concentrations of chromium, selenium, and copper in the hair of viscerally obese adults are associated with insulin resistanceBiol Trace Elem Res 2014 158(2):152-57.10.1007/s12011-014-9934-624643468 [Google Scholar] [CrossRef] [PubMed]
[19]. Pidduck HG, Wren PJ, Evans DA, Plasma zinc and copper in diabetes mellitusDiabetes 1970 19(4):234-39.10.2337/diab.19.4.2345437977 [Google Scholar] [CrossRef] [PubMed]
[20]. Ekin S, Mert N, Gunduz H, Meral I, Serum sialic acid levels and selected mineral status in patients with type 2 diabetes mellitusBiol Trace Elem Res 2003 94(3):193-201.10.1385/BTER:94:3:193 [Google Scholar] [CrossRef]
[21]. McNair P, Christiansen C, Christensen MS, Madsbad S, Faber OK, Binder C, Development of bone mineral loss in insulin-treated diabetes: a 1 1/2 years follow-up study in sixty patientsEur J Clin Invest 1981 11(1):55-59.10.1111/j.1365-2362.1981.tb01765.x6783430 [Google Scholar] [CrossRef] [PubMed]
[22]. Raz I, Havivi E, Trace elements in blood cells of diabetic subjectsDiabetes Res 1989 10(1):21-24. [Google Scholar]
[23]. Car N, Car A, Granić M, Skrabalo Z, Momcilović B, Zinc and copper in the serum of diabetic patientsBiol Trace Elem Res 1992 32:325-29.10.1007/BF027846181375073 [Google Scholar] [CrossRef] [PubMed]
[24]. Williams NR, Rajput-Williams J, West JA, Nigdikar SV, Foote JW, Howard AN, Plasma, granulocyte and mononuclear cell copper and zinc in patients with diabetes mellitusAnalyst 1995 120(3):887-90.10.1039/an99520008877741248 [Google Scholar] [CrossRef] [PubMed]
[25]. Al-Maroof RA, Al-Sharbatti SS, Serum zinc levels in diabetic patients and effect of zinc supplementation on glycaemic control of type 2 diabeticsSaudi Med J 2006 27(3):344-50. [Google Scholar]
[26]. Sfar S, Jawed A, Braham H, Amor S, Laporte F, Kerkeni A, Zinc, copper and antioxidant enzyme activities in healthy elderly Tunisian subjectsExp Gerontol 2009 44(12):812-17.10.1016/j.exger.2009.10.00819836441 [Google Scholar] [CrossRef] [PubMed]
[27]. Bates CJ, Prentice A, Finch S, Gender differences in food and nutrient intakes and status indices from the National Diet and Nutrition Survey of people aged 65 years and overEur J Clin Nutr 1999 53(9):694-99.10.1038/sj.ejcn.160083410509764 [Google Scholar] [CrossRef] [PubMed]
[28]. Azab SF, Saleh SH, Elsaeed WF, Elshafie MA, Sherief LM, Esh AM, Serum trace elements in obese Egyptian children: a case-control studyItal J Pediatr 2014 40:2010.1186/1824-7288-40-2024555483 [Google Scholar] [CrossRef] [PubMed]
[29]. Choi BC, Shi F, Risk factors for diabetes mellitus by age and sex: results of the National Population Health SurveyDiabetologia 2001 44(10):1221-31.10.1007/s00125010064811692170 [Google Scholar] [CrossRef] [PubMed]
[30]. Kesavadev JD, Short KR, Nair KS, Diabetes in old age: an emerging epidemicJ Assoc Physicians India 2003 51:1083-94. [Google Scholar]
[31]. Kautzky-Willer A, Harreiter J, Pacini G, Sex and Gender Differences in Risk, Pathophysiology and Complications of Type 2 Diabetes MellitusEndocr Rev 2016 37(3):278-316.10.1210/er.2015-113727159875 [Google Scholar] [CrossRef] [PubMed]
[32]. Onat A, Avci GS, Barlan MM, Uyarel H, Uzunlar B, Sansoy V, Measures of abdominal obesity assessed for visceral adiposity and relation to coronary riskInt J Obes Relat Metab Disord 2004 28(8):1018-25.10.1038/sj.ijo.080269515197408 [Google Scholar] [CrossRef] [PubMed]
[33]. Cumming G, Understanding the New Statistics: Effect sizes, Confidence Intervals, and Meta-Analysis 2012 New York, NYRoutledge10.4324/9780203807002 [Google Scholar] [CrossRef]
[34]. Tipton E, Small sample adjustments for robust variance estimation with meta-regressionPsychol Methods 2015 20(3):375-93.10.1037/met000001124773356 [Google Scholar] [CrossRef] [PubMed]
[35]. Mateo MC, Bustamante JB, Cantalapiedra MA, Serum, zinc, copper and insulin in diabetes mellitusBiomedicine 1978 29(2):56-58. [Google Scholar]
[36]. Hughes K, Choo M, Kuperan P, Ong CN, Aw TC, Cardiovascular risk factors in non-insulin-dependent diabetics compared to non-diabetic controls: a population-based survey among Asians in SingaporeAtherosclerosis 1998 136(1):25-31.10.1016/S0021-9150(97)00180-9 [Google Scholar] [CrossRef]
[37]. Daimon M, Susa S, Yamatani K, Manaka H, Hama K, Kimura M, Hyperglycaemia is a factor for an increase in serum ceruloplasmin in type 2 diabetesDiabetes Care 1998 21(9):1525-28.10.2337/diacare.21.9.15259727903 [Google Scholar] [CrossRef] [PubMed]
[38]. Kim CH, Kim HK, Bae SJ, Park JY, Lee KU, Association of elevated serum ferritin concentration with insulin resistance and impaired glucose metabolism in Korean men and womenMetabolism 2011 60(3):414-20.10.1016/j.metabol.2010.03.00720423745 [Google Scholar] [CrossRef] [PubMed]
[39]. Olaniyan O, Awonuga MAM, Ajetunmobi AF, Adeleke IA, Fagbolade OJ, Olabiyi KO, Serum copper and zinc levels in Nigerian type 2 diabetic patientsAfr J Diabetes Med 2012 20(2):36-38. [Google Scholar]
[40]. Memişoğullari R, Bakan E, Levels of ceruloplasmin, transferrin, and lipid peroxidation in the serum of patients with Type 2 diabetes mellitusJ Diabetes Complications 2004 18(4):193-97.10.1016/S1056-8727(03)00032-1 [Google Scholar] [CrossRef]
[41]. Memisoğullari R, Taysi S, Bakan E, Capoglu I, Antioxidant status and lipid peroxidation in type II diabetes mellitusCell Biochem Funct 2003 21(3):291-96.10.1002/cbf.102512910484 [Google Scholar] [CrossRef] [PubMed]
[42]. Qin LX, Zeng X, Huang G, Changes in serum and urine ceruloplasmin concentrations in type 2 diabetesZhong Nan Da Xue Xue Bao Yi Xue Ban 2004 29(2):208-11. [Google Scholar]
[43]. Elis A, Ferencz JR, Gilady G, Livne A, Assia EI, Lishner M, Is serum ferritin high in patients with diabetic retinopathy? A controlled studyEndocr Res 2004 30(2):141-47.10.1081/ERC-20002735415473124 [Google Scholar] [CrossRef] [PubMed]
[44]. Jiang R, Manson JE, Meigs JB, Ma J, Rifai N, Hu FB, Body iron stores in relation to risk of type 2 diabetes in apparently healthy womenJAMA 2004 291(6):711-17.10.1001/jama.291.6.71114871914 [Google Scholar] [CrossRef] [PubMed]
[45]. Elsammak M, Refai W, Elsawaf A, Abdel-Fattah I, Abd Elatti E, Ghazal A, Elevated serum tumor necrosis factor alpha and ferritin may contribute to the insulin resistance found in HCV positive Egyptian patientsCurr Med Res Opin 2005 21(4):527-34.10.1185/030079905X3814115899101 [Google Scholar] [CrossRef] [PubMed]
[46]. Kaviarasan K, Arjunan MM, Pugalendi KV, Lipid profile, oxidant-antioxidant status and glycoprotein components in hyperlipidemic patients with/without diabetesClin Chim Acta 2005 362(1-2):49-56.10.1016/j.cccn.2005.05.01016198326 [Google Scholar] [CrossRef] [PubMed]
[47]. Vîrgolici B, Mohora M, Stoian I, Lixandru D, Găman L, Paveliu F, A comparative oxidative stress study--obesity with and without diabetes mellitusRom J Intern Med 2005 43(3-4):261-68. [Google Scholar]
[48]. Abou-Shousha S, Abd El-Megeed MH, Sultan HK, Interleukin-8, ferritin and soluble transferrin receptors in type II diabetes mellitusEgypt J Immunol 2006 13(1):19-25. [Google Scholar]
[49]. Lee DH, Liu DY, Jacobs DR, Shin HR, Song K, Lee IK, Common presence of non-transferrin-bound iron among patients with type 2 diabetesDiabetes Care 2006 29(5):1090-95.10.2337/dc05-247116644642 [Google Scholar] [CrossRef] [PubMed]
[50]. Adewumi MT, Njoku CH, Saidu Y, Abubakar MK, Shehu RA, Bilbis LS, Serum Chromium, Copper and Manganese Levels of Diabetic Subjects in Katsina, NigeriaAsian Journal of Biochemistry 2007 2(4):284-88.10.3923/ajb.2007.284.288 [Google Scholar] [CrossRef]
[51]. Viktorínová A, Toserová E, Krizko M, Duracková Z, Altered metabolism of copper, zinc, and magnesium is associated with increased levels of glycated hemoglobin in patients with diabetes mellitusMetabolism 2009 58(10):1477-82.10.1016/j.metabol.2009.04.03519592053 [Google Scholar] [CrossRef] [PubMed]
[52]. Rajpathak SN, Wylie-Rosett J, Gunter MJ, Negassa A, Kabat GC, Rohan TE, Biomarkers of body iron stores and risk of developing type 2 diabetesDiabetes Obes Metab 2009 11(5):472-79.10.1111/j.1463-1326.2008.00985.x19207293 [Google Scholar] [CrossRef] [PubMed]
[53]. Flores CR, Puga MP, Wrobel K, Garay Sevilla ME, Trace elements status in diabetes mellitus type 2: possible role of the interaction between molybdenum and copper in the progress of typical complicationsDiabetes Res Clin Pract 2011 91(3):333-41.10.1016/j.diabres.2010.12.01421211861 [Google Scholar] [CrossRef] [PubMed]
[54]. Sarkar A, Dash S, Barik BK, Muttigi MS, Kedage V, Shetty JK, Copper and ceruloplasmin levels in relation to total thiols and GST in type 2 diabetes mellitus patientsIndian J Clin Biochem 2010 25(1):74-76.10.1007/s12291-010-0015-023105888 [Google Scholar] [CrossRef] [PubMed]
[55]. Ashourpour M, Djalali M, Djazayery A, Eshraghian MR, Taghdir M, Saedisomeolia A, Relationship between serum ferritin and inflammatory biomarkers with insulin resistance in a Persian population with type 2 diabetes and healthy peopleInt J Food Sci Nutr 2010 61(3):316-23.10.3109/0963748090355515020113186 [Google Scholar] [CrossRef] [PubMed]
[56]. Chacko SK, Cheluvappa R, Increased ceruloplasmin and fibrinogen in type 2 diabetes corresponds to decreased anti-oxidant activity in a preliminary tertiary South Indian hospital studyExp Clin Endocrinol Diabetes 2010 118(1):64-67.10.1055/s-0029-122564719834873 [Google Scholar] [CrossRef] [PubMed]
[57]. Nasli-Esfahani E, Faridbod F, Larijani B, Ganjali MR, Norouzi P, Trace element analysis of hair, nail, serum and urine of diabetes mellitus patients by inductively coupled plasma atomic emission spectroscopyJ Diabetes Metab Disord 2011 10:1-9. [Google Scholar]
[58]. Ferdousi S, Mia AR, Serum levels of copper and zinc in newly diagnosed type-2 diabetic subjectsMymensingh Med J 2012 21(3):475-78.10.3329/bjmb.v3i2.13811 [Google Scholar] [CrossRef]
[59]. Savu O, Ionescu-Tirgoviste C, Atanasiu V, Gaman L, Papacocea R, Stoian I, Increase in total antioxidant capacity of plasma despite high levels of oxidative stress in uncomplicated type 2 diabetes mellitusJ Int Med Res 2012 40(2):709-16.10.1177/14732300120400023522613434 [Google Scholar] [CrossRef] [PubMed]
[60]. Ganesh S, Dharmalingam M, Marcus SR, Oxidative stress in type 2 diabetes with iron deficiency in Asian IndiansJ Med Biochem 2012 31(2):115-20.10.2478/v10011-011-0049-8 [Google Scholar] [CrossRef]
[61]. Farid SM, Abulfaraj TG, Trace mineral status related to levels of glycated hemoglobin of type 2 diabetic subjects in Jeddah, Saudi ArabiaMed J Islamic World Acad Sci 2013 21(2):47-56.10.12816/0001489 [Google Scholar] [CrossRef]
[62]. Dosa MD, Adumitresi CR, Hangan LT, Nechifor M, Copper, zinc and magnesium in non-insulin-dependent diabetes mellitus treated with metforminDiabetes Mellitus - Insights and Perspectives 2013 12:209-228. [Google Scholar]
[63]. Kundu D, Roy A, Mandal T, Bandyopadhyay U, Ghosh E, Ray D, Relation of iron stores to oxidative stress in type 2 diabetesNiger J Clin Pract 2013 16(1):100-03.10.4103/1119-3077.10677623377481 [Google Scholar] [CrossRef] [PubMed]
[64]. Santa SR, Swati B, Choudhury KM, Santasmita P, Aruna B, Gargi S, Soma G, Status of serum magnesium, zinc & copper in patients suffering from type 2 diabetes mellitusJ Drug Ther 2014 4(1):70-72.10.22270/jddt.v4i1.754 [Google Scholar] [CrossRef]
[65]. Oyedeji SO, Adesina AA, Oke OT, Tijani YO, Evaluation of essential trace metals in female type 2 diabetes mellitus patients in Nigerian populationAfr J Biotechnol 2014 13(18):1910-14.10.5897/AJB12.1950 [Google Scholar] [CrossRef]
[66]. Kumar DA, Priya VS, Jaiprabhu J, Ramalingam K, Serum copper and zinc levels significance in type 2 diabetic patientsJ Med Sci Tech 2014 3(2):79-81. [Google Scholar]
[67]. Alam F, Fatima F, Orakzai S, Iqbal N, Fatima SS, Elevated levels of ferritin and hs-CRP in type 2 diabetesJ Pak Med Assoc 2014 64(12):1389-91. [Google Scholar]
[68]. Nagarajrao R, Alharbi SA, Evaluation of serum zinc, copper, magnesium and iron levels in type 2 diabetes mellitus patientsInt J Adv Res 2015 3(2):960-65. [Google Scholar]
[69]. Maheshwari AV, Bhoi BK, Sadariya BR, Javia HN, Gusani JK, Sharma H, Correlation between serum ferritin and glycaemic control in patients of type 2 diabetes mellitus: a case control studyInt J Res Med Sc 2015 3(9):2327-30.10.18203/2320-6012.ijrms20150625 [Google Scholar] [CrossRef]
[70]. Badran M, Morsy R, Soliman H, Elnimr T, Assessment of trace elements levels in patients with Type 2 diabetes using multivariate statistical analysisJ Trace Elem Med Biol 2016 33:114-19.10.1016/j.jtemb.2015.10.00626653752 [Google Scholar] [CrossRef] [PubMed]
[71]. Atari-Hajipirloo S, Valizadeh N, Khadem-Ansari MH, Rasmi Y, Kheradmand F, Altered concentrations of copper, zinc, and iron are associated with increased levels of glycated hemoglobin in patients with type 2 diabetes mellitus and their first-degree relativesInt J Endocrinol Metab 2016 14(2):e3327310.5812/ijem.3327327761143 [Google Scholar] [CrossRef] [PubMed]
[72]. Wang X, Zhang M, Lui G, Chang H, Liu W, Li Z, Associations of serum manganese levels with prediabetes and diabetes among ≥60-year-old Chinese adults: a population-based cross-sectional analysisNutrients 2016 8(8):49710.3390/nu808049727529280 [Google Scholar] [CrossRef] [PubMed]
[73]. Devi TR, Hijam D, Dubey A, Debnath A, Oinam P, Devi NGT, Singh WG, Study of serum zinc and copper levels in type 2 diabetes mellitusICJMR 2016 3(4):1036-40.10.21276/ijmrp.2016.2.5.006 [Google Scholar] [CrossRef]
[74]. Goud GKV, Patil S, Rahman MA, A study on antioxidants and iron nutritional status in type 2 diabetes mellitus with and without coronary heart diseaseInt J Biomed Res 2016 7:495-98.10.7439/ijbar.v7i6.3371 [Google Scholar] [CrossRef]
[75]. Jeppu AK, Augusthy A, Kumar KA, Plasma glucose and serum ceruloplasmin in metabolic syndrome and diabetes mellitus type 2RABM 2016 2:15-19.10.18639/RABM.2016.02.282945 [Google Scholar] [CrossRef]
[76]. Borah M, Goswami RK, Evaluation of serum ferritin in in type II diabetes mellitus: a hospital based observational study from Dibrugarh, Assam, IndiaInt J Res Med Sc 2016 4(11):4916-21.10.18203/2320-6012.ijrms20163791 [Google Scholar] [CrossRef]
[77]. Eva H, Akhter QS, Alam K, Serum zinc and manganese levels in subjects with type 2 diabetes mellitusJ Bangladesh Soc Physiol 2016 11(2):50-53.10.3329/jbsp.v11i2.30650 [Google Scholar] [CrossRef]
[78]. Zhang H, Yan C, Yang Z, Zhang W, Niu Y, Li X, Alterations of serum trace elements in patients with type 2 diabetesJ Trace Elem Med Biol 2017 40:91-96.10.1016/j.jtemb.2016.12.01728159227 [Google Scholar] [CrossRef] [PubMed]
[79]. Kim NH, Oh JH, Choi KM, Kim YH, Baik SH, Choi DS, Serum ferritin in healthy subjects and type 2 diabetic patientsYonsei Med J 2000 41(3):387-92.10.3349/ymj.2000.41.3.38710957894 [Google Scholar] [CrossRef] [PubMed]
[80]. Kinlaw WB, Levine AS, Morley JE, Silvis SE, McClain CJ, Abnormal zinc metabolism in type II diabetes mellitusAm J Med 1983 75(2):273-77.10.1016/0002-9343(83)91205-6 [Google Scholar] [CrossRef]
[81]. Cunningham J, Leffell M, Mearkle P, Harmatz P, Elevated plasma ceruloplasmin in insulin-dependent diabetes mellitus: evidence for increased oxidative stress as a variable complicationMetabolism 1995 44(8):996-99.10.1016/0026-0495(95)90095-0 [Google Scholar] [CrossRef]
[82]. Das TK, Wati MR, Fatima-Shad K, Oxidative stress gated by fenton and haber weiss reactions and its association with alzheimer’s diseaseArchives of Neuroscience 2015 2(2)10.5812/archneurosci.20078 [Google Scholar] [CrossRef]
[83]. Cruz KJ, de Oliveira AR, Marreiro Ddo N, Antioxidant role of zinc in diabetes mellitusWorld J Diabetes 2015 6(2):333-37.10.4239/wjd.v6.i2.33325789115 [Google Scholar] [CrossRef] [PubMed]
[84]. Coassin M, Ursini F, Bindoli A, Antioxidant effect of manganeseArch Biochem Biophys 1992 299(2):330-33.10.1016/0003-9861(92)90282-2 [Google Scholar] [CrossRef]
[85]. Aguirre JD, Culotta VC, Battles with iron: manganese in oxidative stress protectionJ Biol Chem 2012 287(17):13541-48.10.1074/jbc.R111.31218122247543 [Google Scholar] [CrossRef] [PubMed]