Although effective treatment has been used to treat TB for several decades, yet TB remains a major global health problem and the second leading cause of death worldwide. Geographically, the burden of TB is the highest in Asia and Africa [1]. India still bears a disproportionately large burden of the world’s TB cases, and it continues to be the biggest health problem in India. India is the highest TB burden country with World Health Organisation (WHO) statistics for 2013 giving an estimated incidence figure of 2.1 million cases of TB for India out of a global incidence of 9 million. The estimated TB prevalence figure for 2013 is given as 2.6 million [1,2]. It is estimated that about 40% of the Indian population is infected with TB bacteria, the vast majority of whom have latent rather than active TB [2]. The Millennium Declaration in 2000 brought special global attention to HIV, TB and malaria through the formulation of Millennium Development Goal 6 (MDG 6) [3]. The high priority status of these three diseases in the development community was confirmed through the creation of the Global Fund to Fight AIDS, TB and Malaria in 2002. The Institute for Health Metrics and Evaluation in University of Washington in their fifth Annual Report on Global Health expenditure stated that from 2000 to 2011, multilaterals, bilaterals, foundations, and non governmental organisations had invested US $51.6 billion for HIV, $11.3 billion for malaria, and $8.3 billion for TB (price in US dollars, 2011) in Development Assistance for Health (DAH) [4].
The country’s massive scale-up and implementation of DOTS therapy under the Revised National TB Control Program (RNTCP) was lauded internationally as a global model of excellence [5]. Andaman and Nicobar group of islands is an archipelago of about 500 islands, some of which have population in very remote and in accessible islands. Although the total population has been relatively constant and the programme implementation has been going on well in the islands, yet we wanted to study the trend of cases over the years. The present study was done using the available data to compare with the other parts of the country and to analyse the effectiveness of the programme and to recommend if any modifications required for implementation of the programme. In this study, we assessed the treatment outcomes of TB patients in DOTS programme in Andaman and Nicobar Islands over a period of six years that is from January 2010 to December 2015.
Materials and Methods
A retrospective cohort study was conducted from June 2016 to December 2016 for a period of 7 months at DOTS TB State Center in GB Pant Hospital, Port Blair, Andaman and Nicobar Islands. The total population of Andaman and Nicobar Islands which is administratively divided into three districts-North and Middle Andaman, South Andaman and Nicobar district as per SRS Bulletin September, 2013 is 3,80,581. There are nine TB units in Andaman and Nicobar Islands, 13 designated microscopy centers and 233 DOTS centres. The study population was all the newly diagnosed TB patients registered from 2010 to 2015 at DOTS TB state centre. The total number of new cases registered was 3917 and all of them were included in the study. Patient particulars like age, sex, TB category at the beginning, and treatment outcomes were collected from the records that were available.
The TB drugs used in combination were Isoniazid (H), Rifampicin (R), Pyrazinamide (Z), Ethambutol (E), Streptomycin (S). Under DOTS, all the new cases which include new sputum smear positive, new sputum smear negative, new extrapulmonary were treated with 2 (HRZE)3 + 4(HR)3. The first two months of intensive phase treatment were under direct supervision of the health workers. During continuation phase, the patient is issued medicine for one week in a multiblister combination pack, of which the first dose is swallowed in the presence of the health worker. Re-treatment cases were treated with 2(HRZES)3, 1(HRZE)3, and 5(HRE)3. The number before the letter refers to the number of months of treatment. The subscript after the letters refers to the number of doses per week. The dosage is H:Isoniazid (600 mg), R:Rifampicin (450 mg), Z:Pyrazinamide (1500 mg), E:Ethambutol (1200 mg), S:Steptomycin (750 mg) [6,7].
The inclusion criterion was all the new cases (new sputum positive - 1468, new sputum negative - 1254, new extra pulmonary - 1195) registered in TB Centre from 2010 to 2015.
Exclusion criterion included all old cases, Multidrug resistant and Extensively Drug Resistant (XDR) TB cases. Technical and operational guidelines for TB control in India [7,8].
New TB case notification rate: New TB case notification rate (microbiologically confirmed and clinically diagnosed) is calculated as the number of notification of new TB cases notified during a specified period per population in 100,000 in a year.
New case of TB: A patient who is suffering from TB and never had treatment for TB or has taken anti tuberculosis drugs for less than one month.
Smear-positive pulmonary case of TB: In a patient, one initial sputum smear examination (direct smear microscopy) positive for AFB or TB in a patient with culture positive for Mycobacterium tuberculosis.
Smear-negative pulmonary case of TB: In a patient with symptoms suggestive of TB with at least two sputum examinations negative for AFB, and radiographic abnormalities consistent with active pulmonary TB as determined by a medical officer, followed by a decision to treat the patient with full course of anti tuberculosis therapy; or diagnosis based on clinical examination and he/she is culture and AFB sputum examination negative.
Extra Pulmonary TB (EPTB): Refers to any bacteriologically confirmed or clinically diagnosed case of TB involving organs other than the lungs, e.g., pleura, lymph nodes, abdomen, genitourinary tract, skin, joints and bones, meninges.
Cured: Microbiologically confirmed TB patients at the beginning of treatment who was smear or culture negative at the end of the complete treatment.
Failure: A TB patient whose biological specimen is positive by smear or culture is positive at end of treatment.
Relapse: Patients who have been previously treated for TB were declared cured or treatment completed at the end of their most recent course of treatment and are now diagnosed with a recurrent episode of TB which may be a true relapse or a new episode of TB caused by reinfection.
Treatment after default: Patients have been previously treated for TB and were declared lost to follow-up or default at the end of their most recent course of treatment.
Expired: A patient with TB, who died of any reason before starting or during the course of TB treatment.
Lost to follow-up (Defaulter): A TB patient whose treatment was interrupted for one consecutive month or more.
Statistical Analysis
The summative data contained cured, failures, defaulters, deaths and transfer out during the course of treatment of each patient. The collected data were summarised using statistical software IBM SPSS 20.0 (Chicago), after which it was tabulated, analysed and interpreted using frequencies and percentages. Chi-square test for trend was used to assess the statistical significance of trend of summative data. A statistical test was considered significant when the p-value was <0.05.
Ethical considerations: Institutional ethical clearance was obtained from the Andaman and Nicobar Islands Institute of Medical Sciences Port Blair.
Results
The total population of Andaman and Nicobar Islands ranged from 379,000 population in 2010 to 384,000 population in 2015. The number of chest suspects examined per hundred thousand population steadily increased from 1031.9 in 2010 to 1144.0 in 2015. The annual total new cases registered had decreased from 212.14 per 100,000 population in 2010 to 152.08 per 100,000 population in 2015. The annual total new case detection rate had increased from 72% in 2010 to 78% in 2015. The total patients initiated on treatment on an average per year were 652. Incidence of TB on an average from 2010-2015 is 171 per 100,000 population. There were no cases of TB with HIV in 2010 but in 2015 there were three cases reported who had TB and HIV (Human Immunodeficiency Virus) [Table/Fig-1].
Trend of tuberculosis case notification per 100,000 person (from 2010 to 2015).
| Year | Population in 100 thousands | No. of chest suspects examined per 1,00,000 population | Annual total new cases registered per 1,00,000 population | Annual total new case detection rate (%) | Total new patients initiated on treatment | Incidence of TB per 1,00,000 population | TB /HIV coinfection (no. of cases) |
|---|
| 2010 | 3.79 | 1031.9 | 212.14 | 72% | 699 | 184 | 0 |
| 2011 | 3.79 | 1205.3 | 239.5 | 76% | 780 | 206 | 1 |
| 2012 | 3.82 | 1071.9 | 221.5 | 77% | 707 | 185 | 3 |
| 2013 | 3.82 | 1100.5 | 193.2 | 76% | 609 | 159 | 1 |
| 2014 | 3.83 | 1132.1 | 197.9 | 78% | 628 | 164 | 0 |
| 2015 | 3.84 | 1144.0 | 152.08 | 78% | 494 | 129 | 3 |
| Average | 3.81 | 1114.3 | 202.7 | 76.1% | 652 | 171 | 1.3 |
Among 1468 study participants 935 (63.7%) were males and 533 (36.3%) were females. Children ≤14 years accounted for 2.3% of the study participants. Majority of the patients were in the 15-24 year age group which constituted about 29% [Table/Fig-2].
General characteristics of new smear sputum positive pulmonary tuberculosis from 2010-2015.
| Year | Total no. of NSP | No. of cases (Males) | No. of cases (Females) | No. of Children ≤14 years | No. of cases between 15 – 24 years | No. of cases between 25 – 34 years | No. of cases between 35 – 44 years | No. of cases 45 -54 years | No. of cases 55 and above |
|---|
| 2010 | 285 | 186 (65.3%) | 99 (34.7%) | 7 (2.4%) | 85 (25.8%) | 67 (23.5%) | 50 (17.5%) | 42 (14.7%) | 34 (11.9%) |
| 2011 | 268 | 172 (64.2%) | 96 (35.8%) | 5 (1.8%) | 88 (32.8%) | 61 (22.8%) | 47 (17.5%) | 33 (12.3%) | 34 (12.7%) |
| 2012 | 268 | 162 (60.4%) | 106 (39.5%) | 5 (1.8%) | 74 (27.6%) | 69 (25.7%) | 53 (19.8%) | 38 (14.2%) | 29 (10.8%) |
| 2013 | 224 | 140 (62.5%) | 84 (37.5%) | 10 (4.5%) | 57 (25.4%) | 56 (25%) | 38 (16.9%) | 28 (12.5%) | 35 (15.6%) |
| 2014 | 234 | 154 (65.8%) | 80 (34.2%) | 4 (1.7%) | 74 (31.6%) | 59 (25.2%) | 40 (17.1%) | 27 (11.5%) | 30 (12.8%) |
| 2015 | 189 | 121 (64%) | 68 (34.9%) | 3 (1.6%) | 42 (22.2%) | 51 (26.9%) | 39 (20.6%) | 25 (13.2%) | 29 (15.3%) |
| Total | 1468 | 935 (63.7%) | 533 (36.3%) | 34 (2.3%) | 420 (28.6%) | 363 (24.7%) | 267 (18.2%) | 193 (13.1%) | 191 (13%) |
Mean age=35.01 years, S.D=15.32 years
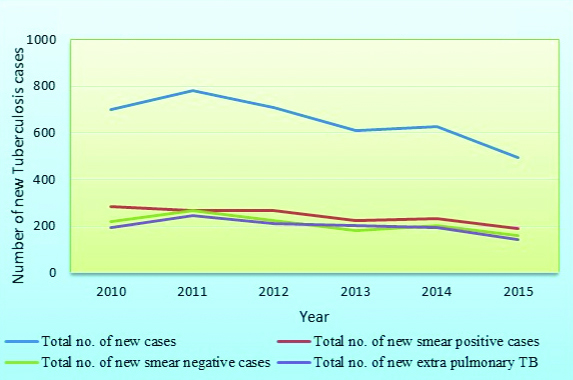
A total of 3917 TB patients were registered from 2010-2015 of which 1468 (37.5%) constituted sputum smear positive TB patients, 1254 (32%) smear negative TB patients and 1195 (30.5%) extra pulmonary patients. The treatment success rate among all the newly diagnosed TB patients has steadily increased from 84.9% to 89.3% from 2010 to 2015. The cure rate among newly diagnosed sputum positive patients has increased from 85.3% to 89.9%. The overall relapse rate was 6.7%, failure rate 1.1%, treatment after default 2.1% and others which includes transfer out and death rate constituted 1.8% [Table/Fig-3]. Chi-square test for trend was applied between year and the total number of new cases as variables which included the total number of cases, total number of new smear positive pulmonary TB, total number of smear negative pulmonary TB and total number of extra pulmonary TB. The results show a significant decrease in the number of cases [Table/Fig-4].
Treatment outcome of new tuberculosis cases registered from 2010-2015.
| Year | Total no. of new cases | Total no. of new smear positive PTB | Total no. of new smear negative PTB | Total no. of new extra pulmonary TB | Treatment success rate | Cure rate among new smear positive PTB | Relapses | Failures | Treatment after default | Others Transfer out & Deaths |
|---|
| 2010 | 699 | 285 (40.7%) | 219 (31.3%) | 195 (27.9%) | 594 (84.9%) | 243 (85.3%) | 56 (8%) | 6 (0.8%) | 29 (4.1%) | 14 (2%) |
| 2011 | 780 | 268 (34.3%) | 266 (34.1%) | 246 (31.5%) | 695 (89.1%) | 230 (85.8%) | 52 (6.6%) | 8 (1%) | 14 (1.8%) | 11 (1.4%) |
| 2012 | 707 | 268 (37.9%) | 226 (31.9%) | 213 (30.1%) | 638 (90.1%) | 239 (89.2%) | 40 (5.6%) | 7 (1%) | 12 (1.7%) | 10 (1.4%) |
| 2013 | 609 | 224 (36.8%) | 181 (29.7%) | 204 (33.5%) | 538 (87.5%) | 191 (85.3%) | 41 (6.7%) | 8 (1.3%) | 10 (1.6%) | 12 (1.9%) |
| 2014 | 628 | 234 (37.3%) | 201 (32%) | 193 (30.7%) | 551 (87.7%) | 199 (85%) | 42 (6.7%) | 9 (1.4%) | 12 (1.9%) | 14 (2.2%) |
| 2015 | 494 | 189 (38.2%) | 161 (32.6%) | 144 (29.1%) | 441 (89.3%) | 170 (89.9%) | 32 (6.5%) | 5 (1%) | 7 (1.4%) | 9 (1.8%) |
| Total | 3917 | 1468 (37.5%) | 1254 (32%) | 1195 (30.5%) | 3457 (88.2%) | 1272 (86.6%) | 263 (6.7%) | 43 (1.1%) | 84 (2.1%) | 70 (1.8%) |
Trend analysis from 2010 to 2015.
| Trend of tuberculosis cases | Chi-square | df | p-value |
|---|
| Total number of cases | 75.062 | 5 | 0.0001** |
| Total no. of new smear positive PTB | 25.975 | 5 | 0.0001** |
| Total no. of new smear negative PTB | 32.488 | 5 | 0.0001** |
| Total no. of new extra pulmonary TB | 27.649 | 5 | 0.0001** |
**: Significant at 5% level of significance
The total number of newly diagnosed TB patients had shown a significant decrease over the years from 2010–2015 [Table/Fig-5].
Trend of new tuberculosis cases (2010 to 2015).
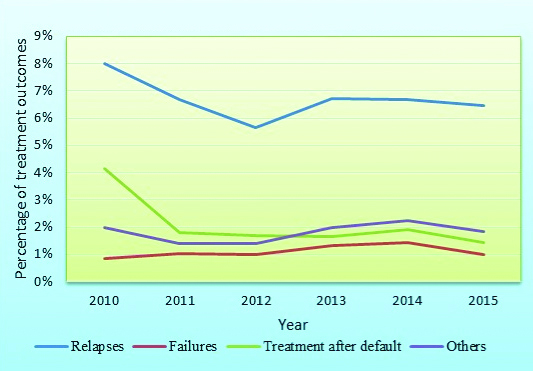
The relapse rate, failure rate and treatment after default had shown a steady decrease over the years from 2010 to 2015. The TB relapse rate has shown a steady decrease over the years from 8% to 6.7%. The TB treatment failure rate and default rate also showed a similar trend as shown in [Table/Fig-6].
Trend of treatment outcome (2010 to 2015).
Discussion
The objectives of the RNTCP were to achieve at least 85% cure rate among the new smear positive cases initiated on treatment, and thereafter a case detection rate of at least 70% of such cases [7,8]. In Andaman and Nicobar islands the average case detection rate is well above the objective i.e. about 76% over the six year period. In a similar study conducted in Delhi the case detection rate has increased from 196/100,000 population in 2001 to 306/100,000 population in 2011 [9].
The total number of cases has decreased over the years, which was also found to be statistically significant. The average incidence of TB in present study was found to be 171 per 100,000 persons. The Global annual incidence of TB was reported to be 133 per 100,000 persons in 2014 [7]. The annual incidence of TB was 176 per 100,000 per year in the year 2012 in India. As per present study it was observed that the average annual incidence is more than the global incidence but less than that of India.
Globally 12% of the 9.6 million new TB cases in 2014 were HIV positive [10]. In present study there was no HIV TB co-infection in 2010, one case was detected in 2011 and three cases of HIV TB co-infection was reported in 2015 which was showing a slow increase in these cases. In our study there was a slight increase in the number of cases detected in 2014 as active case finding by doing house to house survey in all the districts had started during that period.
Among 3917 new TB patients registered in Andaman and Nicobar Islands one out of 3 patients (37.47%, 1468/3917) were diagnosed as smear positive TB. Majority of the new smear positive pulmonary TB patients (86.64%, 1272/1468) were cured at the end of the treatment. This is in accordance with the objective of Revised National TB Control Programme where the cure rate achieved should be at least 85%. In a study done in Ahmedabad Municipal corporation area in the cure rate among the newly diagnosed sputum positive patients was 73.64% [11].
In this study (2010-2015) smear positive pulmonary TB was the leading type of TB (ranged from 40.7% to 38.2%), however, the last two years showed a marginal increase in smear negative pulmonary TB cases (32.0% to 32.59%). This might be due to increase in the HIV prevalence (0 cases in 2010 to 3 cases in 2015).
The TB relapse rate among all the new TB cases diagnosed from 2010 to 2015 has shown a steady decrease over the years from 8% to 6.7%. A relapse rate of 36% was reported in a study carried out in Karakalpakstan in Uzbekistan in 2006 [12]. In a study done among the four districts of Sikkim from 2002 to 2010 relapse rate was found to be 63.8% which is substantially very high compared to present study [13].
The TB treatment failure rate of this study was 1.09%, which was lower than the average TB treatment failure rate of 2% reported in India [1]. In a study conducted in Sikkim the failure rate was found to be 5.8% [13]. In a five year prospective study done in Ethiopia the failure rate was found to be 0.5% which is lower than that of our study [14]. In a retrospective cohort study done in Ismailia Governorate the failure rate was found to be 1.3% [15].
The average default rate in this study was 2.14% in this study. There was a sharp decline in default cases from 2010 to 2011 as STOP TB Strategy activities had started at that time with intensified activities like case detection, treatment success were focused. In a similar study conducted in Dhubri district Assam the default rate was found to be 7.4% [16]. In a study conducted in Odisha the default rate was 7.5% [17]. In another study conducted in Ahmedabad City the default rate was found to be 12.5% [11]. The proportion of defaulters should be less than 5% in a well functioning programme as per the RNTCP guidelines [18]. This shows that the programme is going on successfully in Andaman and Nicobar Islands.
The distribution of the cases by age is a good indicator of the impact of the programme on the epidemiology of TB. When the risk of infection diminishes, the average age of new cases increases. In present study over the years from 2010 to 2015 the new sputum positive TB patients were decreasing from 15-24 year age group 25.82 to 22.22%) and increasing in the 25-34 year age group 23.50% to 26.98%) respectively. The average age of new sputum positive cases was increasing over the years which show that the programme is being implemented well in the islands.
In Andaman and Nicobar Islands the population is very less and the healthcare and referral system is very robust. As there are no Chest physicians doing private practice in the entire Andaman Group of Islands all the cases with cough and other chest complaints are referred to the Chest and TB Department of GB Pant Hospital. Further active surveillance measures were continuously being carried out in the islands for early case detection and treatment due to which the targets of cure rate and case detection rate set by RNTCP were achieved.
Limitation
District wise analysis was not done which could have thrown light on the differences between treatment outcomes of North and Middle Andaman, South Andaman and Nicobar district. Further studies could be warranted on gender, retreatment cases, multidrug resistant cases, extensively drug resistant cases and comorbidities like HIV and Diabetes.
Conclusion
The expected treatment outcome norms are detection rate >70%, cure rate >85%, failure rate <4%, default rate <5% as per RNTCP norms. Cure rate of 86.64%, failure rate of 1.09%, default rate of 2.14% were observed in this study and the average age of the new sputum positive cases was increasing over the years which shows that the implementation of Revised National TB Control Programme in Andaman and Nicobar Islands has achieved the prescribed goals. The RNTCP may also focus on improving the extra pulmonary case detection activities in children.
Mean age=35.01 years, S.D=15.32 years
**: Significant at 5% level of significance