Phytoplanktons are autotrophic organisms and make their own food with the help of photosynthesis by utilsing nutrients from water in the presence of sunlight [1]. Study carried out with Scenedesmus spp. (S. dimorphus and S. quadricauda) and other microalgae have shown that certain polysaccharides have medical effects [2]. These polysaccharides function as protection against oxidative stress and have efficacy on gastric ulcers, wounds and constipation [3,4]. Chlorella is an algae belonging to the phylum Chlorophyta that is a good source of nutrients such as valuable protein, starch, calories, fat, and vitamins. These algae have the widespread use in medicine [5].
Given that different algae under varying environmental conditions would not have the same growth as well as with regard to the economic importance of algae in terms of food, medicine, health, fuel, etc., the importance of faster and cheaper growth of them felt. Therefore, by changing some of the nutrients can be achieved to maximum growth rates and cell density, especially in large quantities [6].
Juneja A et al., have shown in their study that variation in the nutrient of microalgae can change its metabolism [7]. Three factors, light intensity, the amount of nitrogen and phosphorus are effective in increasing the starch production and biomass [8].
The starch extracted from Chlorella and Spirulina are used for health care, prevention of skin dangers caused by sunlight and hair care products. Recent research by scientists shows that protein and starch in green algae can act as a HIV treatment vaccine, which means that people are immunised against these diseases by eating these algae and that there is no need for an industrial vaccine to be produced. Also, the effect of observing a three-hour starch diet on premenstrual syndrome has been proven in students [11,12].
The aim of this study is to select the best microalgae for increasing starch production that can be used in medicine.
Materials and Methods
This experimental study was conducted for duration of one month in May 2014 at Microalgae lab, Scientific and Industrial Research Organisation of Iran. Three freshwater microalgae C. vulgaris, S. dimorphus and S. quadricauda, were received from Scientific and Industrial Research Organisation of Iran. Media BBM and Z8 were selected, which are specific for the growth of freshwater phytoplankton. Composition of media used is represented in [Table/Fig-1,2] [17,18].
Composition of BBM medium used in present study.
| Medium | Components | Chemical formula | Concentration |
|---|
| BBM [17] | Sodium nitrate | NaNO3 | 250 mg/L |
| Magnesium sulfate heptahydrate | MgSO4. 7H2O | 75 mg/L |
| Salt | NaCl | 25 mg/L |
| Dipotassium phosphate | K2HPO4 | 175 mg/L |
| Calcium chloride dihydrate | CaCl2. 2H2O | 25 mg/L |
| Zinc sulfate heptahydrate | ZnSO4. 7H2O | 8.82 mg/L |
| Manganese chloride tetrahydrate | MnCl2. 4H2O | 1.44 mg/L |
| Molybdenum trioxide | MoO3 | 0.71 mg/L |
| Copper sulfate pentahydrate | CuSO4. 5H2O | 1.57 mg/L |
| Cobalt nitrate hexahydrate | Co(NO3)2. 6H2O | 0.49 mg/L |
| Ferrous sulfate heptahydrate | FeSO4. 7H2O | 4.98 mg/L |
| Boric acid | H3BO3 | 11.4 mg/L |
| Potassium hydroxide | KOH | 31 mg/L |
| Ethylene diamine tetraacetic acid disodium | EDTA Na2 | 50 mg/L |
Composition of Z8 medium used in present study.
| Medium | Components | Chemical formula | Concentration |
|---|
| Z8 [18] | Dipotassium phosphate | KH2PO4 | 0.031 gL-1 |
| Sodium nitrate | NaNO3 | 0.467 gL-1 |
| Calcium nitrate | Ca(NO3)2 | 0.041 gL-1 |
| Magnesium sulfate heptahydrate | MgSO4.7H2O | 0.025 gL-1 |
| Sodium carbonate | Na2CO3 | 0.467 gL-1 |
| Ferric chloride hexahydrate | FeCl3.6H2O | 0.0028 gL-1 |
| Ethylene diamine tetraacetic acid | EDTA | 0.0039 gL-1 |
| Gaffron solution | - | 0.1 gL-1 |
| Sodium tungstate dihydrate | Na2WO4.2H2O | 0.033 gL-1 |
| Molybdic acid ammonium salt tetrahydrate | (NH4)6Mo7O24.4H2O | 0.088 gL-1 |
| Potassium bromide | KBr | 0.119 gL-1 |
| Potassium iodide | KI | 0.083 gL-1 |
| Zinc sulfate heptahydrate | ZnSO4.7H2O | 0.287 gL-1 |
| Cadmium nitrate tetrahydrate | Cd(NO3)2.4H2O | 0.154 gL-1 |
| Cobalt nitrate hexahydrate | Co(NO3)2.6H2O | 0.146 gL-1 |
| Copper sulfate pentahydrate | CuSO4.5H2O | 0.125 gL-1 |
| Ammonium nickel sulphate hexahydrate | NiSO4(NH4)2SO4.6H2O | 0.198 gL-1 |
| Chromium nitrate heptahydrate | Cr(NO3)3.7H2O | 0.037 gL-1 |
| Aluminum potassium sulfate | Al2(SO4)3-K2SO4.24H2O | 0.474 gL-1 |
| Vanadium sulfate hexahydrate | V2O4(SO4)3.16H2O | 0.035 gL-1 |
| Boric acid | H3BO3 | 3.1 gL-1 |
| Manganese sulfate tetrahydrate | MnSO4.4H2O | 2.23 gL-1 |
Monitoring the Growth of Microalgae
Because the stock of microalgae were 10 mL, in order to increase the initial biomass, 5 mL of each microalgae was transferred to 100 mL of BBM and Z8 medium and put in shaker under 160 rpm and 50 μmoL photon m2s-1 light intensity and 12L:12D photoperiod of 20 days. This test had two replicates. Under the hood, 5 mL of sample was taken from each flask every two days and after vortex with a sampler, 25 μL of sample was taken and the number of cells counted by Neubauer slide, then by using spectrophotometer, the maximum wavelength of C. vulgaris, S. dimorphus and S. quadricauda were obtained and optical absorbance was measured at 687 nm. The number of cells was counted using the formula; number of cells=average small cell count×4×10⁶ [19].
Biomass Calculation
To obtain more biomass, from microalgae C. vulgaris, S. dimorphus and S. quadricauda, 7.5, 12, 9.4 mL were added to six PolyethyleneTerephthalate (PET) bottles of 1000 mL, with three replicates, respectively [Table/Fig-3]. For this purpose, the same bottles were selected. The caps of them were pierced for transferring the air transfer glass pipes as well as for uniform transfer of air in the bottles; Aquarium T connector tube was used. BBM culture medium was selected as the optimal medium because the growth of each alga was maximum in this culture medium. The microalgae were incubated at 25°C, to 1000 mL BBM medium and the culture continued up to 14 days. A typical pump air was used for aeration.
The amount of microalgae inoculation into the culture BBM medium.
| Microalgae | Volume of inoculation (mL) | Inoculation (%) | Number of cell×106 |
|---|
| S. dimorphus | 12 | 10 | 8.5 |
| S. quadricauda | 9.4 | 7.8 | 10.8 |
| C. vulgaris | 7.5 | 6.3 | 13.3 |
In order to have the same amount of microalgae inoculation, it was used from inoculation of 10%, with inverse proportions. Based on the cell count per milliliter, the microalgae with a smaller cell count per milliliter had higher inoculation and microalgae, with a larger number of cells had lower inoculation [Table/Fig-3].
Every two days, cell number and turbidity was measured, and biomass and the amount of starch measured at the end of the period. To obtain the biomass of microalgae, 1000 mL of medium was centrifuged at 5000 rpm for five minutes and pellet dried at 95°C for 45 minutes inside the oven dried to achieve constant weight and then it was measured. To measure the produced starch in microalgae biomass, anthrone reagent was used [20].
For making 25 mL of anthrone solution, 6 mL of distilled water was mixed with 19 mL of 98% sulfuric acid, then 38 mg of anthrone powder added to it, the solution stored in an amber container [21].
To obtain standard curve of starch, dilutions 0.001-0.5% of starch were prepared. For starch extracting, it is necessary to break the algae cell wall. To break the algae cell wall and release the starch, acid method was used. For this purpose, 0.5 gm of algae biomass was dissolved in 25 mL of 1N HCl and mixed by stirring at 70°C for 10 minutes. Then, 100 μL of this solution was mixed with 2000 μL of anthrone solution and placed at 100°C Erlen water bath for 10 minutes and after that its optical absorbance was read at 625 nm. 100 μL of distilled water was mixed with 2000 μL of anthrone solution as control and spectrophotometer zero out by it. The standard curve was obtained by using Microsoft Excel 2007. Then optical absorbance obtained from cell wall breaking of microalgae was placed into the linear equation derived from the standard curve of starch and the amount of starch produced by algae was achieved according mg/mL [22].
Preparation of Standard Curve of Cell Count by a Spectrophotometer
In this way, reading the optical absorbance of microalgae and comparing them with standard curve, the cell number of microalgae could be determined. For standardisation, dilutions 1-50% (v/v) of media samples were prepared [23]. To calculate the specific growth rate of microalgae, following formula was used:
μ=(ln.xm.x0)1/t(μ: the specific growth rate of microalgae, t: culture duration, xm: the final amount of cells, x0: the amount of cells at the beginning of the period) [23]. Cell doubling time was calculated from this formula: G=ln2μ-1 (G: cell doubling time, μ: the specific growth rate of microalgae) [24].
Optimisation of Medium for C. vulgaris
Since, Chlorella algae ended up with the maximum growth in the BBM culture medium, it was selected as the optimal alga. Experimental design was took place by Minitab software using the Taguchi method, with three factors nitrogen, phosphorus and light at three levels (1,0,-1). Nitrogen source in the medium BBM was NaNO3 at three levels 100, 250 and 400 mg/L. Phosphorus source was K2HPO4 and KH2PO4, from each of them, three levels 125, 250 and 500 mg/L were selected. Three light intensity levels (50.7, 41.74 and 34.66 μmoL m-2 s-1) were considered. Light source included six pinkish and white fluorescent lamps [Table/Fig-4] [25].
Optimisation of medium for C. vulgaris in three level, according three factors nitrogen, phosphorus and light.
| Number repeat | NaNO3 (mg/L) | KH2PO4(mg/L)K2HPO4 | Light intensity (μmoL m-2s-1) | Number repeat | NaNO3 (mg/L) | KH2PO4(mg/L)K2HPO4 | Light intensity (μmoL. m-2.s-1) |
|---|
| 1 | 400 | 500 | 46.7 | 16 | 400 | 125 | 37.66 |
| 2 | 250 | 250 | 46.7 | 17 | 250 | 500 | 37.66 |
| 3 | 100 | 125 | 46.7 | 18 | 100 | 250 | 37.66 |
| 4 | 400 | 250 | 41.74 | 19 | 400 | 500 | 46.7 |
| 5 | 250 | 125 | 41.74 | 20 | 250 | 250 | 46.7 |
| 6 | 100 | 500 | 41.74 | 21 | 100 | 125 | 46.7 |
| 7 | 400 | 125 | 37.66 | 22 | 400 | 250 | 41.74 |
| 8 | 250 | 500 | 37.66 | 23 | 250 | 125 | 41.74 |
| 9 | 100 | 250 | 37.66 | 24 | 100 | 500 | 41.74 |
| 10 | 400 | 500 | 46.7 | 25 | 400 | 125 | 37.66 |
| 11 | 250 | 250 | 46.7 | 26 | 250 | 500 | 37.66 |
| 12 | 100 | 125 | 46.7 | 27 | 100 | 250 | 37.66 |
| 13 | 400 | 250 | 41.74 | | | | |
| 14 | 250 | 125 | 41.74 | | | | |
| 15 | 100 | 500 | 41.74 | | | | |
Statistical Analysis
The SPSS software version 16.0 was used to evaluate the growth curves; Student’s t-test was used, comparing each experimental group with the control group. To evaluate the starch content, two-way ANOVA test was used. For all analysis, a 95% confidence interval was used in the statistical tests performed with graphpad prism 5. The significant level was considered at p<0.05.
Results
In linear equation derived from cell growth of C. vulgaris in media BBM and Z8; line slopes obtained from media BBM and Z8, after 20 days were 0.846 and 0.771×10⁶ cell/mL, respectively [Table/Fig-5]. Present study showed that there is significant difference (p=0.034) between media BBM and Z8 and BBM medium was selected as a more suitable for C. vulgaris [Table/Fig-6]. In linear equation derived from cell growth of S. quadricauda in media BBM and Z8; line slopes obtained from media BBM and Z8 were 0.545 and 0.454×10⁶ cell/mL, respectively [Table/Fig-7]. Results showed that there is no significant difference between optical absorbance of media BBM and Z8 (p=0.308) [Table/Fig-8].
Cell count of C. vulgaris in both media BBM and Z8 after 20 days.

Comparing the value optical absorbance microalgae C. vulgaris between BBM and Z8.
| Culture | n | Mean±SD | p-value |
|---|
| BBM | 9 | 17.19±7.02 | 0.034 |
| Z8 | 9 | 15.73±7.11 |
| Difference | 9 | 1.462±1.717 |
95% CI for mean difference: (0.142; 2.782)
t-test of mean difference=0 (vs ≠ 0): t-value=2.55; p-value<0.05 was considered significant
SD. Standard deviation
Cell count of S. quadricauda in the media BBM and Z8 after 20 days.
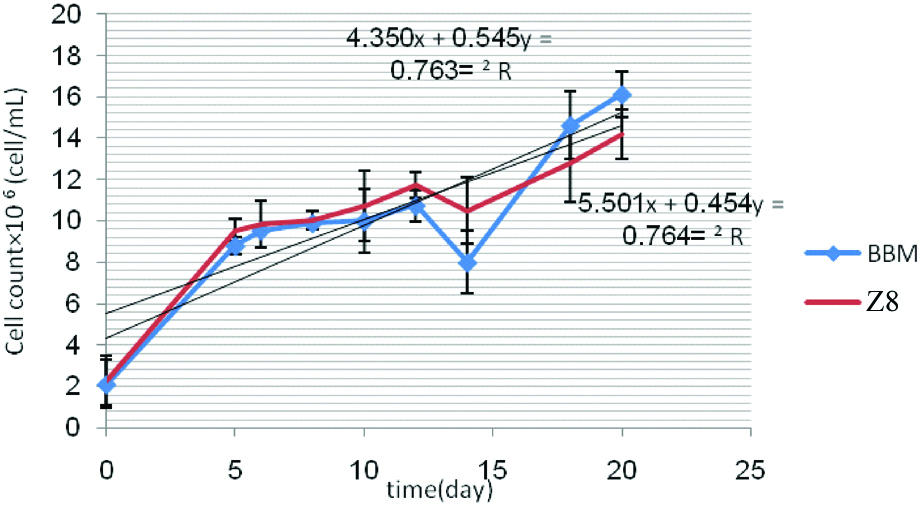
Comparing the value optical absorbance microalgae S. quadricauda between BBM and Z8.
| Culture | n | Mean±SD | p-value |
|---|
| BBM | 9 | 1.954±1.038 | 0.308 |
| Z8 | 9 | 1.829±1.012 |
| Difference | 9 | 0.126±0.347 |
95% CI for mean difference: (-0.141; 0.392)
t-test of mean difference=0 (vs ≠ 0): t-value=1.09; p-value<0.05 was considered significant
According to the more line slope obtained from linear equation of BBM medium, it was considered a more appropriate medium for S. quadricauda. In this method, linear equation derived from cell growth of S. dimorphus in media BBM and Z8; line slopes obtained were 0.879 and 0.537×10⁶ cell/mL, respectively [Table/Fig-9].
Cell count of S. dimorphus in the media BBM and Z8 after 20 days.
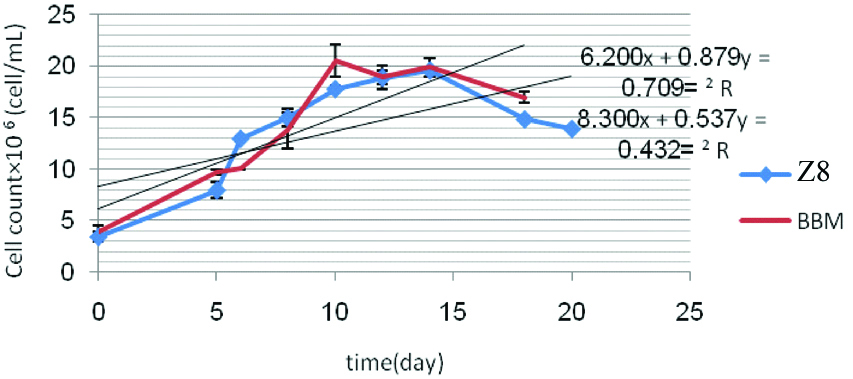
The difference between optical absorbance of BBM and Z8 media was significant (p=0.033) and BBM medium was selected a more appropriate medium for S. dimorphus [Table/Fig-10].
Comparing the value optical absorbance microalgae S. quadricauda between BBM and Z8.
| Culture | n | Mean±SD | p-value |
|---|
| BBM | 9 | 2.271±0.941 | 0.033 |
| Z8 | 9 | 2.102±0.889 |
| Difference | 9 | 0.1690±0.1965 |
95% CI for mean difference: (0.0179; 0.3201)
t-test of mean difference=0 (vs ≠ 0): t-value=2.58; p-value<0.05 was considered significant
Present study showed that the amount of daily specific growth of C. vulgaris was more than S. quadricauda and S. dimorphus, 0.075 (d-1) [Table/Fig-11].
Starch rate in biomass of desired microalgae after 20 days and specific growth, doubling time and the amount of starch in desired microalgae.
| Microalgae | Starch (% by weight of biomass) | Cell doubling time (d) | The amount of starch (gL-1d-1) | Z8 results as stated in results(μ) (d-1) | BBM results as stated in results(μ) (d-1) |
|---|
| C. vulgaris | 29 | 2.7 | 6.6 | 0.055 | 0.075 |
| S. quadricauda | 20 | 3.21 | 4.14 | 0.008 | 0.072 |
| S. dimorphus | 19 | 2.9 | 3.07 | 0.038 | 0.072 |
Cell count of desired microalgae, which were cultured in 1500 mL bottles in a similar condition in terms of light intensity, culture medium, cell number of C. vulgaris (50×106 cell/mL) was more than S. quadricauda and S. dimorphus. Differences between microalgae was significant, in terms of the cell number (mL-1) (p=0.001). According to the results of, there was significant difference between cell number of C. vulgaris compared to S. quadricauda and S. dimorphus and C. vulgaris was selected. The increase in light intensity, nitrogen and phosphorus in C. vulgaris led to increased cell growth. Repeat 3 showed more starch content, but according to the biomass in the repeat 2 and product of biomass multiply starch content, the amount of starch in repeat 2 was higher than others [Table/Fig-12].
Cell growth rate and the amount of starch produced by C. vulgaris with 9 replicates within 20 days.
| Number repeat | Average cell count (× 106 cell/mL) | Average biomass (g/L) | Average produced starch (w/w %) |
|---|
| 1 | 93.55 | 2.48 | 34±0.940 |
| 2 | 81.11 | 2.35 | 45±1.02 |
| 3 | 20.42 | 2.07 | 47±0.92 |
| 4 | 42.1 | 1.77 | 30±0.95 |
| 5 | 25.3 | 2.28 | 40±0.84 |
| 6 | 45.5 | 1.72 | 24±0.71 |
| 7 | 34 | 1.45 | 19±0.65 |
| 8 | 39.45 | 1.66 | 27±0.91 |
| 9 | 32.52 | 1.53 | 20±0.41 |
Given to performed variance analysis, (p=0.001) for light intensity (lux), (p=0.001) for the amount of nitrogen and (p=0.012) for phosphorus, the effects of light, nitrogen and phosphorus on the amount of produced starch by C. vulgaris were significant.
By increasing the light, the amount of starch in the microalgae Chlorella found to be increased.
By increasing the nitrogen content from 100 mg/L to 250 mg/L, the starch content was increased but increasing from 250 mg/L to 400 mg/L, the starch content lowered very much and the amount of phosphorus in 125 mg/L led to the greatest amount of starch.
Starch production in microalgae is depends on two factors of growth rate and cell doubling time [Table/Fig-13].
Comparison of starch production of different microalgae, based on growth rate and cell doubling time.
| Microalgae | Specific growth rate (μ) | Starch rate (gL-1d-1) | Cell doubling time (G) |
|---|
| Nannochloropsis oculata | 0.11 | 3 | 2.9 |
| C. vulgaris | 0.13 | 6.6 | 2.7 |
| S. quadricauda | 0.08 | 4.14 | 3.21 |
| S. dimorphus | 0.11 | 3.07 | 2.9 |
Discussion
The most appropriate green algae for medical and pharmaceutical applications is the one that produces the largest amount of chlorophyll-containing pyruvid (starch) in appropriate conditions in terms of light and pH. In this study, the aim was to produce starch from microalgae using optimal growth conditions which are cost effective. As such, future studies may investigate the application of the extracted starch from these algae for diseases treatment and drug production.
This study is conducted for medium optimisation of microalgae C. vulgaris to increase usage starch production in medicine, for the first time in Iran. Other research about this microalgae in Iran, conducted on cell growth, increasing biomass and oil production. Salavatian S and Fallahi M, studied the effects of different concentrations of calcium on growth and biomass of green algae C. vulgaris, using pure stoke C. vulgaris and medium Zayndr Z8±N (with different concentrations of calcium in treatments) under laboratory conditions (at 25°C±2 and 350±3500 lux light intensity) for 96 hours [26].
The amount of nitrogen in the media BBM and Z8 was 2.5 and 0.471 g/L, respectively. The [Table/Fig-6] showed that line slope obtained from linear equation of C. vulgaris growth, in BBM medium was higher than Z8. Also, weight of C. vulgaris biomass per 100 mL of BBM and Z8 was 1.738 and 1.69 gm, respectively. These results indicate that the higher amount of nitrogen in the BBM medium compared to Z8, probably lead to further growth of microalgae in BBM medium.
The way of aeration for microalgae that used at the beginning of study was aeration by shaker. The advantage of this method over bubble technique is preventing contamination with other microorganisms.
Experiments showed that this aeration method increases the growth of microalgae; but if it is inappropriate for some of microalgae can lead to destruction of cells as a result of the introduction of high stress forces [27]. Ronda SR et al., studied the effect of aeration by air pomp on the growth and production of fatty acid gamma linolenic by Spirulina platens is in the photobioreactor. The aeration rate was considered 0.2 up to 2.5 vvm. The amounts of dissolved air of 41%, 88% and 108% was obtained 2.3, 6.5 and 7.5 (mg.g-1 of cell dry weight), which showed that the biomass and the linoleic acid increased with increasing aeration. Special growth increased with increasing aeration [28]. Converti A et al., studied effect of nitrogen and temperature on growth and oil production of microalgae C. vulgaris and Nannochloropsis oculata, results showed that special growth of Chlorella was 0.14 cell in 1 mL at 25°C, but special growth decreased with increasing temperature and reached to -0.01 at 35°C. These results indicate that microalgae C. vulgaris had better growth at 25°C. microalgae Nannochloropsis oculata had better growth at 20°C [29].
Therefore, the temperature is also a factor that affects the growth of microalgae. The starch content of Chlorella in 50 μmoL photon m-2s-1 light intensity, before optimisation stages was 29% of biomass. The [Table/Fig-12] shows that after optimisation stages under 50.7 μmol m-2 s-1 of light intensity, it reached 47%.
In a study by Salavatian S et al., on the effect of calcium concentrations on growth and biomass of C. vulgaris in zinder medium it was found that the effective concentration of calcium was in the range of 0.1-15 mg/L. The cell count at this concentration was 17575675 cells/mL. Also, the absorption rate was 0.542 and the biomass reached to 17676 cells/mL [26].
Lee J et al., suggested that C. vulgaris grew negligible without CO2 and bicarbonate source. The growth rate of the algae was 2.30 and growth absorption was 0.15 [30].
In a study by Heidari SA et al., the different effects of nitrogen and ammonium on the growth of green algae S. quadricauda in the culture media were studied. Results showed that the highest alga cell density was 22.5×10⁵ and 25.2×10⁵ cells per milliliter for nitrogen and ammonium, respectively [31].
Khoeyi ZA et al., studied the effect of three light intensities of 5.5, 62.37 and 100 μmoL m-2 s-1 and different photoperiods (12L: 12D, 16L: 8D and 8L: 16D hours) on the growth rate, doubling time, and the production of C. vulgaris biomass. The highest growth rate of 1.13 per days, with an intensity of 100 micromoles of photon per m2 and a photoperiod of 8:16 was observed [32].
In [Table/Fig-14] studies the researchers, show that the use of starch diet, in the treatment of some diseases, which can be produced the starch cheaper than industrial type for medical applications by cultivating green microalgae.
The studies done on the use of starch in medicine.
| Study subject | Results | Year of publication | Reference |
|---|
| Assessment of starch dietary regimen regarding premenstrual syndrome among high school students in Sari during 2007 | The results of this study revealed that starch-rich diet intake can improve premenstrual symptoms | 2008 | 12 |
| Effect of valerian and starch on uncomfortable breathing, coughing and snoring during usual sleep habit in 50 to 60-year-old women, Iran | The findings of this study showed that valerian and starch are effective on unpleasant breathing during women’s sleep | 2011 | 13 |
| Nanoparticles made from novel starch derivatives for transdermal drug delivery | The potential use of these nanoparticles as transdermal drug delivery systems showed clear enhancers for flumin acid | 2010 | 14 |
| Resistant starch and colorectal neoplasia | As a result, the use of resistant starch significantly affects the luminal environment of the colon and causes the destruction of apoptosis of damaged genetic cells in the large intestine, some of which are known as colorectal cancer risk biomarkers | 1995 | 15 |
Limitation
There was no possibility of controlling the amount of CO2 in the laboratory environment and by using polyethylene bottles for microalgae culture, there was a possibility of contamination of the culture medium with aerobic fungi and others microalgae.
Conclusion
It was found that starch content was increased with increasing light, reducing phosphorus and nitrogen in Chlorella and the results showed that C. vulgaris could be a good choice as a starter for producing starch for medicinal purpose.
95% CI for mean difference: (0.142; 2.782)
t-test of mean difference=0 (vs ≠ 0): t-value=2.55; p-value<0.05 was considered significant
SD. Standard deviation
95% CI for mean difference: (-0.141; 0.392)
t-test of mean difference=0 (vs ≠ 0): t-value=1.09; p-value<0.05 was considered significant
95% CI for mean difference: (0.0179; 0.3201)
t-test of mean difference=0 (vs ≠ 0): t-value=2.58; p-value<0.05 was considered significant