Alcohol dependence is associated with increased mortality and morbidity. World Health Organisation’s global status report estimated that 5.9% of all global deaths and 5.1% of the global burden of disease and injury is attributable to alcohol each year [1]. National Epidemiologic Survey on Alcohol and Related Conditions (NESARC-III) indicate that 14% of adults have a current alcohol use disorder and 29% have had an alcohol use disorder over their lifetime, with the rates highest among men and those of younger age [2]. In India, 21% of adult males are current drinkers. There are approximately 61 million alcohol users and 10 million are alcohol dependent [3]. Alcohol dependents frequently smoke cigarettes or tobacco related products, i.e., they are addicted to nicotine and this has a greater effect on the development of disease. Most of the alcoholic men are smokers. Men are genetically susceptible to nicotine and alcohol dependence [4,5]. Researchers have suggested various biochemical and haematological parameters as biomarkers of alcohol dependence. The evaluation of serum LFT levels is the most used marker of liver injury in clinical practice [6]. Alcohol increases the levels of liver enzymes in the saliva and blood, an early indicator of liver injury and alcoholics are at a greater risk of developing liver damage [6]. Salivary research and its application in health and disease are becoming increasingly apparent to investigators and clinicians as saliva contains a wide range of compounds responding to toxic substances, indicating the real-time level of these markers. Saliva collection is easy, does not require specialised equipment or techniques, non-invasive and there is no risk of needlestick injuries [7]. Although the influence of alcohol abuse and smoking has been extensively studied, recent survey of literature suggests a paucity of studies in liver function marker enzymes in saliva and serum of AS and ANS. The present study was conducted to compare and correlate the levels of LFT in saliva and serum among AS and ANS.
Materials and Methods
The present study was a cross-sectional observational study, conducted at Department of Biochemistry, Father Muller Medical College, Mangaluru, Karnataka, India from January 2016 to July 2016. For an estimated average effect size of 0.28, power of 0.8 and alpha error of 0.5 the estimated total sample size was 121. The study included three groups of participants, amongst whom 45 were AS, 38 were ANS and 38 were age matched healthy volunteers. The study included total 83 alcohol dependant males that comprised of both smokers as well as non smokers, ranging in age from 19-65 years, with a history of alcohol abuse. All the patients were admitted to de-addiction centre and diagnosed as alcohol dependent by a treating psychiatrist based on the ICD-10 (the 10th revision of the International Statistical Classification of Disease), classification of mental and behavioural disorders: diagnostic criteria for research of WHO [8,9]. They were grouped further into AS and ANS based on the history of smoking. There were 45 AS, with the mean age of 36 (±10) years (range 21-60 years) and 38 ANS, with the mean age of 39 (±10) years (range 23-65 years). Follow-up studies for the same subjects after 21 days of treatment were done for assessing normalisation rates. Alcohol dependent males were further sub grouped into four categories based on amount of alcohol consumption (<180 mL; 181-360 mL; 361-540 mL; >540 mL). The volunteers who had normal LFT and had no history of alcohol consumption, smoking and any other illness were considered as control subjects. Thirty eight healthy volunteers with the mean age of 30 years (±10) years (range 19-55 years) were recruited in the study. The patients with a systemic illness such as non-alcoholic liver diseases, inflammatory disease, cancer, thyroid dysfunction, infections, psychiatric illness, substance other than alcohol and nicotine dependence, abstinence from alcohol prior to admission for treatment were excluded from the study. Voluntary informed consent was taken from all the study subjects. The study was approved by the Institutional Ethical Committee.
In this study consecutive sampling was done. Unstimulated whole saliva sample was collected between 09 AM-11 AM after two hours of breakfast in order to minimise the diurnal variation [10]. The subjects were asked to rinse the mouth thoroughly to remove any food debris and then after ten minutes, were asked to spit into sterile plastic containers, avoiding forcible spitting. The saliva samples were centrifuged at 3000 rpm for 15 min and the supernatant was collected. Five millilitres of blood was collected between 09 AM-11 AM in plain vacutainers taking aseptic precautions, centrifuged to separate serum and cells. All saliva and serum samples were stored in -80°C until analysis. Standardisation of salivary analysis was done using appropriate LFT controls and using the standardised graph the salivary levels were estimated.
LFT included TP, albumin, GGT, AST, and ALT. Estimation of TP in saliva was done by Lowry’s method as following: To 0.1 mL saliva 0.9 mL distilled water and 4 mL alkaline copper reagent were added mixed and allowed to stand at room temperature (37°C) for 10 minutes. Then 0.5 mL of 1N Folin-Ciocalteu reagent (Sigma Aldrich) was added, mixed and allowed to stand at room temperature for 30 minutes. Absorption was read at 660 nm against reagent blank [11]. Serum TP was assayed by the Biuret method as following: To 0.1 mL of serum was added to 2.9 mL of 0.9% NaCl. To this 3 mL of biuret reagent was added, mixed and incubated at room temperature (37°C) for 10 min. Absorption was read at 540 nm [12]. Level of albumin in the saliva and serum samples was assayed by Bromocresol Green (BCG) dye binding method as following: To 0.1 mL of serum, 4.9 mL of BCG reagent was added, mixed and incubated for 10 min. Absorption was read at 630 nm [13]. Activities of AST and ALT in both saliva and serum were assayed by Modified IFCC (International Federation of Clinical Chemistry) methods [14,15]. ALT is assayed by an enzymatic kinetic spectrophotometric method. Pyruvate formed from transamination of alanine is converted to lactate by lactate dehydrogenase. Rate of decrease in absorbance at 340 nm was measured. AST was assayed by enzymatic kinetic spectrophotometric method. Oxaloacetate formed from transamination of aspartate is converted to malate by malate dehydrogenase rate of decrease in absorbance at 340 nm is measured. Activity of GGT in saliva and serum was assayed by carboxy substrate method [16]. GGT catalyses the transfer of glutamyl group from L-gamma glutamyl-3-carboxy-4-anilide to glycylglycine with formation of L-gamma-glutamyl glycylglycine and 5-amino-2-nitrobenzoate. Increased absorbance at 405 nm is measured.
Statistical Analysis
One-way Analysis Of Variance (ANOVA) was used to assess the significance of difference in the means of LFT between groups. Somers D test was used to determine the association between the salivary and blood levels of LFT in ANS and AS. A spearman correlation was done to assess the association of LFT with history of smoking and amount of alcohol consumption. The results were analysed using SPSS version 23.0 software. A p-value <0.05 was considered as statistically significant.
Results
History of smoking correlated significantly with salivary TP (r=0.18; p<0.049), AST (r=0.3; p=0.001) and blood GGT (r=0.42; p<0.001), AST (r=0.38; p<0.001), ALT (r=0.3; p=0.001), however there was no significant correlation with salivary albumin (r=-0.04; p=0.68), GGT (r=0.16; p=0.08), ALT (r=0.16; p=0.07) and blood TP (r=-0.06; p=0.47), albumin (r=-0.13; p=0.15). Demographic variables of study population are shown in [Table/Fig-1]. Results of ANOVA and multiple group comparison by post-hoc analysis for salivary and blood TP, albumin, GGT, AST, and ALT before withdrawal treatment between the groups are shown in [Table/Fig-2]. There was a statistically significant difference in salivary total proteins, GGT, AST, ALT and blood levels of albumin, GGT, AST and ALT between the C vs. AS and C vs. ANS groups before withdrawal treatment. Games-Howell post-hoc test revealed that the salivary TP, GGT, AST and ALT was significantly higher in ANS and AS compared to healthy controls and before withdrawal. The blood levels of GGT, AST and ALT were also significantly higher in ANS and AS compared to healthy controls in before withdrawal. Multiple group comparison of LFT by ANOVA in abstainers showed that after 21 days of treatment there was a significant difference in salivary levels of TP and blood levels of albumin, GGT and AST between the groups. Games-Howell post-hoc test revealed that the salivary TP was significantly higher in ANS and AS compared to healthy controls and abstainers. The salivary levels of liver enzymes were not significant in abstainers indicating the normalization. The salivary TP levels were significantly increased in abstainers even after deaddiction treatment. The blood levels of GGT and AST were significantly higher in AS and ANS compared to healthy controls in abstainers. The Tukey’s post-hoc test revealed that the blood albumin level was significantly lower in AS and ANS compared to healthy controls in abstainers [Table/Fig-3]. Strength of association between salivary and blood LFT of ANS and AS was performed using Somers D correlation test shown in [Table/Fig-4]. The strength of association between study subjects, amount of alcohol consumption and the levels of GGT, AST and ALT are shown in [Table/Fig-5].
Demographic Variables in Study Subjects; Healthy Controls (C), Alcohol dependent Non-Smokers (ANS) and Alcohol dependent Smokers (AS), SE: Standard Error, n: number of subjects.
| C Mean±SE(95%CI)(n=38) | ASMean±SE(95% CI)(n=45) | ANSMean±SE(95%CI)(n=38) |
|---|
| Age (years) | 30±1.5(27.7-33.8) | 36.3±1.4(33.4 - 39.2) | 39.15±1.75(35.6 - 42.7) |
| Alcohol consumption (years) | Nil | 14.5±1.3(11.8-17) | 14.37±1.61(11.05-17.68) |
| Smoking (years) | Nil | 12.5±1 | Nil |
| Daily use of alcohol (years) | Nil | 6.1±0.94(4.2-8.0) | 7.12±1.22(4.6-9.6) |
| Morning use of alcohol (years) | Nil | 3.2±0.62(1.9-4.5) | 4.30±0.89(2.5-6.1) |
| Amount of alcohol consumption per day | Nil | <180mL n= 12 | <180mL n= 06 |
| 180-360 mL n= 20 | 180-360 mL n= 17 |
| 360-540 mL n= 11 | 360-540 mL n= 09 |
| > 540mL n= 02 | > 540mL n= 06 |
| Past history of deaddiction | Nil | No past de-addiction n=30 | No past de-addiction n=25 |
| Past de-addiction n= 15 | Past de-addiction n= 13 |
| Family history with alcohol dependence | n=2 | n=18 | n= 14 |
Comparison of LFT by one-way ANOVA in saliva and blood between C, ANS and AS before withdrawal.
| C (n=38) Mean±SE(95%CI) | AS (n=45) Mean±SE(95%CI) | ANS (n=38) Mean±SE(95%CI) | C vs. ASp-value | C vs. ANSp-value | AS vs. ANSp-value |
|---|
| Salivary levels of LFT |
| T P(g/dL) | 0.10±0.007(0.08-0.11) | 0.15±0.01(0.12-0.18) | 0.13±0.01(0.11-0.15) | 0.005** | 0.032* | 0.58 |
| Albumin (g/dL) | 0.04±0.008(0.02-0.05) | 0.03±0.004(0.03-0.04) | 0.04±0.005(0.03-0.05) | 0.93 | 1 | 0.93 |
| GGT (IU/L) | 4.42±0.35(3.7-5.1) | 8.48±0.76(6.94-10.0) | 9.56±0.87(7.79-11.3) | <0.001*** | <0.001*** | 0.62 |
| AST(IU/L) | 5.8±0.17(5.49-6.1) | 13.23±1.25(10.7-15.7) | 11.5±1.28(8.9-14.1) | <0.001*** | <0.001*** | 0.60 |
| ALT (IU/L) | 4.30±0.14(4-4.6) | 7.83±0.81(6.18-9.49) | 8.6±1(6.47-10.7) | <0.001*** | 0.001** | 0.83 |
| Blood levels of LFT |
| T P (g/dL) | 7.57±0.05(7.45-7.68) | 7.40±0.07(7.24-7.55) | 7.40±0.09(7.22-7.59) | 0.19 | 0.294 | 1 |
| Albumin (g/dL) | 4.65±0.05(4.55-4.76) | 4.44±0.05(4.33-4.54) | 4.40±0.06(4.27-4.53) | 0.018* | 0.007** | 0.90 |
| GGT (IU/L) | 23.3±1.4(20.5-26.2) | 374.3±64(245-503) | 261.4±47.5(165-357) | <0.001*** | <0.001*** | 0.33 |
| AST (IU/L) | 27.5±1.14(25.2-29.8) | 116.5±14.2 9(87-145) | 110.5±12.1(85.9-135) | <0.001*** | <0.001*** | 0.94 |
| ALT (IU/L) | 28.9±2.1(24.5-33.3) | 79.53±8.8(61.7-97.3) | 77.3±10.8(55.4-99.2) | <0.001*** | <0.001*** | 0.98 |
Analysis done by Games-Howell post-hoc test.
p*** <0.001(very highly significant), p** <0.01(highly significant), p* <0.05(significant).
Comparison of LFT by one-way ANOVA in saliva and blood between C, ANS and AS in abstainers.
| C (n=38) Mean±SE(95% CI) | AS (n=45) Mean±SE(95% CI) | ANS (n=38) Mean±SE(95% CI) | C vs. ASp-value | C vs. ANSp-value | ANS vs. AS p-value |
|---|
| Salivary levels of LFT |
| TP (g/dL) | 0.10±0.007(0.08-0.11) | 0.15±0.009(0.13-0.17) | 0.14±0.009(0.12-0.16) | <0.001*** | 0.002** | 0.94 |
| Albumin (g/dL) | 0.04±0.008(0.02-0.05) | 0.04±0.004(0.03-0.04) | 0.06±0.01(0.04-0.09) | 0.99 | 0.13 | 0.09 |
| GGT (IU/L) | 4.42±0.35(3.7-5.1) | 4.40±0.45(3.49-5.30) | 4.96±0.49(3.96-5.95) | 0.99 | 0.68 | 0.63 |
| AST (IU/L) | 5.8±0.17(5.49-6.1) | 6.7±0.71(5.2-8.1) | 5.97±0.98(3.97-7.97) | 0.47 | 0.99 | 0.82 |
| ALT (IU/L) | 4.30±0.14(4-4.6) | 4.64±0.45(3.7-5.5) | 4.7±0.5(3.64-5.75) | 0.76 | 0.75 | 0.99 |
| Blood levels of LFT |
| TP (g/dL) | 7.57±0.05(7.45-7.68) | 7.54±0.07(7.4-7.68) | 7.68±0.08(7.51-7.85) | 0.96 | 0.52 | 0.34 |
| Albumin (g/dL) | 4.65±0.05(4.55-4.76) | 4.47±0.05(4.36-4.57) | 4.47±0.05(4.37-4.58) | 0.029* | 0.049* | 1 |
| GGT (IU/L) | 23.3±1.4(20.5-26.2) | 110.3±14.8(80.4-140) | 104.8±16.8(70.8-138) | <0.001*** | <0.001*** | 0.96 |
| AST (IU/L) | 27.5±1.14(25.2-29.8) | 45.6±5.06(35.4-55.8) | 40.89±3.98(32.8- 48.9) | 0.003** | 0.007** | 0.74 |
| ALT (IU/L) | 28.9±2.1(24.5-33.3) | 38.06±3.99(30-46) | 30.97±4.2(22.4-32.5) | 0.12 | 0.92 | 0.34 |
Analysis done by Games-Howell post-hoc test.
p*** <0.001(very highly significant), p** <0.01(highly significant), p* <0.05(significant)
Correlation of salivary and blood levels of LFT between AS and ANS.
| Correlation | AS (n = 45) | ANS (n =38) |
|---|
| d | p | d | p |
|---|
| Blood TP vs. Saliva TP | 0.233 | 0.066 | 0.171 | 0.24 |
| Blood albumin vs. Saliva albumin | -0.018 | 0.86 | -0.044 | 0.746 |
| Blood GGT vs. Saliva GGT | 0.519 | <0.001 | 0.410 | <0.001 |
| Blood AST vs. Saliva AST | 0.257 | 0.01 | 0 .254 | 0.019 |
| Blood ALT vs. Saliva ALT | 0.512 | 0.001 | 0.373 | <0.001 |
Analysis done by Somers D test.
d – Strength of association, up to 0.3- (weak), 0.3-0.5 (medium), 0.5-0.8 (strong), > 0.8 (very strong).
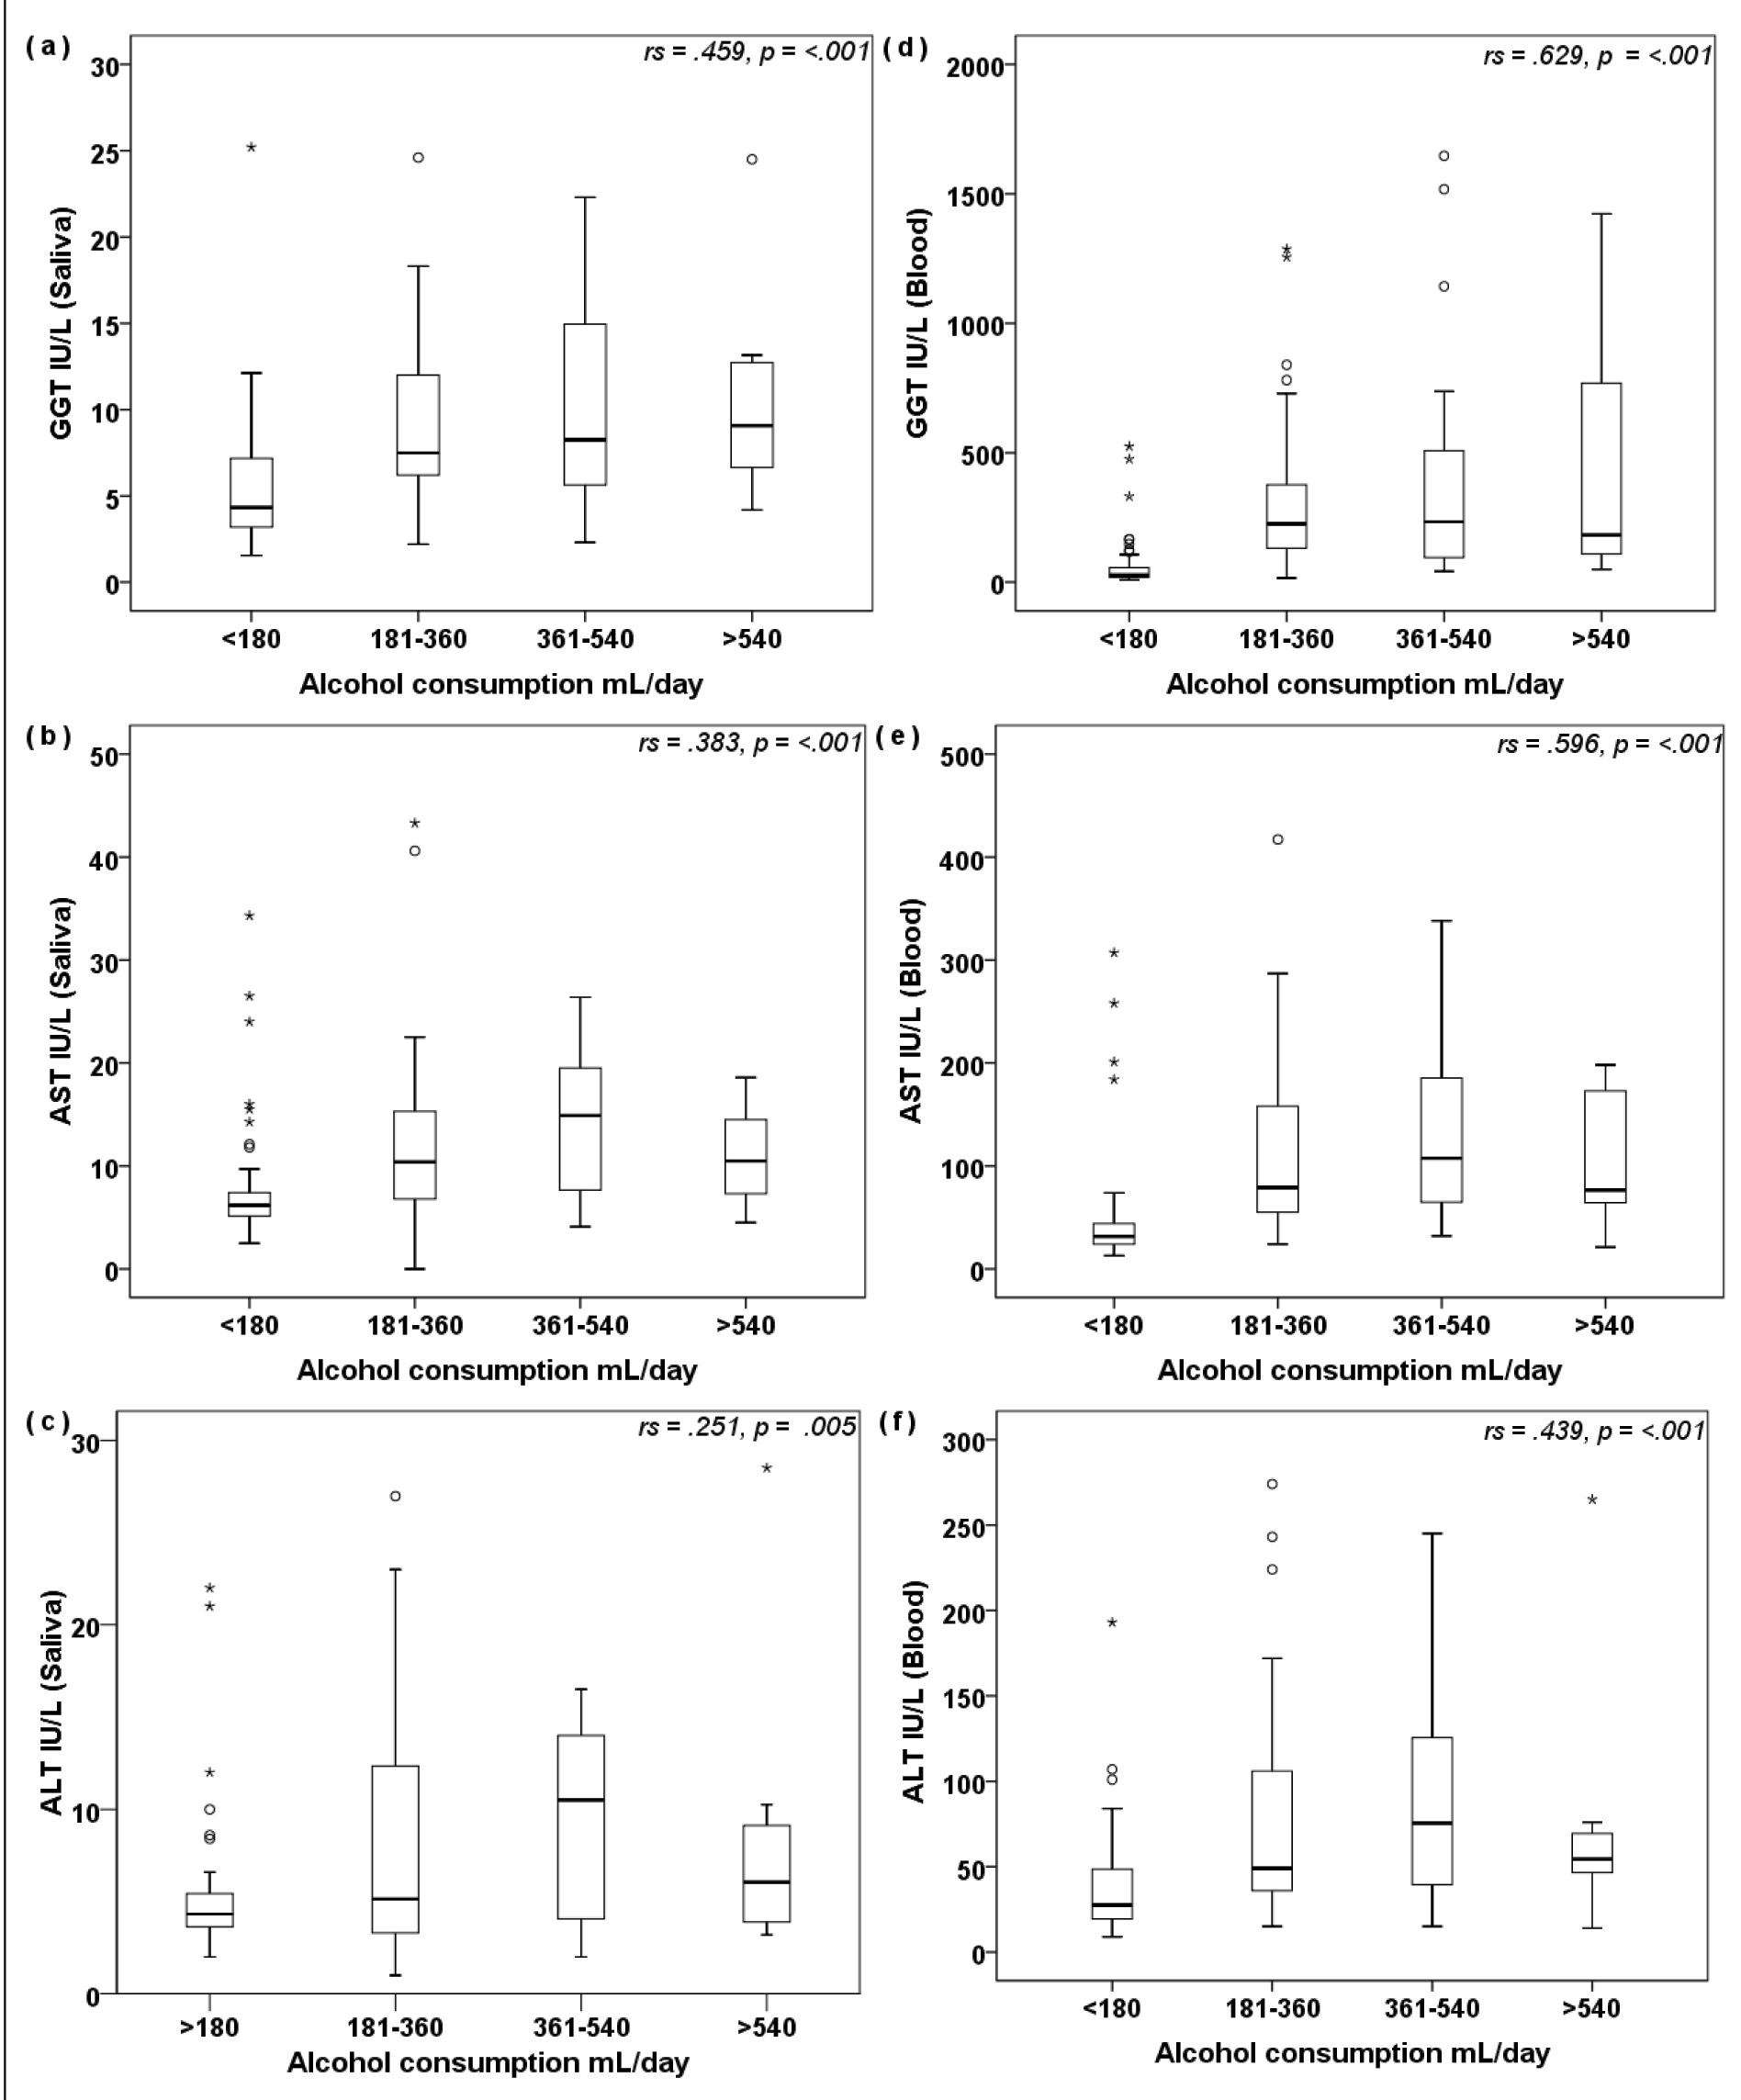
Correlations of LFT with alcohol consumption in alcohol-dependent (data of AS and ANS combined) : a,b) depict correlation of salivary GGT and serum GGT respectively; c,d) depict correlation of salivary AST and serum AST respectively; 5e,f) depict correlation of salivary ALT and serum ALT respectively, with amount of alcohol consumed/day. Analysis done by Spearman correlation; p<0.01 is statistically significant.
Discussion
Correlation of History of smoking and LFT
In our study we found a significant positive association between history of smoking with salivary TP, AST and blood GGT, AST and ALT. Similar studies have reported a positive association of smoking with GGT and AST in blood. However there are no instances of reports associating smoking in alcoholics with salivary LFT. Smoking enhances the hepatotoxic effects of alcohol, thus causing elevation in LFT and elevation of LFT in saliva of alcoholic smokers clearly reflects the same.
Comparison of salivary and blood LFT in healthy controls AS, ANS before withdrawal
In the present study, we observed significantly higher activities of LFT (GGT, AST and ALT) in saliva and blood of AS and ANS compared to healthy controls which is consistent with the previous studies [Table/Fig-6] [17,18]. Several studies have shown that smoking independently had increased levels of GGT compared to non-smokers, and alcohol drinking induces further elevation of GGT [Table/Fig-6] [19,20]. But in the present study, an insignificant elevation in blood GGT of AS compared to ANS. This indicates smoking independently does not cause liver injury but with alcohol it induces elevation of GGT in particular and may cause liver injury as reported by several other studies [21,22]. The level of TP in saliva was significantly higher in AS and ANS when compared to healthy controls. The increase in salivary TP level in alcoholics has been observed by previous studies, and the change was suggested to be due to hypertrophy and increased acinar function of the parotid gland [23]. We demonstrated significantly lower serum albumin in AS and ANS when compared to healthy controls, indicating the extent of damage to the synthetic functions of liver. Alcohol abuse causes chronic inflammation which lead to decreased levels of serum albumin [24]. The decrease in serum albumin levels with alcohol abuse and smoking has been documented in several studies but not in alcohol dependence [Table/Fig-6] [19]. There was no significant difference between AS and ANS with respect to albumin levels.
Findings of previous studies on effect of smoking and alcohol on LFT [17-21,25,29].
| Author | Sample size (n)Type of study | Groups | Remarks |
|---|
| Shivashankara AR et al., [17] | n=80 (men)Cross sectional observational study | Alcoholics,Abstainers, Controls | AST, ALT and GGT levels were significantly increased in alcoholics compared to control and abstainers. |
| Mamta S et al., [18] | n=80 (men)Cross sectional study. | Healthy controls,Alcoholics | GGT was significantly increased in alcoholics. |
| Janq ES et al., [19] | n=500Cross-sectional study | Smoking,Alcohol consumption,Coffee | Total protein and albumin showed significant decrease in smoking alcoholics.History, daily amount and lifetime amount of smoking and alcohol showed significantly raised levels of GGT. |
| Naciye K et al., [20] | n=141(98 men, 33 women)Cross sectional study | Smoking,Alcohol,Control | GGT and ALT was significantly increased in smokers and Alcoholics. AST was increased significantly in alcoholics. |
| Wannamethee SG and Shaper AG, [21] | n=4595 (men)Prospective study | Smoking,Alcohol | Heavy drinking and smoking had significantly increased GGT.Smoking was significantly associated with GGT ad ALP levels |
| Paivikki IA et al., [25] | n=2164(1028 men,1136 women)Cross sectional study | Abstainers,Moderate drinkers | Serum ALT and GGT were significantly increased in moderate drinkers compared to abstainers. |
| Whithead TP et al., [29] | n=46775 (men)Cross sectional study | Smoker,Drinker | AST, ALT and GGT showed a positive correlation with alcohol. Alcoholic Smokers had significant increase in GGT levels. No clinical significance in AST or ALT levels in alcoholic smokers. |
| Present study | n= 121 (men) | Healthy control,Alcoholic Non Smokers,Alcoholic Smokers | Smoking correlates significantly with salivary TP, AST and blood GGT, AST, ALT. Salivary GGT, AST, ALT and blood GGT, AST were high in AS and ANS compared to healthy control. Salivary GGT, AST and ALT correlated with blood levels. Amount of alcohol correlated with salivary GGT, AST and ALT. |
Normalisation of LFT in AS and ANS after withdrawal
In the present study, abstainers (AS and ANS), the salivary AST, ALT and GGT levels were normalised to the levels matching the healthy controls and hence no significant difference was observed between AS, ANS and healthy controls, whereas, only ALT levels were normalised in blood. This suggests that ALT is more sensitive to changes in liver function. Similar normalisation was reported in several studies [17,21,25].
Correlation of LFT in saliva with blood
In the present study the activities of salivary GGT, AST and ALT correlated positively with their respective blood levels in alcohol-dependent males. This was due to concentration-dependent passive diffusion of the analytes from blood to saliva across the cell membranes [22,26]. Salivary levels of LFT are dependent on blood levels due to the transport of components into saliva. The salivary glands are surrounded by dense capillaries, and blood components pass easily through capillary walls, ultrafiltration through the membrane pores or via active transport via receptors.
Correlation of LFT with amount of alcohol consumption
Previous studies suggested that chronic alcohol consumption induces important alterations of some biological parameters, in correlation with the consumption period and alcohol amount. In the present study also we observed a significant correlation between LFT and amount of alcohol consumption. The elevation of blood and salivary GGT was strongly associated with amount of alcohol but the elevation of AST and ALT were weakly associated with the same, indicating GGT is the better marker for chronic alcohol consumption [27,28].
Limitation
In the present study only history of smoking is considered to correlate with salivary and blood LFT, whereas the interaction effect of duration, amount of smoking and alcohol on LFT was not analysed.
Conclusion
Significant changes in the liver function marker enzymes in blood and saliva are observed in alcohol-dependent individuals though there was no significant difference between smoking and non-smoking alcoholics. Further studies with larger sample size, analysing the correlation between blood and saliva with respect to changes in the biochemical parameters are needed to establish salivary biomarkers of alcoholism and smoking. Studies need to assess the association of dose and duration of alcohol consumption and amount and duration of smoking with biochemical changes in blood and saliva.
Analysis done by Games-Howell post-hoc test.
p*** <0.001(very highly significant), p** <0.01(highly significant), p* <0.05(significant).
Analysis done by Games-Howell post-hoc test.
p*** <0.001(very highly significant), p** <0.01(highly significant), p* <0.05(significant)
Analysis done by Somers D test.
d – Strength of association, up to 0.3- (weak), 0.3-0.5 (medium), 0.5-0.8 (strong), > 0.8 (very strong).