As a consequence, of spinal anaesthesia sympathetic block occurs, venous return to the heart is decreased, ultimately causes hypotension and decreased cardiac output. This hypotension with or without bradycardia has adverse effects on both mother (nausea, vomiting, dysnoea, cardiovascular collapse etc.) and foetus (acidosis, neurologic injuries etc.) [2-4].
The incidence of hypotension can be lowered by several ways, but no single method is effective for complete prevention of spinal anaesthesia induced hypotension [2].
It is a common practice to give Intravenous Fluids (IVF) before and during spinal anaesthesia to prevent post spinal hypotension. However, fluid preloading is not so much effective, because volume loading does not prevent the spinal anaesthesia induced decreased systemic vascular resistance [5,6].
Now, its a trend to use vasopressors due to its direct vasoconstrictor effects. Vasopressors, like ephedrine or phenylephrine are generally used intravenously, but there is always a chance of raised Heart Rate (HR) and Blood Pressure (BP) [4].
Phenylephrine, a pure α-1 adrenergic agonist, can counteract the decreased systemic vascular resistance induced by spinal anaesthesia without increasing the HR. It is effective when given IM or IV [4]. Phenylephrine is a rapidly acting agent with a short duration of action. Other advantages of phenylephrine include high efficacy, ability to maintain maternal BP near normal.
The usual approach for using phenylephrine in this clinical setting is reactive rather than proactive; spinal anaesthesia induced maternal hypotension is allowed to develop and then treated through intravenous (IV) phenylephrine; however, treatment after onset of hypotension is associated with higher incidence and severity of maternal predelivery hypotension [8].
A more logical approach is to prevent spinal anaesthesia induced hypotension by administrating prophylactic phenylephrine, because this approach inhibits the exposure of mother and foetus to the hypotensive state [8].
Prophylactic administration of IV phenylephrine is associated with a higher incidence of hypertension with or without bradycardia, that’s why IV route is not a good choice for prophylactic therapy [7].
IM phenylephrine can be prescribed as prophylactic agent; onset of action of IM phenylephrine is slower than IV phenylephrine, so its onset of action may be matched with time of onset of spinal anaesthesia induced hypotension [6]. Although, literature evidence, is currently inadequate about which dose of IM phenylephrine is sufficient enough to control the spinal anaesthesia induced hypotension in caesarean section with minimal side effects.
On this background, the present study was conducted to determine the efficacy and safety of prophylactic doses of IM phenylephrine for prevention of spinal anaesthesia induced hypotension in caesarean section.
Materials and Methods
A double blinded, randomised, interventional, placebo controlled study was conducted from July 2013 to September 2013 in Obstetrics and Gynaecology operation theatre of a tertiary teaching hospital. Institutional Ethics Committee approval letter no. F78/Pr/COMJNMH/I.E.C/42/(27) dated 26/04/2013. CTRI registration no. CTRI/2014/11/005218 dated 21/11/2014.
A power analysis was performed by assuming 70% incidence of hypotension in the control group and revealed that a sample size of 26 patients in each group shall have 90% power to detect a 35% reduction in the incidence of hypotension, with Type I error probability (α) of 0.05 and 10% of dropout [9]. Total sample size was 104 subjects.
After obtaining Institutional Ethics Committee’s approval, total 104 pregnant women between 18-30 years, American Society of Anaesthesiologists (ASA) physical status I or II, weight 50-90 kg, height 145-165 cm, having uncomplicated singleton pregnancy beyond 36 weeks, scheduled to have elective caesarean section under spinal anaesthesia were recruited for this study.
Subjects with foetal malpresentation, Pregnancy Induced Hypertension (PIH), hypertensive or resting BP≥160/90 mmHg before surgery, cardiac disease, systemic illness (renal disease, diabetes mellitus, coagulation disorder etc), chronic medications were excluded from the study.
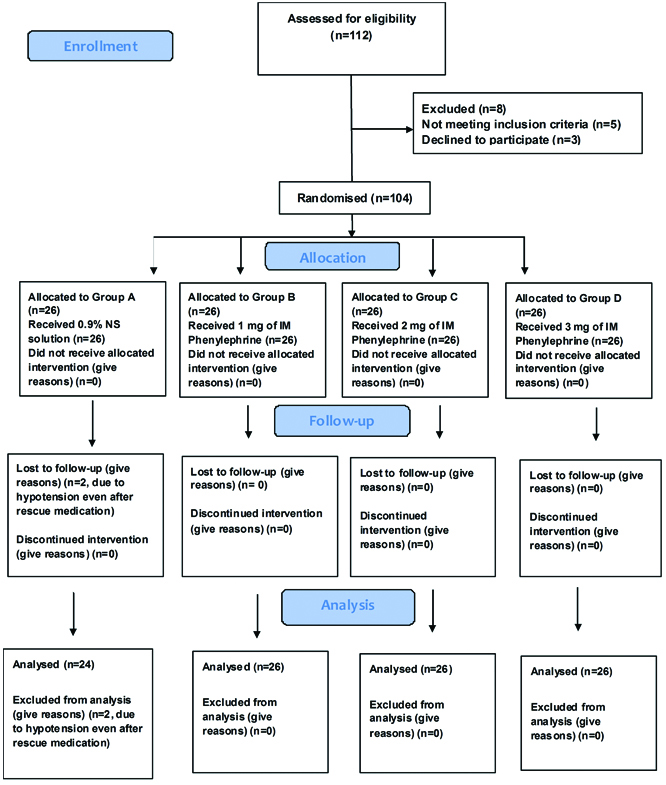
After obtaining written informed consent, subjects were randomly (computer generated random numbers) allocated, where every subject had a chance to get allocated in any group, to receive 0.9% normal saline solution (Group A), or 1 mg of IM phenylephrine (Group B) or 2 mg of IM phenylephrine (Group C), or 3 mg of IM phenylephrine (Group D).
All medication with phenylephrine was made up to 2 mL with 0.9% saline. All patients were managed by an anaesthesiologist who was blind to the identity of the study medication.
No premedication was given to the study patients. Before spinal anaesthesia, 18 gauge IV catheter was introduced in the vein of left forearm of each patient. After that 500 mL IVF Ringer lactate was infused over 15 minutes as preloading. Then Ringer lactate infusion was continued throughout the operation and one hour after the operation at a rate of 4 mL/kg/hr through infusion pump.
Non Invasive Blood Pressure (NIBP), Electrocardiography (ECG) and pulse oximetry were attached for monitoring the BP, HR and O2 saturation. Baseline SBP, DBP, MBP, HR were recorded. Then, patients were placed in sitting position and after antiseptic dressing and draping, a 25 gauge spinal needle was inserted in L2-3 or L3-4 vertebral inter-space, spinal anaesthetic agent, hyperbaric bupivacaine 0.5%, 2.5 mL was administered intrathecally.
Thereafter, patients were placed supine with left lateral uterine displacement at 15° angle. The IM injection of the study medication was given into the lateral aspect of the right thigh. Then, SBP, DBP, MBP, HR were recorded at three minutes interval throughout the surgery (average time for surgery was 27-30 minutes) (in the present study the average time was 27 minutes) and 10 minutes interval for one hour after surgery [4].
Hypotension was defined as SBP of <90 mmHg or fall of MBP more than 25% from the baseline MBP. Patients who met either criterion were treated with rescue IV bolus dose of phenylephrine 100 mcg. The same dose was repeated in three minute interval if both SBP and MBP would not increase above the threshold levels. Treatment with IV atropine 0.6 mg was given if bradycardia (defined as HR<50 bpm) occured, and if required repetition of the same dose in six minute interval. Subsequently no increase above the threshold level after two rescue dose (either phenylephrine or atropine, or both), the patient was excluded from the study. After delivery of the shoulders of the baby, patients received 5 IU of oxytocin by slow IV.
Efficacy parameters were assessed through the data of SBP, MBP, DBP. Any changes in ECG, HR or any other adverse events were also noted in detail.
Statistical Analysis
Statistical analysis was done only after the completion of Case Record Form (CRF) of the last subject.
Data were represented as mean±SEM. Categorical data were compared between groups by Fisher’s exact test. As the data could not pass the normality test, numerical data between the groups were analysed by Kruskall-Wallis (nonparametric) test, whereas within the group were analysed by Friedman’s ANOVA (nonparametric) followed by Dunn’s Multiple Comparison test as post hoc test. All analyses were two tailed and p<0.05 was taken to be statistically significant.
Results
A total of 104 subjects were randomised during the period of July 2013 to September 2013. Out of 104, 102 completed the study as per protocol, two subjects were excluded from the study as to hypotension was not controlled by rescue medications in (Group A) and needed different medications. There were 24 subjects in Group A (placebo treated group), whereas 26 subjects each in Group B (phenylephrine 1 mg IM), Group C (phenylephrine 2 mg IM) and Group D (phenylephrine 3 mg IM) [Table/Fig-1].
The subjects in all groups had comparable demographic profiles, laboratory parameters and baseline efficacy parameters [Table/Fig-2].
Shows demographic parameters, laboratory parameters, efficacy parameters.
| Parameters | Group A (N=24) | Group B (N=26) | Group C (N=26) | Group D (N=26) | p-value |
|---|
| Demographic parameters |
| Age (years) | 25.15±0.80 | 25.54±0.76 | 23.7±0.57 | 23.43±0.69 | 0.08 |
| Gestational age (weeks) | 39.09±0.4 | 38±0.21 | 37.9±0.16 | 38.57±0.25 | 0.33 |
| Height (cm) | 157.7±0.69 | 155.3±1.58 | 157.05±0.6 | 157.26±0.45 | 0.86 |
| Weight (kg) | 56.77±1.16 | 57.72±0.84 | 56.52±0.96 | 58.47±0.67 | 0.45 |
| Laboratory parameters |
| Haemoglobin (gm%) | 11.3±0.19 | 11.3±0.21 | 10.85±0.18 | 11.4±0.23 | 0.24 |
| FBS (mg/dL) | 82.55±1.88 | 83±1.66 | 82.7±1.78 | 86.65±1.4 | 0.14 |
| PPBS (mg/dL) | 126.6±1.36 | 128.63±1.17 | 125.15±1.04 | 129.13±1.23 | 0.08 |
| Urea (mg/dL) | 19.77±0.73 | 19.23±0.71 | 20±0.74 | 21.04±0.8 | 0.4 |
| Creatinine (mg/dL) | 0.59±0.06 | 0.62±0.02 | 0.63±0.08 | 0.66±0.03 | 0.58 |
| Efficacy parameters |
| SBP (mmHg) | 128.2±1.77 | 127.13±1.58 | 125.7±2.08 | 121.82±2.61 | 0.31 |
| DBP (mmHg) | 82.25±1.46 | 83.9±0.83 | 80.95±2.1 | 79.56±2.17 | 0.69 |
| MBP (mmHg) | 97.5±1.38 | 98.36±0.9 | 96±1.99 | 93.86±2.18 | 0.58 |
| PR (beats/min) | 99.45±3.89 | 99.4±2.95 | 92.5±2.71 | 97.95±2.58 | 0.5 |
| O2 Saturation (SpO2%) | 99.2±0.17 | 99.04±0.26 | 92.5±2.71 | 97.95±2.58 | 0.88 |
FBS-Fasting blood sugar, PPBS-Postprandial blood sugar
p-value for comparison of the study groups was from Kruskal Wallis H test (non parametric test).
All parameters were comparable between groups
There were significant changes of SBP in Group A over different time points (compared to the baseline), whereas in Group D, the SBP was maintained (least variability) throughout the surgery except in SBP-8, (p<0.05), and also throughout one hour of postoperative period. Group C had less fluctuation than Group B in respect of SBP [Table/Fig-3].
Shows systolic blood pressure at various time period in Group A, Group B, Group C, and Group D.
| Groups | Group A | Group B | Group C | Group D |
|---|
| Mean±SEM | p-value | Mean±SEM | p-value | Mean±SEM | p-value | Mean±SEM | p-value |
|---|
| Systolic blood pressure before and during surgery | Baseline | 127.68±1.78 | | 127.13±1.58 | | 125.7±2.08 | | 121.82±2.61 | |
| 1 minute after drug administration | 117.8±2.82* | <0.05 | 113.45±4.12 | >0.05 | 121.35±3.6 | >0.05 | 118.73±2.58 | >0.05 |
| SBP-1 (1+3=4 minutes after drug administration) | 107.1±3.87* | <0.05 | 108.68±4.02** | <0.01 | 118.45±3.17 | >0.05 | 115.43±3.53 | >0.05 |
| SBP-2 (4+3=7 minutes after drug administration) | 108.5±3.28* | <0.05 | 112.81±3.93* | <0.05 | 115.95±3.46 | >0.05 | 117.08±3.14 | >0.05 |
| SBP-3 (7+3=10 minutes after drug administration) | 106.5±2.81* | <0.05 | 114.31±3.16 | <0.05 | 112.35±3.98 | >0.05 | 117.39±3.69 | >0.05 |
| SBP-4 (10+3=13 minutes after drug administration) | 102.8±3.02*** | <0.001 | 106.95±2.23*** | <0.001 | 113.85±3.55 | >0.05 | 119.08±3.81 | >0.05 |
| SBP-5 (13+3=16 minutes after drug administration) | 99.8±3.38*** | <0.001 | 105.4±1.97*** | <0.001 | 110.6±3.19* | <0.05 | 116.6±3.82 | >0.05 |
| SBP-6 (16+3=19 minutes after drug administration) | 96.75±1.77*** | <0.001 | 100.95±2.46*** | <0.001 | 105.6±2.83*** | <0.001 | 114.65±3.59 | >0.05 |
| SBP-7 (19+3=22 minutes after drug administration) | 99.85±3.01*** | <0.001 | 100.85±3.09*** | <0.001 | 107.4±2.88** | <0.01 | 112.43±3.51 | >0.05 |
| SBP-8 (22+3=25 minutes after drug administration) | 98.94±2.21*** | <0.001 | 100.18±3.03*** | <0.001 | 108±2.76*** | <0.001 | 105.8±2.58* | <0.05 |
| SBP-9 (25+3=28 minutes after drug administration) | 97.23±3.55*** | <0.001 | 104.92±3.39*** | <0.001 | 108.5±3.15* | <0.05 | 107.39±2.89 | >0.05 |
| Systolic blood pressure (postoperative) | SBP-10 (10 minutes after surgery) | 99±2.64*** | <0.001 | 102.4±2.92*** | <0.001 | 108.15±2.93** | <0.01 | 113.6±3.01 | >0.05 |
| SBP-20 (20 minutes after surgery) | 100.45±3.28*** | <0.001 | 105.68±2.45*** | <0.001 | 108.95±2.36* | <0.05 | 115.47±3.13 | >0.05 |
| SBP-30 (30 minutes after surgery) | 102.25±2.09*** | <0.001 | 106.63±2.57*** | <0.001 | 111.55±2.56 | >0.05 | 118.3±2.44 | >0.05 |
| SBP-40 (40 minutes after surgery) | 103.25±2.92*** | <0.001 | 111.09±1.63* | <0.05 | 112.35±2.8 | >0.05 | 118.47±2.02 | >0.05 |
| SBP-50 (50 minutes after surgery) | 106.25±2.31* | <0.05 | 113.63±1.65 | <0.05 | 112.75±3.05 | >0.05 | 120.65±1.47 | >0.05 |
| SBP-60 (60 minutes after surgery) | 107.3±2.13* | <0.05 | 115.45±1.78 | <0.05 | 112.35±2.49 | >0.05 | 120±1.38 | >0.05 |
Statistical analysis for comparisons of SBP within the group (with baseline comparison) was performed by nonparametric Friedman’s ANOVA followed by post-hoc analysis by Dunn multiple comparison test.
p-value<0.05 considered significant different with baseline.***=p<0.001, **=p<0.01, *=p<0.05
Least fluctuation of SBP was seen in Group D followed by Group C
The same results were seen in case of DBP [Table/Fig-4], and MBP [Table/Fig-5]. Group D had the least variability [decrease DBP was seen in DBP-8 (p<0.001), and DBP-9 (p<0.01)] followed by Group C, then Group B.
Shows diastolic blood pressure at various time period in Group A, Group B, Group C, and Group D.
| Groups | Group A | Group B | Group C | Group D |
|---|
| Mean±SEM | p-value | Mean±SEM | p-value | Mean±SEM | p-value | Mean±SEM | p-value |
|---|
| Diastolic blood pressure before and during surgery | Baseline | 82.25±1.46 | | 83.3±0.8 | | 80.95±2.1 | | 79.56±2.17 | |
| 1 minute after drug administration | 76.55±2.39 | >0.05 | 73.14±2.66 | >0.05 | 75.1±3.63 | >0.05 | 75.26±2.25 | >0.05 |
| DBP-1 (1+3=4 minutes after drug administration) | 69.75±2.7 | >0.05 | 68.92±2.38** | <0.01 | 73.75±2.82 | >0.05 | 73.95±2.27 | >0.05 |
| DBP-2 (4+3=7 minutes after drug administration) | 68.65±2.07 | >0.05 | 69.73±2.22** | <0.01 | 71±2.88 | >0.05 | 73.04±2.23 | >0.05 |
| DBP-3 (7+3=10 minutes after drug administration) | 67.3±2.02* | <0.05 | 69.37±1.72** | <0.05 | 69.95±3.13 | >0.05 | 71.69±2.63 | >0.05 |
| DBP-4 (10+3=13 minutes after drug administration) | 63.2±2.48*** | <0.001 | 65.45±1.98*** | <0.001 | 69±2.51 | >0.05 | 74.3±3.28 | >0.05 |
| DBP-5 (13+3=16 minutes after drug administration) | 60.45±3.43*** | <0.001 | 66.51±2.12*** | <0.001 | 66.95±2.73** | <0.01 | 70.21±3.47 | >0.05 |
| DBP-6 (16+3=19 minutes after drug administration) | 58±1.73*** | <0.001 | 60.54±2.11*** | <0.001 | 63.95±2.57*** | <0.001 | 69.43±3.16 | >0.05 |
| DBP-7 (19+3=22 minutes after drug administration) | 60.7±2.77*** | <0.001 | 58.8±2.46*** | <0.001 | 67.1±2.35* | <0.05 | 69±3.17 | >0.05 |
| DBP-8 (22+3=25 minutes after drug administration) | 61.42±2.47*** | <0.001 | 58.31±2.24*** | <0.001 | 66.21±2.89** | <0.01 | 64.23±2.15*** | <0.001 |
| DBP-9 (25+3=28 minutes after drug administration) | 65.61±2.24 | >0.05 | 65.38±1.28*** | <0.001 | 68.67±2.08 | >0.05 | 64.44±2.74** | <0.01 |
| Diastolic blood pressure (postoperative) | DBP-10 (10 minutes after surgery) | 58.9±2.52*** | <0.001 | 61±2.66*** | <0.001 | 67.35±2.64* | <0.05 | 71±2.28 | >0.05 |
| DBP-20 (20 minutes after surgery) | 64.1±3.83*** | <0.001 | 63.5±2.03*** | <0.001 | 68.2±2.15* | <0.05 | 73.91±2.92 | >0.05 |
| DBP-30 (30 minutes after surgery) | 66.25±1.89** | <0.01 | 64.5±2*** | <0.001 | 69.6±2.25 | >0.05 | 75.21±1.96 | >0.05 |
| DBP-40 (40 minutes after surgery) | 64.85±2.18** | <0.01 | 68.59±1.56** | <0.01 | 72±1.98 | >0.05 | 75.04±1.7 | >0.05 |
| DBP-50 (50 minutes after surgery) | 67.35±1.82 | >0.05 | 69.81±1.09** | <0.05 | 71.45±1.73 | >0.05 | 76.65±1.44 | >0.05 |
| DBP-60 (60 minutes after surgery) | 70.9±1.54 | >0.05 | 71.68±1.33 | >0.05 | 72.4±1.73 | >0.05 | 77.13±1.23 | >0.05 |
p-value<0.05 considered significant different with baseline. ***p<0.001, **p<0.01, *p<0.05
Least fluctuation of SBP is seen in Group D followed by Group C
Result shows minimal fluctuations of DBP in various time periods in Group D
Shows mean arterial blood pressure at various time period in Group A, Group B, Group C, and Group D.
| Groups | Group A | Group B | Group C | Group D |
|---|
| Mean±SEM | p-value | Mean±SEM | p-value | Mean±SEM | p-value | Mean±SEM | p-value |
|---|
| Mean arterial blood pressure before and during surgery | Baseline | 97.5±1.38 | | 98.36±0.9 | | 96±1.99 | | 93.86±2.18 | |
| 1 minute after drug administration | 90.3±2.37 | >0.05 | 86.27±3.17 | >0.05 | 90.8±3.45 | >0.05 | 90.13±2.36 | >0.05 |
| MBP-1 (1+3=4 minutes after drug administration) | 82.65±3.14 | >0.05 | 82±2.96*** | <0.001 | 88.7±2.81 | >0.05 | 88.43±2.44 | >0.05 |
| MBP-2 (4+3=7 minutes after drug administration) | 82.15±2.47* | <0.05 | 83.86±2.86** | <0.01 | 85.7±2.96 | >0.05 | 87.17±2.54 | >0.05 |
| MBP-3 (7+3=10 minutes after drug administration) | 80.35±2.18* | <0.05 | 84.77±2.14* | <0.05 | 84.05±3.26 | <0.05 | 87±2.89 | >0.05 |
| MBP-4 (10+3=13 minutes after drug administration) | 76.5±2.57*** | <0.001 | 78.72±2.09*** | <0.001 | 84±2.74* | >0.05 | 89.26±3.3 | >0.05 |
| MBP-5 (13+3=16 minutes after drug administration) | 73.45±3.34*** | <0.001 | 79.18±1.96*** | <0.001 | 81.6±2.81** | <0.01 | 85.65±3.47 | >0.05 |
| MBP-6 (16+3=19 minutes after drug administration) | 70.65±1.56*** | <0.001 | 74.04±2.11*** | <0.001 | 77.7±2.53*** | <0.001 | 84.6±3.15 | >0.05 |
| MBP-7 (19+3=22 minutes after drug administration) | 73.2±2.66*** | <0.001 | 72.8±2.51*** | <0.001 | 80.5±2.44*** | <0.001 | 83.34±3.2 | >0.05 |
| MBP-8 (22+3=25 minutes after drug administration) | 73.94±2.28*** | <0.001 | 72.3±2.32*** | <0.001 | 80.2±2.72** | <0.01 | 77.76±2.18*** | <0.001 |
| MBP-9 (25+3=28 minutes after drug administration) | 74.76±3.01*** | <0.001 | 78.53±1.69*** | <0.001 | 82±2.24** | <0.01 | 78.67±2.66** | <0.01 |
| Mean arterial blood pressure (postoperative) | MBP-10 (10 minutes after surgery) | 71.8±2.4*** | <0.001 | 74.22±2.39*** | <0.001 | 81.1±2.63** | <0.01 | 85.17±2.46 | >0.05 |
| MBP-20 (20 minutes after surgery) | 75.7±3.53*** | <0.001 | 77.4±2.02*** | <0.001 | 81.8±2.05* | <0.05 | 88.08±2.85 | >0.05 |
| MBP-30 (30 minutes after surgery) | 78.25±1.73*** | <0.001 | 78.5±1.98*** | <0.001 | 83.7±2.26 | >0.05 | 89.95±2.08 | >0.05 |
| MBP-40 (40 minutes after surgery) | 77.3±2.37*** | <0.001 | 82.68±1.4** | <0.01 | 85.35±2.2 | >0.05 | 89.43±1.71 | >0.05 |
| MBP-50 (50 minutes after surgery) | 80.15±1.83* | <0.05 | 84.4±0.91 | >0.05 | 85.3±2.06 | >0.05 | 91.3±1.36 | >0.05 |
| MBP-60 (60 minutes after surgery) | 82.75±1.67 | <0.05 | 86.4±1.25 | >0.05 | 85.05±1.9 | >0.05 | 91.45±1.2 | >0.05 |
Statistical analysis for comparisons of MBP within the group (with baseline comparison) were performed by nonparametric Friedman’s ANOVA followed by post hoc analysis by Dunn multiple comparison test.
p-value<0.05 considered significant different with baseline. ***p<0.001, **p<0.01, *p<0.05
Least fluctuation of SBP is seen in Group D followed by Group C
HR in all groups was steadily maintained in intraoperative as well as first one hour of postoperative period (p>0.05) [Table/Fig-6]. In HR, all groups were comparable, and there was no significant difference in comparison to baseline in all four groups.
Shows heart rate at various time period in Group A, Group B, Group C, and Group D.
| Groups | Group A | Group B | Group C | Group D |
|---|
| Mean±SEM | p-value | Mean±SEM | p-value | Mean±SEM | p-value | Mean±SEM | p-value |
|---|
| Heart rate before and during surgery | Baseline | 99.45±3.89 | | 99.4±2.95 | | 92.5±2.71 | | 97.95±2.58 | |
| 1 minute after drug administration | 98.6±3.44 | >0.05 | 96.36±4.43 | >0.05 | 93.6±3.22 | >0.05 | 91.56±3.7 | >0.05 |
| HR-1 (1+3=4 minutes after drug administration) | 101.4±3.22 | >0.05 | 91.63±4.3 | >0.05 | 91.55±3.52 | >0.05 | 93.82±3.64 | >0.05 |
| HR-2 (4+3=7 minutes after drug administration) | 98±3.65 | >0.05 | 89.59±3.76 | >0.05 | 94.05±2.77 | >0.05 | 90.08±2.59 | >0.05 |
| HR-3 (7+3=10 minutes after drug administration) | 103.25±2.56 | >0.05 | 86.54±3.12 | >0.05 | 89.8±3.57 | >0.05 | 93.26±3.32 | >0.05 |
| HR-4 (10+3=13 minutes after drug administration) | 98.3±3.03 | >0.05 | 89.13±2.63 | >0.05 | 90.35±3.25 | >0.05 | 89.47±2.7 | >0.05 |
| HR-5 (13+3=16 minutes after drug administration) | 102.15±2.33 | >0.05 | 92.36±2.31 | >0.05 | 92.5±2.93 | >0.05 | 94.43±2.59 | >0.05 |
| HR-6 (16+3=19 minutes after drug administration) | 100.2±2.7 | >0.05 | 96.5±3.06 | >0.05 | 92.35±3.08 | >0.05 | 98.04±2.41 | >0.05 |
| HR-7 (19+3=22 minutes after drug administration) | 100.95±2.42 | >0.05 | 93.57±3.64 | >0.05 | 93.05±2.9 | >0.05 | 94.26±2.56 | >0.05 |
| HR-8 (22+3=25 minutes after drug administration) | 99.78±3.48 | >0.05 | 97.75±4.01 | >0.05 | 88.63±2.73 | >0.05 | 97.14±3.3 | >0.05 |
| HR-9 (25+3=28 minutes after drug administration) | 100.76±4.08 | >0.05 | 97.84±3.68 | >0.05 | 92.73±2.58 | >0.05 | 95.22±2.77 | >0.05 |
| Heart rate (postoperative) | HR-10 (10 minutes after surgery) | 101.9±2.32 | >0.05 | 95.59±2.83 | >0.05 | 92.2±2.86 | >0.05 | 94.17±2.53 | >0.05 |
| HR-20 (20 minutes after surgery) | 102.65±2.38 | >0.05 | 90.36±2.97 | >0.05 | 90.7±2.04 | >0.05 | 93.82±2.13 | >0.05 |
| HR-30 (30 minutes after surgery) | 100.2±2.25 | >0.05 | 88.18±2.22 | >0.05 | 87.6±2.19 | >0.05 | 91.6±1.86 | >0.05 |
| HR-40 (40 minutes after surgery) | 92.8±2.55 | >0.05 | 84.86±2 | >0.05 | 85.7±1.53 | >0.05 | 89.04±1.45 | >0.05 |
| HR-50 (50 minutes after surgery) | 90.6±2.45 | >0.05 | 84.86±1.16 | >0.05 | 84.65±1.2 | >0.05 | 89.47±1.32 | >0.05 |
| HR-60 (60 minutes after surgery) | 88.55±1.94 | >0.05 | 83.9±1.15 | >0.05 | 84.05±1.02 | >0.05 | 88.12±1.14 | >0.05 |
Statistical analysis for comparison of heart rate within the group (with baseline comparison) were performed by nonparametric Friedman’s ANOVA followed by post hoc analysis by Dunn multiple comparison test.
p-value<0.05 considered significant different with baseline.
Incidence of hypotension [Table/Fig-7] was frequently seen in Group A over different time points, least incidence was observed in Group D.
Incidence of hypotension in different groups.
| Group | None | Once | Twice | Thrice | 4 times | 5 times | 6 times | 7 times |
|---|
| Group A | 2 | 0 | 2 | 1 | 5 | 7 | 4 | 3 |
| Group B | 4 | 2 | 2 | 1 | 4 | 9 | 3 | 1 |
| Group C | 6 | 11 | 2 | 4 | 2 | 1 | 0 | 0 |
| Group D | 18 | 0 | 5 | 3 | 0 | 0 | 0 | 0 |
Group D was better than Group A (p<0.001), Group B (p<0.001) and Group C (p<0.007) in respect of total amount of rescue medication requirement. So, Group D required least amount of rescue medication which is statistically significant [Table/Fig-8,9].
Shows requirement of total rescue medication in four different groups.
| Rescue medication (mcg) | Group A (N=24) | Group B (N=26) | Group C (N=26) | Group D (N=26) |
|---|
| Mean±SEM | 435±39.25 | 368.18±46.7 | 200±38.38 | 73.91±22.85 |
Shows group-wise comparison of rescue medication requirement.
| Groups | p-value |
|---|
| Group A vs. Group B | 0.44 |
| Group A vs. Group C | 0.0003 |
| Group A vs. Group D | <0.001 |
| Group B vs. Group C | 0.01 |
| Group B vs. Group D | <0.001 |
| Group C vs. Group D | 0.007 |
p-value from Mann-Whitney nonparametric t-test<0.05 considered significant.
It is seen than Group D subjects received least amount of rescue medication that was statistically significant.
Another analysis was done in respect of how many subjects received rescue medications, it was seen that Group D was better than Group A (p<0.001), Group B (p<0.0002) and Group C (p 0.0019), as to least number of subjects in this group received rescue medication. [Table/Fig-10,11].
Shows number of subjects received rescue medication in four groups.
| Rescue medication received | Group A (N=24) | Group B (N=26) | Group C (N=26) | Group D (N=26) |
|---|
| Yes | 22 (91.67%) | 22 (84.61%) | 20 (76.92%) | 8 (30.76%) |
| No | 2 (8.33%) | 4 (15.39%) | 6 (23.08%) | 18 (69.24%) |
Group-wise comparison of number of subjects received rescue medication.
| Groups | p-value |
|---|
| Group A vs. Group B | 0.66 |
| Group A vs. Group C | 0.23 |
| Group A vs. Group D | <0.001 |
| Group B vs. Group C | 0.72 |
| Group B vs. Group D | 0.0002 |
| Group C vs. Group D | 0.0019 |
p-value from Fisher’s Exact test, p<0.05 was considered significant.
It is seen that Group D subjects received least number of rescue medication.
Nausea and vomiting were the only adverse effects observed in the patients under study. Here, Group D was better than Group A (p<0.001) and Group B (p=0.0006) but comparable with Group C (p 0.41). Subjects of Group D had least incidence of nausea and vomiting [Table/Fig-12,13]. There was no episode of raised BP or bradycardia observed in the present study.
Shows incidence of adverse events in various groups.
| Nausea, Vomiting | Group A (N=24) | Group B (N=26) | Group C (N=26) | Group D (N=26) |
|---|
| Yes | 16 (66.67%) | 14 (53.84%) | 5 (19.23%) | 2 (7.69%) |
| No | 08 (33.33%) | 12 (46.16%) | 21 (80.77%) | 24 (92.31%) |
Shows group-wise comparison of nausea, vomiting.
| Groups | p-value |
|---|
| Group A vs. Group B | 0.39 |
| Group A vs. Group C | 0.001 |
| Group A vs. Group D | <0.001 |
| Group B vs. Group C | 0.02 |
| Group B vs. Group D | 0.0006 |
| Group C vs. Group D | 0.41 |
p-value from Fisher’s exact test, p<0.05 was considered significant. It was seen that incidence of adverse effects were least in Group D, but comparable with Group C (p=0.41)
Discussion
This study reports that 3 mg IM phenylephrine (Group D) is more effective to prevent the spinal anaesthesia induced hypotension in elective caesarean section than other different doses of phenylephrine (1 mg in Group B and 2 mg in Group C). We have not designed our study to include 4 mg of IM phenylephrine. Recent studies observed that haemodynamic control can be achieved with increasing dose of IM phenylephrine [5,6,8]. In another recent study it was observed that infusion regimen required a higher total dose of phenylephrine to maintain maternal arterial blood pressure at baseline during the predelivery period [10].
Subjects who received 3 mg of IM phenylephrine, hypotensive episodes were minimal among them, consecutively they received minimal amount of rescue medication. In a clinical trial 4 mg and 2 mg phenylephrine was administered to patients to evaluate the reduction of hypotension under spinal anaesthesia, it was observed that the incidence of hypotension was 25% in 4 mg group and 46.66% in group 2 mg. In this study it was concluded that preemptive IM phenylephrine 4 mg reduces the severity of spinal anaesthesia induced hypotension [6].
In a recent study it was observed that prophylactic administration was associated with a higher incidence of hypertension and bradycardia, but in the present study there was no episode of hypertension or bradycardia [7].
Subjects who received 3 mg IM phenylephrine had least incidence of nausea and vomiting than other groups. Recent meta-analytic technique also suggested that the risk of nausea or vomiting was reduced by almost 80% in the women receiving α-agonists [11].
Use of IV phenylephrine for correcting spinal anaesthesia induced hypotension is well established [11]; however, giving IM phenylephrine before spinal anaesthesia is more controversial due to risks of phenylephrine induced hypertension with or without bradycardia if spinal anaesthesia fails. We justified delaying the administration of IM phenylephrine until induction of spinal anaesthesia.
The timing of IM drug administration to achieve optimum efficacy is mostly unpredictable. Pharmacokinetic studies shows that the peak effect of IM phenylephrine is 10-15 minutes after administration [12]. The onset of subarachnoid block is seen within minutes, initially there were the episodes of hypotension; however, 3 mg IM phenylephrine decreased the frequency and incidence of hypotensive episode thereafter.
It was not possible to administer phenylephrine before spinal anaesthesia, because if there was failure of spinal anaesthesia, the patient would be suffering from phenylephrine induced hypertension with or without bradycardia.
Limitation
The present study had some limitation like effect of phenylephrine on foetus was not assessed (umbilical arterial cord pH for foetal acidosis, APGAR score), higher dose group (4 mg IM or above) was not included in this study, drug concentration was not measured.
Conclusion
To conclude, it can be said that prophylactic 3 mg IM phenylephrine is effective and safe to reduce the incidence of spinal anaesthesia induced hypotension in caesarean section with minimal adverse effect.
Further study will be needed with larger population (without the above limitations) to detect the ideal IM dose of phenylephrine that will be maximally effective for the prevention of spinal anaesthesia induced hypotension, with minimal adverse effect.
FBS-Fasting blood sugar, PPBS-Postprandial blood sugar
p-value for comparison of the study groups was from Kruskal Wallis H test (non parametric test).
All parameters were comparable between groups
Statistical analysis for comparisons of SBP within the group (with baseline comparison) was performed by nonparametric Friedman’s ANOVA followed by post-hoc analysis by Dunn multiple comparison test.
p-value<0.05 considered significant different with baseline.***=p<0.001, **=p<0.01, *=p<0.05
Least fluctuation of SBP was seen in Group D followed by Group C
p-value<0.05 considered significant different with baseline. ***p<0.001, **p<0.01, *p<0.05
Least fluctuation of SBP is seen in Group D followed by Group C
Result shows minimal fluctuations of DBP in various time periods in Group D
Statistical analysis for comparisons of MBP within the group (with baseline comparison) were performed by nonparametric Friedman’s ANOVA followed by post hoc analysis by Dunn multiple comparison test.
p-value<0.05 considered significant different with baseline. ***p<0.001, **p<0.01, *p<0.05
Least fluctuation of SBP is seen in Group D followed by Group C
Statistical analysis for comparison of heart rate within the group (with baseline comparison) were performed by nonparametric Friedman’s ANOVA followed by post hoc analysis by Dunn multiple comparison test.
p-value<0.05 considered significant different with baseline.
p-value from Mann-Whitney nonparametric t-test<0.05 considered significant.
It is seen than Group D subjects received least amount of rescue medication that was statistically significant.
p-value from Fisher’s Exact test, p<0.05 was considered significant.
It is seen that Group D subjects received least number of rescue medication.
p-value from Fisher’s exact test, p<0.05 was considered significant. It was seen that incidence of adverse effects were least in Group D, but comparable with Group C (p=0.41)