Introduction
The first step in the assessment of hematologic function and diagnosis is the careful assessment of the blood elements. Leukocytes serve in immune function and include variety of sub-populations which have specific functions and characteristic morphologic appearances [1-3]. One of the first indicators of an underlying pathology is the change in the concentration of peripheral blood leukocytes. Presence of a disease is not ruled out by a normal total white blood cell (WBC) count, but leukopenia or leukocytosis provides an important clue to the disease process and deserves further investigation which includes leukocyte differential count to identify the concentration of different types of WBC’s [4]. DLC comprises of five cell types namely neutrophils, lymphocytes, eosinophils, monocytes and basophils. Extended Differential Count (EDC) comprises of counting cells additional to the five leukocyte population e.g., IGs. EDC plays an important role in clinical and haematological analysis of several leukopathies [5].
Leukopenic samples pose a challenge for leukocyte differential count and require longer review time than samples having WBC count within the normal reference range or having elevated count [6]. Accurate and timely delivery of DLC reports by haematology laboratories is important and crucial in various clinical settings [7].
In the present era of multispeciality hospitals having high workload, there has arisen a necessity of reliable automated haematology analysers which can help to reduce slide review rate for manual differentials, aid in accurate reporting, standardise the process, increase efficacy of processing samples and reduce the TAT.
Hence, the present study aims to compare DLC and IG flagging by new automated haematology analyser XN1000 with findings of manual method in leukopenic blood samples.
Materials and Methods
A prospective hospital based study was carried out from November 2013 to June 2015 on 346 patients of both OPD and IPD, referred to the Department of Pathology, Shri BM Patil Medical College, Hospital and Research Centre, Vijayapur, Karnataka, India in whom CBC count investigation was requested. Ethical clearance was obtained from the institution.
Inclusion criteria: All blood samples recorded as leukopenia (WBC count ≤4.00x10³/μL) by haematology analyser (XN1000) were included.
Exclusion criteria: Blood samples with WBC count ≤1.00x10³/μL were excluded.
Venous blood samples in K2 EDTA vacutainers were used for the CBC analysis within two hours after collection using Sysmex XN1000. All leukopenic samples enumerated by the analyser with or without IG flagging were included and the data were tabulated.
Peripheral blood smears of each of these samples were prepared using Leishman stain and evaluated for Leukocyte Differential Cell (LDC) Count for 200 cells by manual method according to National Committee for Clinical Laboratory Standards (NCCLS) Document H20-A protocol [8]. Additional slides were processed in parallel in cases where it was difficult to count 200 leukocytes on one slide. The result of manual count was expressed as the number per 100 leukocytes counted, for comparison with automated analyser result. IG count was represented by the total count of metamyelocytes, myelocytes and promyelocytes. Both, IG percentage (IG%) and absolute counts (IG#) were analysed. Manual absolute count for each parameter was calculated by multiplying the percentage obtained by manual differential count of the respective parameter with the total leukocyte count enumerated by the analyser. The data was tabulated and correlated with automated cell counter counts.
The triggering threshold for IG flagging was factory setting. To determine a positive smear finding, we used the criteria recommended by the International Society of Laboratory Hematology (ISLH) [9,10]. The presence of myelocytes/promyelocytes ≤1% and/or metamyelocytes >2% qualified for a true-positive smear finding [9-11]. A sample was classified as True Positive (TP) if it was flagged for presence of IGs by the analyser and had a positive peripheral smear finding according to ISLH criteria. Sample was classified as False Positive (FP), if it was flagged for presence of IGs but had no Peripheral Smear Finding (PSF) in the microscopic analysis. A sample was classified as False Negative (FN) if it was not flagged for IG but had a positive PSF. Finally, a sample was classified as True Negative (TN) if it wasn’t flagged for IG and had no positive PSF on microscopic analysis [10,11].
Statistical Analysis
Statistical analysis was done using linear regression and correlation analysis by SPSS statistical software package, version 20.0 for Windows (SPSS inc., Chicago, USA), Primer and Excel spread-sheet 2007 (REDMOND, WA, Microsoft Corporation, USA). Mean counts were compared using Student’s t-test. A p-value ≤0.05 was considered statistically significant. Pearson’s correlation coefficient and regression analysis was used for correlation studies. The correlation coefficient (r) was interpreted as following: r≤0.35-weak/low correlation, r=0.36 to 0.67-modest/moderate correlation and r=0.68 to 1.00-strong/high correlation. Receiver Operating Characteristic (ROC) curve analysis was performed to determine the optimal cut-off values of IG% and IG# for flagging status. Bland-Altman plot analysis was also performed to compare the two measurement techniques. The predictive value of instrument flagging for the presence of IGs after clinical review was expressed by the following parameters [10-12]:
Sensitivity (%)=[TP/(TP+FN)]×100,
pecificity (%)=[TN/(TN+FP)]×100,
Positive predictive value (%)=[TP/(TP+FP)]×100,
Negative predictive value (%)=[TN/(TN+FN)×100,
Efficiency (%)=[(TP+TN)/(TP+FP+FN+TN)]×100 and,
Microscopic review rate (%)=[(TP+FP)/(TP+FP+FN+TN)]×100.
Results
Differential Leukocyte Count Percentage and Absolute Count Analysis
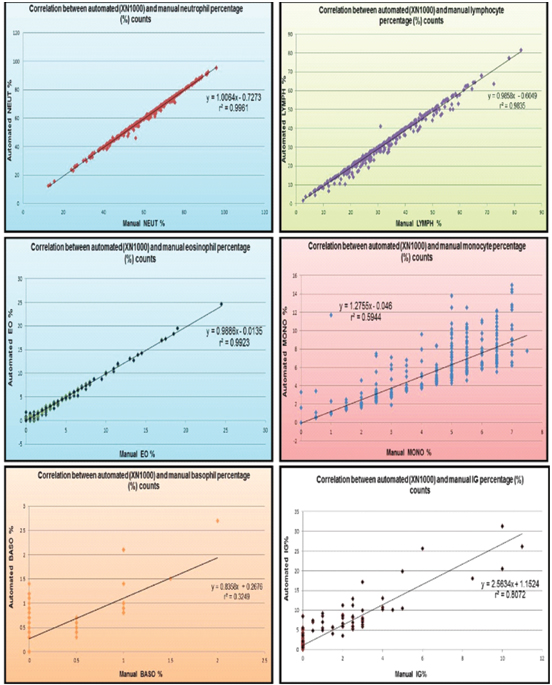
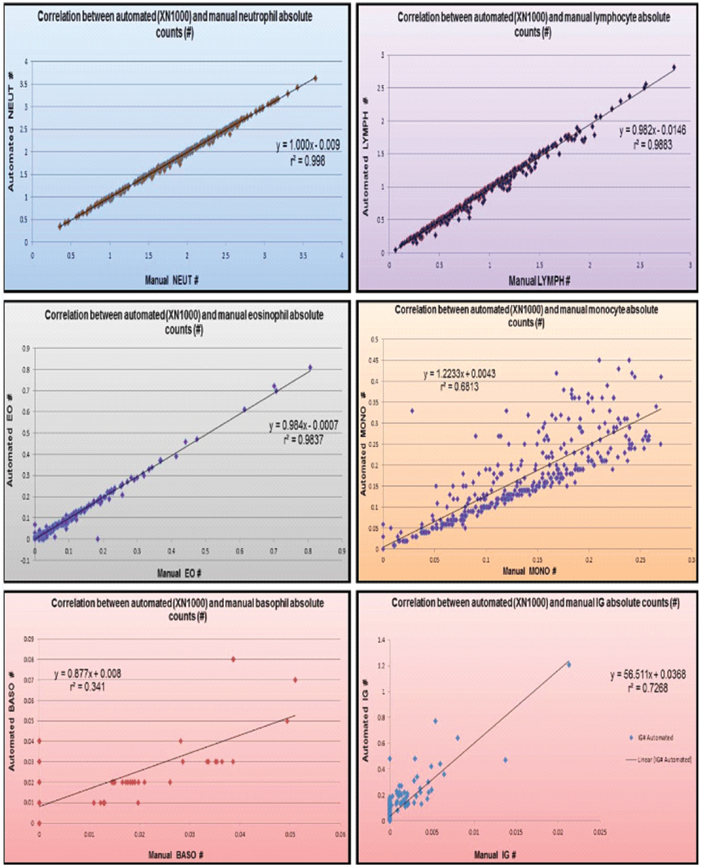
Measurement range of DLC percentage (relative/proportional counts) and absolute counts by manual method and their association with the respective automated counts (by XN1000) is depicted in [Table/Fig-1,2].
Association of extended differential leukocyte count percentage values (%) by automated haematology analyser XN1000 with manual method.
| Parameter | No. | Min. | Max. | Mean | Std. Deviation | Student t-test (p-value) |
|---|
| Neutrophils |
| Manual | 346 | 12.5 | 96.0 | 61.33 | 15.43 | p=0.775** |
| Automated | 346 | 12.4 | 95.5 | 60.99 | 15.56 |
| Lymphocytes |
| Manual | 346 | 2.5 | 82.5 | 31.63 | 14.59 | p=0.341** |
| Automated | 346 | 1.6 | 81.7 | 30.58 | 14.50 |
| Eosinophils |
| Manual | 346 | 0.0 | 24.5 | 2.55 | 3.50 | p=0.871** |
| Automated | 346 | 0.0 | 24.6 | 2.51 | 3.48 |
| Monocytes |
| Manual | 346 | 0.0 | 7.5 | 4.42 | 1.73 | p<0.001* |
| Automated | 346 | 0.0 | 15.0 | 5.60 | 2.86 |
| Basophils |
| Manual | 346 | 0.0 | 2.0 | 0.07 | 0.25 | p<0.001* |
| Automated | 346 | 0.0 | 2.7 | 0.33 | 0.37 |
| IG |
| Manual | 346 | 0.00 | 11.0 | 0.42 | 1.38 | p<0.001* |
| Automated | 346 | 0.00 | 31.3 | 2.23 | 3.94 |
*, significant;**, not significant; IG: immature granulocytes; [Statistical analysis, Student’s t-test.]
Association of differential leukocyte absolute count values (#) by automated haematology analyser XN1000 with manual method.
| Parameter | No. | Min. | Max. | Mean | Std. Deviation | Student t-test (p-value) |
|---|
| Neutrophils (x103/μL) |
| Manual | 346 | 0.351 | 3.66 | 1.82 | 0.63 | p=0.835** |
| Automated | 346 | 0.350 | 3.64 | 1.81 | 0.63 |
| Lymphocytes (x103/μL) |
| Manual | 346 | 0.062 | 2.84 | 0.94 | 0.49 | p=0.421** |
| Automated | 346 | 0.040 | 2.81 | 0.91 | 0.49 |
| Eosinophils (x103/μL) |
| Manual | 346 | 0.000 | 0.81 | 0.08 | 0.11 | p=0.232** |
| Automated | 346 | 0.000 | 0.81 | 0.07 | 0.11 |
| Monocytes (x103/μL) |
| Manual | 346 | 0.000 | 0.27 | 0.13 | 0.06 | p<0.001* |
| Automated | 346 | 0.000 | 0.45 | 0.17 | 0.10 |
| Basophils (x103/μL) |
| Manual | 346 | 0.000 | 0.05 | 0.00 | 0.01 | p<0.000* |
| Automated | 346 | 0.000 | 0.08 | 0.01 | 0.01 |
| IG |
| Manual | 346 | 0.00 | 0.02 | 0.004 | 0.00 | p<0.000* |
| Automated | 346 | 0.00 | 1.21 | 0.0605 | 0.00 |
*, significant; **, not-significant; IG, immature granulocytes; [Statistical analysis, Student;s t-test.]
Differential Leukocyte Count Correlation Analysis
Pearson’s correlation coefficient analysis showed a significant positive 6strong correlation between automated and manual neutrophil, lymphocyte, eosinophil and monocyte percentage and absolute counts. Basophils showed significant positive moderate correlation for both percentage and absolute counts [Table/Fig-3,4,5].
Correlation between automated (XN1000) and manual extended differential leukocyte percentage and absolute counts
| Correlation coefficient (r) |
|---|
| Parameter | Absolute counts (#) [x103μL] | Relative counts (%) |
|---|
| Neutrophil | 0.999 | 0.998 |
| Lymphocyte | 0.994 | 0.992 |
| Eosinophil | 0.996 | 0.996 |
| Monocyte | 0.825 | 0.771 |
| Basophil | 0.585 | 0.570 |
| Immature Granulocytes | 0.908 | 0.898 |
Statistical analysis, Pearson’s correlation coefficient and regression analysis
Correlation analysis of differential leukocyte and immature granulocyte percentage counts.
Correlation analysis of differential leukocyte and immature granulocyte absolute counts.
Immature Granulocyte Analysis
Measurement range of IG% and IG# values by manual method and their association with the respective automated counts is depicted in [Table/Fig-1,2]. Pearson’s correlation coefficient analysis showed a significant positive strong correlation between automated and manual IG percentage and absolute counts (r=0.898 and r=0.908 respectively) [Table/Fig-3,4,5].
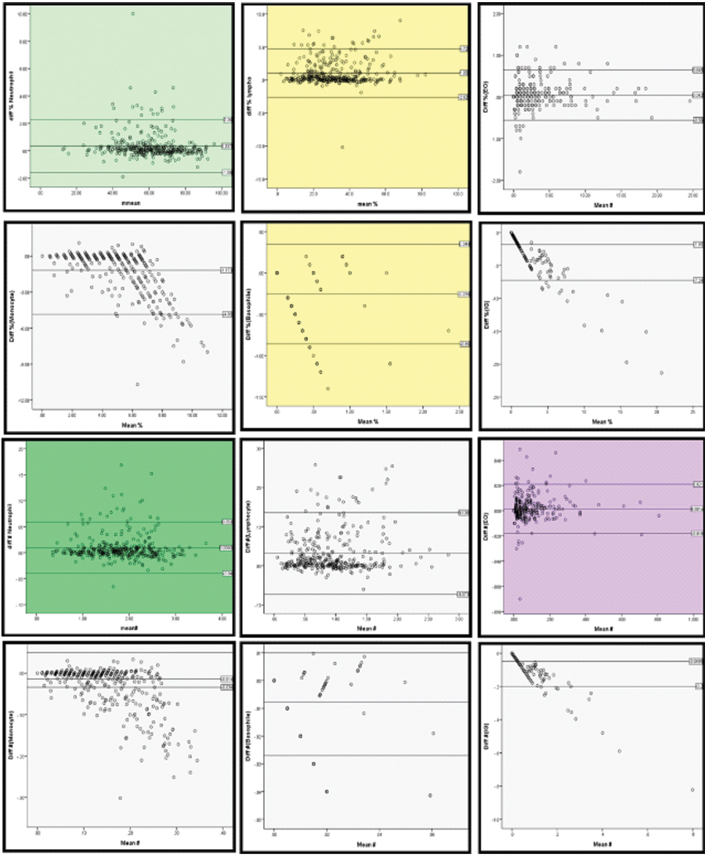
Bland-Altman plot analysis results have been computed in [Table/Fig-6] and it shows a good agreement between automated and manual method of evaluation of all the parameters.
Bland- Altman plot analysis of differential leukocyte and immature granulocyte percentage and absolute counts.
The ROC curve of IG% and IG# for predicting flagging was constructed. The Area Under Curve (AUC) was found to be 0.997 (i.e., 95% confidence interval=0.993 to 1.0) for percentage values and 1 for absolute counts values. Also, the curve is significantly different from 0.5 since p-value <0.001 i.e., logistic regression classifies the group significantly better than by chance. The best cut-off value of IG% and IG# for predicting flagging was 3.45% [(sensitivity 100% and specificity and 97.9%), determined with a standard error (SE) of 0.002] and 0.105x10³/μL (sensitivity 100% and specificity 100%) respectively.
[Table/Fig-7] depicts the truth table of IG flagging. Thirty-six samples were TP’s, 25 FP’s, 1 FN and 284 TN’s. Sensitivity of 97.30%, specificity of 91.91%, PPV of 59.02%, NPV of 99.65% and overall efficiency of 92.49% was observed for IG flagging. The microscopic review rate for IG flagging by analyser (XN1000) was only 17.63%.
Truth table variables and performance characteristics of immature granulocytes flaggingby XN1000 in comparison with manual reference method
| Parameter | Percentage |
|---|
| True positives | 36 |
| False positives | 25 |
| False negatives | 01 |
| True negatives | 284 |
| Sensitivity (Sn) % | 97.30% |
| Specificity (Sp) % | 91.91% |
| Positive predictive value (PPV) % | 59.02% |
| Positive predictive value (NPV) % | 99.65% |
| Efficiency (%) | 92.49% |
| Microscopic Review Rate (MRR) % | 17.63% |
Discussion
Often slides made from leukopenic samples, have insufficient number of cells for doing a differential count and it is difficult to observe cells in sufficient number in the ideal zone of counting. Majority of these samples are collected from patients receiving chemotherapy and/or radiotherapy, which can lead to morphological changes in the cells making the manual evaluation more difficult. Hence, there lies an immense need of automated differential counts especially in high throughput laboratories for the evaluation of leukopenic samples [13].
Comparative Analysis of Differential Leukocyte Percentage Counts
A DLC should be performed to establish when leukocyte sub-population is increased or decreased in order to identify the underlying pathological process [5,14]. In present study strong positive correlation (r=0.998, 0.992, 0.996 and 0.771) was observed between automated and manual neutrophil, lymphocyte, eosinophil and monocyte proportional/percentage counts. Monocyte correlation was less compared to lymphocyte correlation. Various studies show moderate to strong correlation for monocytes [Table/Fig-8]. Monocyte count is generally seen to be at variance, depending on the counting method. Few reasons for this discrepancy are: Firstly, monocytes tend to accumulate at the tail-end of smear (as they are larger cells) which is not the counting area. Secondly, they are difficult to distinguish morphologically from activated lymphocytes, hence are commonly skipped in the manual differential count. Thirdly, monocytes identification becomes difficult in smears made from blood sample drawn and kept for long before processing. Fourthly, they are less in number, therefore small differences are accentuated [15].
Comparison of differential leukocyte percentage and absolute count correlation analysis among various studies.
| Correlation coefficient (r) |
|---|
| STUDY | NEUT | LYMPH | EO | MONO | BASO |
|---|
| % | # | % | # | % | # | % | # | % | # |
|---|
| Ruzicka K et al., [12] | 0.925 | - | 0.922 | - | 0.877 | - | 0.756 | - | 0.763 | - |
| Kim H et al., [16] | 0.616 | - | 0.653 | - | 0.604 | - | 0.444 | - | 0.067 | - |
| Maciel TES et al., [18] | 0.991 | - | 0.99 | - | 0.974 | - | 0.872 | - | 0.557 | - |
| Stamminger G et al., [22] | - | 0.993 | - | 0.975 | - | 0.957 | - | 0.9370 | - | 0.544 |
| Herklotz R and Huber AR [23] | 0.9874 | 0.999 | 0.9866 | 0.987 | 0.9542 | 0.966 | 0.8629 | 0.8360 | 0.5798 | 0.510 |
| Weiland TH et al., [24] | - | 0.996 | - | 0.969 | - | 0.986 | - | 0.910 | - | 0.674 |
| Briggs C et al., [25] | - | 0.981 | - | 0.989 | - | 0.810 | - | 0.647 | - | 0.198 |
| Walters J and Garrity P [34] | 0.970 | - | 0.970 | - | 0.900 | - | 0.850 | - | 0.650 | - |
| Langford K et al., [35] | 0.95 | - | 0.96 | - | 0.94 | - | 0.90 | - | 0.76 | - |
| Meintker L et al., [36] | 0.9456 | - | 0.9284 | - | 0.6468 | - | 0.6844 | - | 0.08 | - |
| Present study | 0.998 | 0.999 | 0.992 | 0.994 | 0.996 | 0.996 | 0.771 | 0.825 | 0.570 | 0.585 |
NEUT: Neutrophils; LYMPH: Lymphocytes; EO: Eosinophils; MONO: Monocytes; BASO: Basophils; %: Percentage counts; #: Absolute counts
Our results were in concordance with the studies done by other authors [Table/Fig-8]. Kim H et al., [16] in contrast to our study had a moderate correlation for NEUT%, LYMPH%, EO% and MONO% (r=0.616, 0.653, 0.0.604 and 0.444 respectively).
The value of r2 for NEUT%, LYMPH% and EO% in our study was 0.996, 0.984, 0.992 and 0.594 respectively which was in concordance with the findings of Seo JY et al., [17] study (r2=0.93, 0.94 and 0.81 respectively). Value of r2 MONO% was 0.594 contrast to the findings of Seo JY et al., [17] study (r2=0.76-strong correlation).
Basophils showed least correlation (r=0.570) in our study. A finding similar to previous studies. A possible explanation for this low correlation could be that basophils are present in low numbers in normal people’s blood, which increases imprecision in their differential count [18]. [Table/Fig-8] illustrates correlation analysis of BASO% with previous studies.
The value of r2 for BASO% in our study was 0.325 which signified weak correlation and was similar to the findings of Seo JY et al., [17] study, r2=0.08 (poor correlation).
Comparative Analysis of Differential Leukocyte Absolute Counts
Currently, leukocyte differentials are performed primarily on automated haematology analysers, which provide both absolute and proportional leukocyte differential count. An increase in the sub type does not mean that total WBC count also has to be raised [14]. CAP Hematology and Clinical Microscopy Resource Committee and the Clinical Laboratory Standards Institute recommendations state that absolute count is the preferred reporting method for the leukocyte differential [14,19]. The use of absolute counts is recommended as they provide more accurate diagnostic information [14].
Absolute neutrophil count is more accurate than total leukocyte count in predicting bacteraemia and is critically important for such patients [20,21]. It provides useful screening information about bone marrow myeloid activity [22]. Our study showed strong correlation (r=0.999) between automated and manual neutrophil absolute counts (NEUT#) along with LYMPH# (r=0.994) and EO# (r=0.996). MONO# showed a strong correlation (r=0.825) but this correlation was to a lesser extent compared with NEUT#, LYMPH# and EO# correlations. Our study findings were comparable with other study findings [Table/Fig-8]. Moderate correlation (r=0.585) was observed for BASO# between automated and manual methods. This was in concordance with the studies done by Herklotz R and Huber AR [23], Stamminger G et al., [22] and Weiland TH et al., [24] Briggs C et al., [25] observed a poor correlation (r=0.1983) for BASO#, a finding contrast to our observation [Table/Fig-8].
Value of r2 for NEUT#, LYMPH#, EO# and MONO# in our study was 0.998, 0.988, 0.984 and 0.66 which were comparable to the finding of Briggs C et al., [26] study (r2=0.98, 0.99, 0.94 and 0.681). Basophils# r2 value in our study (r2=0.341) showed weak correlation in contrast to the strong r2 value obtained by Briggs C et al., [26] (r2=0.70) in their study.
There are several limitations of critical significance to laboratories, in regard to manual leukocyte differential counts, both from a diagnostic and an economic point of view. Manual method is very labor-intensive and time-consuming, especially in leukopenic samples. It requires preparation of peripheral blood smears, which involves fixation, staining, washing, drying and microscopic review by a trained medical technologist or a pathologist. As per recommendations, 200 cells should be counted; however, often it is not possible to count more than 100 cells in leukopenic samples making the manual differential results more imprecise in these samples. Quite often, WBC’s located in inappropriate sections of the haematocytometer are also counted in order to obtain a result from a leukopenic sample [13]. NCCLS H20A protocol recommends parallel slides to be processed if needed, in such cases (leukopenic blood samples), which again is labour-intensive and time consuming, thus increasing the pressure on laboratories which have a high number of leukopenic samples [8,13].
Hospital laboratories in recent years, are receiving an increasing number of leukopenic samples, due to an increase in the number of patients receiving chemotherapy, radiotherapy and transplantation. The morphology of WBCs in these samples may be altered, which adds to the challenge and make manual leukocyte differential counts more difficult. It is for this reason; manual leukocyte differentials show higher variability in leukopenic samples [13]. Therefore, need of automation is highly felt while dealing with leukopenic samples. They are few studies of leukocyte differential on XN1000. However, reasonable number of studies on XE-2100 (which works on the similar principle) are found in literature and have been compared with the present study.
Comparative Analysis of Immature Granulocytes
Presence of IG in peripheral blood provides considerable information regarding increased bone marrow activity. Manual examination differentiates the subpopulation of IGs whereas automated analysers provide a combined value of IG summarising all the three immature cells. It remains unclear whether this single IG value can replace microscopic differential values. However, increased levels of IG have been observed in patients presenting with sepsis. This parameter could be used for monitoring patients with infections and/or sepsis and is a fast, inexpensive screening method, especially in paediatric population [22,27,28]. The interest in application of this parameter in facilitating diagnosis of moderate to severe SIRS has been driven by the soaring costs in the treatment of critical illness [29].
Correlation analysis of IG% and IG# in our study yielded strong correlation between automated and manual IG counts with r=0.898 and 0.908 respectively. Studies done by other authors also showed similar observations [Table/Fig-9].
Comparison of correlation analysis of IG% and IG# among various studies.
| Study | Correlation factor for IG % | Correlation factor for IG # |
|---|
| Stamminger G et al., [22] | 0.7017 | 0.8363 |
| Herklotz R and Huber AR [23] | - | 0.8509 |
| Weiland TH et al., [24] | 0.871 | 0.900 |
| Briggs C et al., [30] (x109/L) | - | 0.81 |
| Senthilnayagam B et al., [31] | - | 0.87 |
| Fernandes B et al., [32] | 0.80 | 0.82 |
| Present study | 0.898 | 0.908 |
IG: Immature granulocytes; %: Percentage counts; #: Absolute counts
Briggs C et al., [26] got the value of r2=0.69 for correlation of IG# between XE-2100 and manual method. In another study, Briggs C et al., [25] observed r2=0.69 for correlation of IG# between XN1000 and manual method similar to our study finding of r2=0.7268.
A strong correlation was observed between XN1000 IG count and manual IG count despite the low number of cells visualised on manual review and the subjective interpretation of the author. It can be contemplated that automated IG count will help in screening and monitoring of leukemoid reactions including severe infections, neoplasms of all types and myeloproliferative diseases. A reliable and a quantifiable IG count can help in early detection of underlying pathology and faster reporting without the need to wait for processing of blood smears and manual review [30].
Efficiency of morphological flags hold utmost importance, as it helps the reporting pathologist who performs a manual review. ISLH recommends threshold of 5% for false negatives. American College of Pathologists recommend upto 30% microscopic review rate [10]. One false negative result was observed in our study, demonstrating high quality equipment screening.
In automated analysers, cut-off values for determination of sensitivity and specificity of flags are so adjusted, that they offer more false positives but less false negatives. Consequences of errors due to excessive manual reviews are less dramatic than omission of some important information relevant for patients’ diagnosis [18].
The cut-off value for IG% for predicting flagging in present study was calculated using a ROC curve and the value was found to be 3.45% and 0.105x10³/μL for IG #. To the best of our knowledge, no other study devising IG flagging cut-off values in leukopenic samples is present, hence comparison is not possible. However, in a study done by Senthilnayagam B et al., [31] on inpatient population suspected to have infection clinically, optimal value yielded a sensitivity of 66.67% and specificity of 70.37% for IGC (>0.11) and for IG% (>1.1), 70.37% and 62.67% respectively.
Sensitivity and specificity of flagging are of paramount importance in the validation of analyser’s performance [22]. [Table/Fig-10] depicts comparison of diagnostic performance of IG flagging among various studies.
Comparison of diagnostic performance of IG flagging among various studies.
| Study | Sensitivity (%) | Specificity (%) | Effecieny (%) |
|---|
| Ruzicka K et al., [12] | 92 | 81 | 83 |
| Kim H et al., [16] | 92.3 | 18.8 | 60.6 |
| Stamminger G et al., [22] | 100 | 91 | 92 |
| Meintker L et al., [36] | 56 | 84 | - |
| Present study | 97.30 | 91.91 | 92.49 |
Our microscopic review rate was 17.63% which was within the recommended percentage. With high sensitivity and specificity achieved for IG flagging in our study, XN1000 seems more than suitable for screening of IGs in leukopenic samples.
Quantification of IGs by automation eliminates Q-flag for IG and decreases the need of manual smear review. It saves time and effort of the reporting pathologists and allows the dispatch of reports sooner. Small number of IGs, particularly in leukopenic samples are often missed in the conventional 100-cell differential, added to this lies the concern of wide inter-observer and inter-laboratory variation. Use of automated enumeration improves the sensitivity and accuracy of the result compared with manual counterpart. Also, user definable settings for differential review can be set up as per the required needs of the individual laboratory. It is a simple, fast and an inexpensive method for detection and early indication of inflammation and sepsis compared to some of the costlier specific biomarkers and facilitates timely intervention and treatment [28,29,32,33].
With continuing pressure on haematology laboratories and the need for faster turnaround time, the challenge is to have a reduction in the manual peripheral smear reviews without missing important diagnostic information [26]. Automated IG count availability brings haematology laboratories an additional step closer to the holy grail of automated cell analysis, i.e, a complete, automated, extended leukocyte differential count with an immediate benefit of decreased manual reviews. IG counts obtained by the analysers are more accurate and precise compared to their manual counterparts because it is well established that counts generated by analysers are more precise than manual counts [32].
Limitation
Limitations of present study was that we had very few studies based on XN1000 and leukopenic blood samples for comparison of our results.
Conclusion
Strong correlation was observed for proportional and absolute counts of neutrophil, lymphocyte, eosinophil, monocyte and IG. Moderate correlation was seen for basophil proportional and absolute counts. High sensitivity, specificity and efficiency for IG flag were observed.
Differential leukocyte analysis of leukopenic samples is cumbersome and very time consuming. Manual method provides an advantage of correctly identifying and classifying cells especially immature cells, thereby detecting haematological disorders. Automation on the other hand provides faster results which are more accurate and objective and very much needed in leukopenic samples. Combination of both the methods provides fast, accurate results leading to decrement in the manual differentials in haematology laboratories. With present and more studies validating the automated results, in near future automation can by and large replace manual way of reporting leukocyte differentials.
[1]. Greer JP, Arber DA, Glader BE, List AF, Means RT, Paraskevas F, Wintrobe’s Clinical Hematology 2009 12th EditionPhiladelphiaLippincott Williams & Wilkins [Google Scholar]
[2]. Kawauchi S, Takagi Y, Kono M, Wada A, Morikawa T, Comparison of the leukocyte differentiation scattergrams between the XN-series and the XE-series of hematologyanalyzersSysmex J Int 2014 24:01-08. [Google Scholar]
[3]. Walker HK, Hall WD, Hurst JW, Clinical methods: the history, physical, and laboratory examinations 1990 3rd EditionBostonButterworths [Google Scholar]
[4]. McKenzie SB, Williams JL, Clinical Laboratory Hematology 1974 2nd EditionNew JerseyPrentice Hall [Google Scholar]
[5]. Buttarello M, Plebani M, Automated Blood Cell CountsAm J Clin Pathol 2008 130:104-16.10.1309/EK3C7CTDKNVPXVTN18550479 [Google Scholar] [CrossRef] [PubMed]
[6]. Yu H, Ok CY, Hesse A, Nordell P, Sjostedt D, Evaluation of an automated digital imaging system, Nextslide digital review network, for examination of peripheral blood smearsArch Pathol Lab Med 2012 136:660-67.10.5858/arpa.2011-0285-OA22646275 [Google Scholar] [CrossRef] [PubMed]
[7]. Sireci A, Schlaberg R, Kratz A, A method for optimizing and validating institutionspecific flagging criteria for automated cell countersArch Pathol Lab Med 2010 134:1528-33. [Google Scholar]
[8]. National Committee for Clinical Laboratory Standards: Reference Leukocyte Differential Count (Proportional) and Evaluation of Instrumental Methods, Approved Standard NCCLS document H20-AVillanova, PA: National Committee for Clinical Laboratory Standards 1992 :60 [Google Scholar]
[9]. Barnes PW, McFadden SL, Machin SJ, Simson E, The international consensus group for hematology review: Suggested criteria for action following automated CBC and WBC differential analysisLab Hematol 2005 11:83-90.10.1532/LH96.0501916024331 [Google Scholar] [CrossRef] [PubMed]
[10]. Comar SR, Malvezzi M, Pasquini R, Are the review criteria for automated complete blood counts of the International Society of Laboratory Hematology suitable for all hematology laboratories?Rev Bras Hematol Hemoter 2014 36:219-25.10.1016/j.bjhh.2014.03.01125031063 [Google Scholar] [CrossRef] [PubMed]
[11]. Pratumvinit B, Wongkrajang P, Reesukumal K, Klinbua C, P Niamjoy, Validation and optimization of criteria for manual smear review following automated blood cell analysis in a large university hospitalArch Pathol Lab Med 2013 137:408-14.10.5858/arpa.2011-0535-OA23451752 [Google Scholar] [CrossRef] [PubMed]
[12]. Ruzicka K, M Veitl, R Thalhammer-Scherrer, Schwarzinger I, The new hematology analyzer Sysmex XE-2100: performance evaluation of a novel white blood cell differential technologyArch Pathol Lab Med 2001 125:391-96. [Google Scholar]
[13]. Kim AH, Lee W, Kim M, Kim Y, Han K, White blood cell differential counts in severely leukopenic samples: a comparative analysis of different solutions available in modern laboratory hematologyBlood Res 2014 49:120-26.10.5045/br.2014.49.2.12025025014 [Google Scholar] [CrossRef] [PubMed]
[14]. The use of absolute figures in hematology [Internet]. 2012 [cited 2015 June 15]. Available from: http://www.sysmex.ru/fileadmin/media/f100/SEED/Sysmex_SEED_The_use_of_absolute_figures_in_haematology.pdf [Google Scholar]
[15]. Münster M, The role of peripheral blood smear in the modern haematology laboratory 2013 [Internet]. [cited 2015 June 15]. Available from: http://www.sysmex.de/fileadmin/media/f100/SEED/Sysmex_SEED_The_role_of_peripheral_blood_smear_in_the_modern_haematology_laboratory.pdf [Google Scholar]
[16]. Kim H, Hur M, Choi SG, Moon HW, Yun YM, Hwang HS, Performance evaluation of Sysmex XN hematologyanalyzer in umbilical cord blood: a comparison study with XE-2100Clin Chem Lab Med 2014 52:1771-79.10.1515/cclm-2014-039224978899 [Google Scholar] [CrossRef] [PubMed]
[17]. JY Seo, ST Lee, Kim SH, Performance evaluation of the new hematology analyser Sysmex XN-seriesInt J Lab Hematol. 2015 37:155-64.10.1111/ijlh.1225424815300 [Google Scholar] [CrossRef] [PubMed]
[18]. Maciel TES, Comar SR, Beltrame MP, Performance evaluation of the Sysmex XE- 2100D automated hematologyanalyzerJ Bras Patol Med Lab 2014 50:26-35.10.1590/S1676-24442014000100004 [Google Scholar] [CrossRef]
[19]. Etzell JE, For WBC differentials, report in absolute numbers [Internet]. 2010 [cited 2015 Sep 24]. Available from: http://www.captodayonline.com/Archives/0310/0310d_for_wbc_differentials.html [Google Scholar]
[20]. Jo Y, Kim SH, Koh K, Park J, Shim YB, Lim J, Reliable, accurate determination of the leukocyte differential of leukopenic samples by using Hematoflow methodKorean J Lab Med 2011 31:131-37.10.3343/kjlm.2011.31.3.13121779183 [Google Scholar] [CrossRef] [PubMed]
[21]. Al-Gwaiz LA, Babay HH, The diagnostic value of absolute neutrophils count, band count and morphologic changes of neutrophils in predicting bacterial infectionsMed Princ Pract 2007 16:344-47.10.1159/00010480617709921 [Google Scholar] [CrossRef] [PubMed]
[22]. Stamminger G, Auch D, Diem H, Sinha P, Performance of the XE-2100 leucocyte differentialClin Lab Haem 2002 24:271-80.10.1046/j.1365-2257.2002.00458.x12358887 [Google Scholar] [CrossRef] [PubMed]
[23]. Herklotz R, Huber AR, Precision and accuracy of the leukocyte differential on the Sysmex XE-2100Sysmex J Int 2001 11:08-21. [Google Scholar]
[24]. Weiland TH, Kalkman H, Heihn H, Evaluation of the automated immature granulocyte count (IG) on Sysmex XE-2100 automated haematology analyser vs. Visual microscopy (NCCLS H20-A)Sysmex J Int 2002 12:63-70. [Google Scholar]
[25]. Briggs C, Harrison P, Staves D, Chavada J, Machin N, Performance evaluation of the Sysmex XE-2100™, automated haematology analyserSysmex J Int 1999 9:113-19. [Google Scholar]
[26]. Briggs C, Longair I, Kumar P, Singh D, Machin SJ, Performnce evaluation of the Sysmex haematology XN modular systemJ Clin Pathol 2012 65(1):1024-30.10.1136/jclinpath-2012-20093022851510 [Google Scholar] [CrossRef] [PubMed]
[27]. Arneth BM, Menschikowki M, Technology and new fluorescence flow cytometry parameters in haematologicalanalyzersJ Clin Lab Anal 2015 29:175-83.10.1002/jcla.2174724797912 [Google Scholar] [CrossRef] [PubMed]
[28]. Nierhaus A, Klatte S, Linssen J, Eismann NM, Wichmann D, Hedke J, Revisiting the white blood cell count: immature granulocytes count as a diagnostic marker to discriminate between SIRS and sepsis- a prospective, observational studyBMC Immunol 2013 14:01-08.10.1186/1471-2172-14-823398965 [Google Scholar] [CrossRef] [PubMed]
[29]. Bernstein LH, Rucinski J, Measurement of granulocyte maturation may improve the early diagnosis of the septic stateClin Chem Lab Med 2011 49:2089-95.10.1515/CCLM.2011.68821936608 [Google Scholar] [CrossRef] [PubMed]
[30]. Briggs C, Harrison P, Grant D, Staves J, Machin SJ, New quantitative parameters on a recently introduced automated blood cell counter- the XE 2100™Clin Lab Haem. 2000 22:345-50.10.1046/j.1365-2257.2000.00330.x11318800 [Google Scholar] [CrossRef] [PubMed]
[31]. Senthilnayagam B, Kumar T, Sukumaran J, Jeya N, Rao Rk, Automated measurement of immature granulocytes: Performance characteristics and utility in routine clinical practicePatholog Res Int 2012 2012:01-06.10.1155/2012/48367022448336 [Google Scholar] [CrossRef] [PubMed]
[32]. Fernandes B, Hamaguchi Y, Automated enumeration of immature granulocytesAm J Clinpathol 2007 128:454-63.10.1309/TVGKD5TVB7W9HHC717709320 [Google Scholar] [CrossRef] [PubMed]
[33]. Briggs C, Quality counts: new parameters in blood cell countingInt Jnl Lab Hem. 2009 31:277-97.10.1111/j.1751-553X.2009.01160.x19452619 [Google Scholar] [CrossRef] [PubMed]
[34]. Walters J, Garrity P, Performance evaluation of the Sysmex XE-2100 hematologyanalyzerLab Hematol 2000 6:83-92. [Google Scholar]
[35]. Langford K, Luchtman-Jones L, Miller R, Walck D, Performance evaluation of the Sysmex XT-2000i automated haematology analyzerLab Hematol 2003 9:29-37. [Google Scholar]
[36]. Meintker J, Ringwald S, Rauh M, Krause , Comparison of automated differential blood cell counts from Abott Sapphire, Siemens Advia 120, Beckman Coulter DxH 800, and Sysmex XE-2100 in normal and pathologic samplesAm J Clin Pathol 2013 139:641-50.10.1309/AJCP7D8ECZRXGWCG23596116 [Google Scholar] [CrossRef] [PubMed]