Introduction
Post natal growth covers the period from infancy through adolescence and is assumed that during this span almost 100% of adult dimensions are achieved [1]. However, the growth occurring during this period is not continuous and exponential. Different parts of the body grow at different time and different rates. The rate of growth tends to increase from cephalic to caudal end. The same dynamic trend is applicable in the craniofacial region as well. According to Scammon’s growth curve, growth and development of cranial structures follows the neural curve with the cranial vault achieving 95% of adult size by five years of age followed by which there is a deceleration in the growth rate. However, the facial bones continue to grow eventually for a longer period [2,3].
A child’s face is not merely a miniature of adult. Facial enlargement from child to adult can be described as a differential growth process comprising of components that grow at different rates and in different directions. This difference in the rate of growth brings about changes in the proportions appreciable in a child’s face when compared to that of an adult. Although, there exists a difference in the rate and direction of the growth, changes in one part of the craniofacial region can have an effect in the position of the other part. Hence, it can be described as an interdependent phenomenon [4].
As described by the concept of craniofacial growth explained by Enlow, transition from primary to mixed dentition describes a major milestone in the craniofacial growth and development. This is particularly true for the eruption of the first permanent molar as this tooth does not have a predecessor tooth. The occlusal equilibrium present during primary dentition gets disrupted during the eruption of first permanent molar, thereby bringing about changes to accommodate the same. Eruption of teeth particularly mandibular teeth follows the growth displacement of the mandible [5]. This brings changes in the facial proportions mainly the vertical facial proportions. Apart from this; literature does not explain any further, the effect of eruption of permanent first molars on the craniofacial skeletal structures. This data would increase our vast knowledge on craniofacial growth thereby, providing norms for diagnosing any deviations and planning early treatment which would bring about harmonious dental and skeletal relationship. Hence, the present study was conducted to determine the developmental changes in the lower facial dimensions upon the eruption of first permanent molar.
Materials and Methods
Study Design
The study was conducted in the Department of Pedodontics and Preventive Dentistry, Jagadguru Sri Shivarathreeshwara Dental College and Hospital, Jagadguru Sri Shivarathreeshwara Academy of Higher Education and Research, Karnataka, India. A longitudinal prospective study design was considered accurate, as this would eliminate the individual variations which would remain higher in cross sectional study designs. Ethnicity and linguistic characteristics have a significant effect of the facial patterns. Hence, to maintain uniformity among the subjects this longitudinal study was conducted on subjects belonging to lingayat community of Karnataka population.
Prior to the conduct of examination, ethical clearance was obtained from the Institutional Ethical Board. An initial clinical examination was done and children having complete primary dentition, balanced facial profile and without any parafunctional oral habits were included in the study. Subjects with medically compromising condition, grossly decayed primary teeth or requiring/undergoing preventive and corrective orthodontic treatment were excluded from the study. The parents were explained about the duration of the study and procedures to be performed during the study. The possible advantages and effects were also explained. Only the children whose parents had provided informed consent and children providing informed assent were included in the study. The duration of the study was 24 months after initial exposure. The initial radiographs were taken during November 2014 and repeated after November 2016, till January 2017.
Since, the outcome measure was quantitative, sample size was determined based on comparison of means. Means for estimation of sample size was determined from pilot study. The pilot study was a cross sectional study performed on 20 subjects (10 subjects from primary dentition and 10 subjects from early mixed dentition). The mean difference and standard deviation calculated in present study gave us 80% power of study, confidence interval 95% which gave us a sample of 24 subjects.
Since, the present study was a longitudinal study, 67 subjects were included in the study to compensate for the loss to follow-up. All the subjects belonged to Lingayat community of Mysore population, (38 males and 29 females) having mean age of 5.5 years (5.3 years -5.10 years) with complete primary dentition. Radiographs were repeated after two years that is after the eruption of first permanent molars. Two years duration provided the clinically observable differences to be recorded. After two years follow-up period 46 subjects (27 males and 19 females) were located and five were excluded from the study due to unacceptable profile (incompetent lips due to tongue thrusting habit) and unerupted first permanent molars and 16 subjects were lost to follow-up. Hence, lateral cephalometric radiographs were repeated only for 46 subjects and cephalometric analysis was performed and data was compiled only for these subjects.
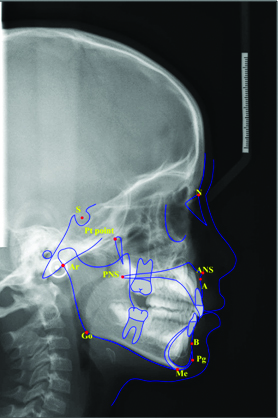
Lateral cephalometric radiographs of 67 subjects were recorded at the baseline that is during the primary dentition stage. The exposure parameters were 72 kVp, 12 mA and 8.2 second was the exposure time which was standardised at paediatric mode to reduce the amount of exposure. All the digital lateral cephalometric radiographs were taken with Planmeca Pro 2D with cephalostat. The obtained image was converted into JPEG format and imported into the Nemoceph Software (version 10.4.2) for cephalometric analysis. On each cephalometric radiograph 11 skeletal landmarks were identified [Table/Fig-1]. From the cephalometric landmarks and reference lines, four angular and seven linear measurements were analysed on the Nemoceph Software [Table/Fig-2,Table/Fig-3]. These linear and angular measurements were obtained from, Downs WB, Bjork A and Skieller V, Rakosi T [6-8]. In addition certain additional measurements described by Nanda RS and Ghosh J were included [9]. The definition of linear and angular measurements are shown in [Table/Fig-4].
Anatomic landmarks.
S:Sella; N-Nasion; Pt point: Pterygoid point; ANS: Anterior Nasal Spine; PNS: Posterior Nasal Spine; Ar: Articulare; A: Point A; B: Point B; Pg:Pogonion; Me: Menton; Go: Gonion
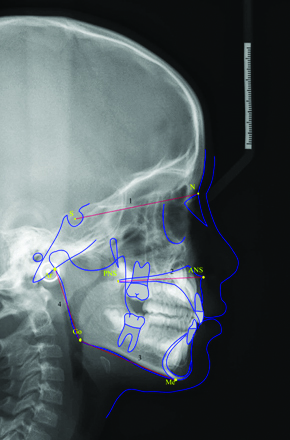
Angular measurements.
1) SN plane (S-N); 2) Palatal plane (ANS-PNS); 3) Mandibular plane (Go-Me); 4) Ramal plane (Ar-Go).
Maxillary Inclination is angle formed by SN plane to palatal plane; Mandibular inclination is angle formed by SN plane to mandibular plane; Jaw relationship is angle formed by palatal plane and mandibular plane; Gonial angle is angle formed by ramal plane and mandibular plane
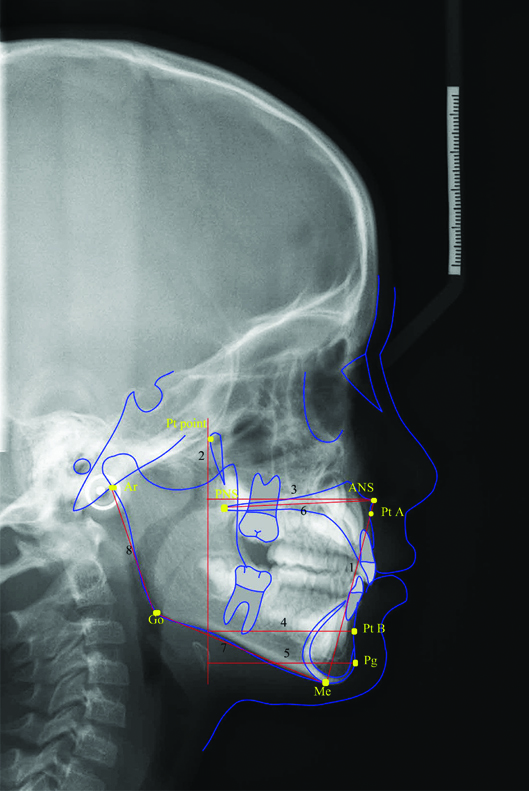
Linear measurements (point 2 is not a linear measurement. It is the Pt point vertical reference plane used for the performing the linear measurements).
1) Lower anterior facial height (LAFH); 2) Pterygoid vertical: vertical dropped from most posterior point on the outline of the pterygopalatine fossa; 3) Saggital growth at Point A; 4) Saggital growth at Point B; 5) Saggital growth at Pogonion; 6) Maxillary length; 7) Mandibular length; 8) Ramus height.
Definitions of the linear and angular measurements.
| Linear |
|---|
| S.No | Measurement | Landmarks used | Significance |
|---|
| 1 | Sagittal growth at Point A | Pt point-Pt A | Linear measurement from pterygoid point to point A. Signifies the sagittal growth at point A with respect to stable reference point. |
| 2. | Lower anterior facial height | ANS-Me | Linear measurement from Anterior Nasal Spine to Menton. Describes the skeletal lower facial height. |
| 3. | Sagittal growth at Point B | Pt point-Pt B | Linear measurement from pterygoid point to point B. Signifies the sagittal growth at point B with respect to stable reference point. |
| 4. | Sagittal growth at Pogonion | Pt point-Pg | Linear measurement from pterygoid point to Pogonion. Signifies the sagittal growth at Pogonion with respect to stable reference point. |
| 5. | Mandibular body length | Go-Me | Linear measurement from Gonion to Menton. Signifies length of mandibular base. |
| 6. | Maxillary length | ANS-PNS | Linear measurement from ANS to PNS. Signifies the length of the maxilla. |
| 7. | Ramus height | Ar-Go | Ramus height as measured on lateral cephalogram is the distance from the articulare to gonion. |
| Angular |
| 1 | Gonial angle | Ar-Go-Me | Expression for the form of the mandible, describes the relation between body and ramus. A large gonial angle indicates tendency to posterior rotation of the mandible, with condylar growth directed posteriorly. A small gonial angle indicates vertical growth of the condyles, giving a tendency to anterior rotation with growth of the mandible. |
| 2 | Maxillary Inclincation | Palatal plane-SN plane | Provides assessment of the inclination maxillary base with reference to the cranial base |
| 3. | Mandibular inclination | SN-Mandibular plane | This is the angle between the mandibular plane and SN plane. Excessively high or low mandibular plane angles suggest unfavourable growth patterns in individuals. |
| 4. | Jaw relationship | ANS-PNS to Mandibular plane (Go-Me) | Angle formed by the palatal plane and the mandibular plane. Describes the relationship of maxilla to mandible. |
Statistical Analysis
The data obtained after cephalometric analysis was compiled and subjected to statistical analysis. SPSS version 22.0 was used for the statistical analysis. Paired t-test performed, determined the difference among the primary and early mixed dentition among heightmales and females. Since, the observations were repeated on the same sample, the significance of difference of each measurement between two time points was determined using paired t-test. The statistical significance was tested at 5% level. Further, several tests were performed on the same individuals; hence, Benjamin and Hochberg (BH) multiple testing correction was used to reduce the False Positive Rate (FPR). In the present context, FPR was set to 0.05 implying that the chance of falsely detecting a hypothesis as significant was 5%. Those parameters with adjusted p-value ≤0.05 were treated as significantly differing at two time points.
Results
Comparison of lower craniofacial measurements during primary and mixed dentition among males and females are shown in [Table/Fig-5]. The results indicated that there was a significant increase in the lower facial height among both males and females with the mean lower facial height being more among males. Among both the sexes, there was highly statistically significant difference for sagittal growth at point A, point B, Pogonion maxillary and mandibular length. Among males, clinically observable difference was present in the ramus height, mandibular inclination and gonial angle; however the results were insignificant. These variables were significant only among females with adjusted p-value ≤0.05. Maxillary inclination had significantly increased only among males. Jaw relation had a clinically observable reduction; however the difference was statistically insignificant.
Comparison of lower craniofacial measurements during primary and early mixed dentition stages among males and females.
| Lower Craniofacial measurements | Sex | Primary Dentition stage Mean(SD) | Early Mixed Dentition stage Mean(SD) | Comparison between primary dentition and early mixed dentition stages |
|---|
| Mean Diff. | p-value | Adjusted p-value |
|---|
| Linear measurements (mm) |
| Lower anterior facial height | M | 50.11±4.25 | 52.35±3.01 | 2.24 | 0.033* | 0.059* |
| F | 49.02±3.59 | 51.32±3.11 | 2.3 | 0.013** | 0.028 * |
| Sagittal growth at point A | M | 43.49±2.31 | 45.43±3.57 | 1.94 | 0.021* | 0.040* |
| F | 43.09±1.94 | 45.05±2.42 | 1.96 | 0.005** | 0.014** |
| Sagittal growth at Point B | M | 39.56±2.87 | 44.44±3.87 | 4.88 | 0.001*** | 0.003** |
| F | 39.57±2.35 | 43.25±2.69 | 3.68 | 0.001*** | 0.004** |
| Sagittal growth at -Pg | M | 40.72±2.98 | 46.05±2.68 | 5.33 | 0.001 *** | 0.003** |
| F | 40.85±2.23 | 44.85±2.6 | 4 | 0.001*** | 0.004 ** |
| Maxillary length | M | 46.41±3.81 | 50.21s±1.95 | 3.8 | 0.001*** | 0.003** |
| F | 46.69±2.29 | 49.11±3.36 | 2.42 | 0.011** | 0.024* |
| Mandibular length | M | 62.49±3.66 | 67.07±1.66 | 4.58 | 0.001*** | 0.003** |
| F | 60.95±3.34 | 63.72±1.74 | 2.77 | 0.001*** | 0.004** |
| Ramus height | M | 38.74±5.68 | 40.25±2.24 | 1.51 | 0.190 | 0.261 |
| F | 35.79±3.02 | 38.14±1.42 | 2.35 | 0.004* | 0.014* |
| Angular measurements (in degrees) |
| Maxillary Inclination | M | 6.93±1.21 | 8.89±1.8 | 1.96 | 0.001*** | 0.003** |
| F | 6.16±2.93 | 6.84±2.85 | 0.68 | 0.299 | 0.433 |
| Mandibular inclination | M | 37.07±3.94 | 35.59±4.18 | -1.48 | 0.260 | 0.349 |
| F | 33.63±2.69 | 31.05±2.15 | -2.58 | 0.005** | 0.014** |
| Jaw relationship | M | 28.26±4.23 | 26.85±4.03 | -1.41 | 0.280 | 0.358 |
| F | 27.63±3.13 | 26.95±4.27 | -0.68 | 0.558 | 0.667 |
| Gonial angle | M | 128.96±4 | 126.26±4.6 | -2.7 | 0.060 | 0.097 |
| F | 128.89±4.31 | 125.84±5.28 | -3.05 | 0.021* | 0.039* |
Paired t-test to determined the difference between the stages; adjusted p-value obtained using Benjamin and Hochberg multiple testing correction
*-significant difference at p-value≤0.05; **-significant difference at p-value ≤0.01; ***-statistically significant at p value <0.001; significant difference at p-value≤0.00; M: Male; F: Female
Comparison of lower craniofacial measurements during primary dentition stage among males and females are shown in [Table/Fig-6]. Unpaired t-test was performed to determine the difference among males and females. The ramus height and mandibular inclination showed a significant difference among males and females during primary dentition with the dimensions being more among males.
Comparison of lower craniofacial measurements during primary dentition stage among males and females.
| Lower Craniofacial measurements | Sex | Primary Dentition stage Mean(SD) | Comparison between males and females |
|---|
| p-value | Adjusted p-value |
|---|
| Linear measurements (mm) |
| Lower anterior facial height) | M | 50.11±4.25 | 0.349 | 0.664 |
| F | 49.02±3.59 |
| Sagittal growth at Point A | M | 43.49±2.31 | 0.647 | 0.843 |
| F | 43.09±1.94 |
| Sagittal growth at Point B | M | 39.56±2.87 | 0.991 | 0.991 |
| F | 39.57±2.35 |
| Sagittal growth at-Pg | M | 40.72±2.98 | 0.862 | 0.895 |
| F | 40.85±2.23 |
| Maxillary length | M | 46.41±3.81 | 0.756 | 0.843 |
| F | 46.69±2.29 |
| Mandibular length | M | 62.49±3.66 | 0.146 | 0.365 |
| F | 60.95±3.34 |
| Ramus height | M | 38.74±5.68 | 0.028* | 0.171 |
| F | 35.79±3.02 |
| Angular measurements (in degrees) |
| Maxillary inclination | M | 6.93±1.21 | 0.292 | 0.634 |
| F | 6.16±2.93 |
| Mandibular inclination | M | 37.07±3.94 | 0.001*** | 0.028* |
| F | 33.63±2.69 |
| Jaw relationship | M | 28.26±4.23 | 0.841 | 0.841 |
| F | 27.63±3.13 |
| Gonial angle | M | 128.96±4 | 0.957 | 0.957 |
| F | 128.89±4.31 |
Unpaired t-test to obtain the difference between males and females; adjusted p-value obtained using Benjamin and Hochberg multiple testing correction
*-significant difference at p-value ≤0.05; **-significant difference at p-value ≤0.01; ***-statistically significant at p value <0.001; significant difference at p-value ≤ 0.001; M: Male; F: Female
Comparison of lower craniofacial measurements during early mixed dentition stage among Males and Females are shown in [Table/Fig-7]. During this transition period, along with mandibular inclination, mandibular length and ramus height were also statistically higher among males when compared to the females.
Comparison of lower craniofacial measurements during early mixed dentition stage among males and females.
| Lower Craniofacial measurements | Sex | Early Mixed Dentition stage Mean(SD) | Comparison between males and females |
|---|
| p-value | Adjusted p-value |
|---|
| Linear measurements (mm) |
| Lower anterior facial height | M | 52.35±3.01 | 0.271 | 0.471 |
| F | 51.32±3.11 |
| Sagittal growth at Point A | M | 45.43±3.57 | 0.672 | 0.803 |
| F | 45.05±2.42 |
| Sagittal growth at Point B | M | 44.44±3.87 | 0.471 | 0.471 |
| F | 43.25±2.69 |
| Sagittal growth at-Pg | M | 46.05±2.68 | 0.374 | 0.374 |
| F | 44.85±2.6 |
| Maxillary length | M | 50.21 s±1.95 | 0.209 | 0.46 |
| F | 49.11±3.36 |
| Mandibular length | M | 67.07±1.66 | 0.009** | 0.009** |
| F | 63.72±1.74 |
| Ramus height | M | 40.25±2.24 | 0.001*** | 0.009** |
| F | 38.14±1.42 |
| Angular measurements (in degrees) |
| Maxillary Inclination | M | 8.89±1.8 | 0.01** | 0.061 |
| F | 6.84±2.85 |
| Mandibular inclination | M | 35.59±4.18 | 0.009** | 0.009** |
| F | 31.05±2.15 |
| Jaw relationship | M | 26.85±4.03 | 0.939 | 0.956 |
| F | 26.95±4.27 |
| Gonial angle | M | 126.26±4.6 | 0.783 | 0.897 |
| F | 125.84±5.28 |
unpaired t-test to determined the difference between the stages; adjusted p-value obtained using Benjamin and Hochberg multiple testing correction
*-significant difference at p-value ≤0.05; **-significant difference at p-value ≤0.01; ***-statistically significant at p value <0.001; significant difference at p-value ≤ 0.001; M: Male; F: Female
Discussion
Eruption of teeth is a process which requires axial movement of the teeth from its developmental position to the final functional occlusion. Eruption of first permanent molar is an important phase during the transitional period not only from development of occlusion but also from facial growth point of view as it corresponds with the same [5]. The American Association of Orthodontists recommend for orthodontic check up at seven years of age for early intervention and treatment planning [10]. Therefore, the longitudinal study was conducted to determine the effect of eruption of first permanent molar on the lower craniofacial parameters. The lower craniofacial parameters were considered as any preventive or corrective orthodontic treatment manoeuvre when performed significantly affects these dimensions. Hence, there was need to thoroughly understand the effect of eruption of permanent teeth on dento-skeletal parameters particularly the lower facial parameters.
There was a significant increase in the lower anterior facial height (mm) from 50.11±4.25 to 52.35±3.01 in males and 49.02±3.59 to 51.32±3.11 in females during the transition phase by 2.24 mm in males and 2.3 mm in females. Although, the amount of increase remains almost same among both the sexes, the males exhibited higher lower facial height than females. However the difference was statistically insignificant. Later during the developmental stages, the mandibular plane angle and facial height may in turn influence the position of the teeth in the alveolar segment thereby, causing changes in the dental height in both anterior and posterior regions which is called as the dentoalveolar compensatory mechanism [11].
Sagittal growth at Point A, Point B and Pogonion with respect to the pterygoid vertical was increased among both among males and females. Similar results were found by Nanda RS and Ghosh J [9]. There was also an increase in the maxillary inclination from 6.93±1.21 to 8.89±1.8 among males and 6.16±2.93 to 6.84±2.85 among females. Similar increase in maxillary inclination was reported by Riolo ML et al., in the Michigan Growth study [12]. They reported a mean increase from 5.2° to 6.4°. Increase in the sagittal growth at point A along with increase in maxillary inclination indicates that maxilla tends to move downward and forward during this growth phase. Although, Michigan growth study indicated increase in the maxillary inclination, however eruption of molars whether contributing towards this increase has not been explained. Also, cases of skeletal open bite having dental compensation in the frontal region limits the diagnosis of negative overbite. These cases can be diagnosed correctly based on correlation between molar height and maxillary inclination [13].
Sagittal growth at pogonion during the early mixed dentition stage was lower among females when compared to males. This indicates that the chin prominence remains less among females when compared to males. However, secondary translation of chin in downward and forward direction is caused by the actual growth of mandibular condyle and not due to the growth of chin itself [14].
There was a statistically significant increase in the maxillary length among males and females which was to accommodate the erupting first permanent molar. This also contribute for forward movement of the maxilla.
Mandibular length from Go-Me increased in both males and females. However, the mean remains higher among males (67.07 mm) compared to females (63.72 mm). Appositional bone growth along the posterior border of the ramus which occurs to compensate for the resorption on the anterior border of the ramus mainly contributes towards the increase in the mandibular length. The resorption along the anterior border of the ramus occurs to create space for the erupting first permanent molar [15]. Thereby, the permanent first molar contributes towards the changes in the mandibular length among both males and females. Change in the mandibular length is associated with the changes in the lower anterior facial height. Excessive mandibular length is diagnostic of short anterior facial height [16].
Hence, this data would help in assessment of ideal mandibular length during this transitional period thereby, influencing the vertical facial dimensions and treatment planning.
There was a decrease in the gonial angle from 128.96°±4 to 126.26°±4.6 in males and from 128.89°±4.31 to 125.84°±5.28 in females. However, the change was significant only among females with p-value ≤0.05. The adjusted p-value also indicated a significant difference among females. Similar results were obtained by Ochoa BK and Nanda RS [17]. As suggested by Bjork A in 1963, the gonial angle continues to decrease with age however the peak reduction occurs during six years of age which corresponds with the eruption of first permanent molars [18]. Remodelling of the basal bone causes the changes in the gonial angle which continues throughout the life. These changes are appreciated between the gender, age and with changes in the dentition status [19]. This parameter however, basically represents the mandibular rotations [20]. This study however did not report any sexual dimorphism in the gonial angle.
Ramus height increased by 1.51 mm and 2.35 mm in males and females respectively. Along with the appositional growth at the condyle, increase in the posterior intermaxillary space caused by eruption of the permanent molars creates a tendency towards an increase in the ramus height. These findings were consistent with Yassir A, Ahila SC et al., which reported positive correlation with ramus height and posterior mandibular and maxillary dento alveolar height [21,22]. The increase in the ramus height observed in the present study is due to the intermaxillary space during the eruption of first permanent molars. Although, the ramus height was higher in males compared to the females, the amount of increase in the ramus height was observed more among females.
Jaw relationship and mandibular inclination decreased in both males and females during transition from primary to early mixed dentition. This explains the mandibular rotations causing downward and forward positioning of the mandible. The reduction of mandibular inclination is an expression of apparent rotation of mandible. This is considered as apparent rotation as bone remodeling along the lower border of mandible masks the actual reduction in mandibular inclination. However, decrease in the gonial angle and horizontal displacements of chin seen in the present study are the expression of true mandibular rotation [16]. Similar results were found by Odegaard J, Lavergne J and Gasson N, [23-25].
These changes occurring during transition from primary to early mixed dentition are attributed to the eruption of permanent molars. It is during this transition, the first sign of mandibular rotations are appreciated. Hence, this period is considered to be potentially sensitive period with respect to mandibular rotation. The present study reported 1.40 of apparent rotation of mandible in two years of observation period. However, Miller S and Kerr WJ and Wang MK et al., reported 1.30/year of rotation because they reported true rotation, and the present study reports apparent rotation of mandible [26,27].
Limitation And Future Recommendation
The time duration included in the study was short, was aimed to consider the changes occurring in craniofacial complex during the period of transition from primary to early mixed dentition. Further studies can be conducted including all the stages of transition of dentition which would provide a comprehensive knowledge of changes occurring in the craniofacial complex during the transitional phase. This knowledge would be required to identify certain traits and anomalies of the primary and mixed dentition which would be reflected in the permanent dentition.
Conclusion
Males had higher means compared to females with mandibular length, ramus height, maxillary and mandibular inclination in particular. There is an increase in the maxillary and mandibular length to accommodate the erupting permanent molars. Increase in the intermaxillary space following eruption of first permanent molars contributes towards increase in the ramus height thereby, causing an increase in lower anterior facial height.
Corresponding to the increase in the ramus height, there was a decrease in the mandibular inclination and jaw relationship. The initial signs of mandibular displacement and rotations and decrease in mandibular inclination can now be corresponded to the eruption of first permanent molars which needs to be considered while planning treatment during the transitional phase.
Funding: Source of funding agency for conducting the research was Vision Group of Science and Technology (VGST) SMYSR Scheme, GRD No. 418, 2014-15.
Paired t-test to determined the difference between the stages; adjusted p-value obtained using Benjamin and Hochberg multiple testing correction
*-significant difference at p-value≤0.05;
**-significant difference at p-value ≤0.01;
***-statistically significant at p value <0.001; significant difference at p-value≤0.00; M: Male; F: Female
Unpaired t-test to obtain the difference between males and females; adjusted p-value obtained using Benjamin and Hochberg multiple testing correction
*-significant difference at p-value ≤0.05;
**-significant difference at p-value ≤0.01;
***-statistically significant at p value <0.001; significant difference at p-value ≤ 0.001; M: Male; F: Female
unpaired t-test to determined the difference between the stages; adjusted p-value obtained using Benjamin and Hochberg multiple testing correction
*-significant difference at p-value ≤0.05;
**-significant difference at p-value ≤0.01;
***-statistically significant at p value <0.001; significant difference at p-value ≤ 0.001; M: Male; F: Female
[1]. Krogman WM, Textbook of Child growth, Ann Arbor, MichThe University of Michigan 1972 [Google Scholar]
[2]. SarnatS BG, Craniofacial change and non change after experimental surgery in [2]young and adult animalsAngle Orthod 1988 58(4):321-42. [Google Scholar]
[3]. Scott JH, The Nasal SeptumBr Dent J 1953 95:37-43. [Google Scholar]
[4]. Knott VB, Changes in the cranial base measurement of human males and females from 6years to early adulthoodGrowth 1971 35(2):145-58. [Google Scholar]
[5]. Palma C, Coelho A, González Y, Cahuana A, Failure of eruption of first and second permanent molarsJ Clin Paediatr Dent 2003 27(3):239-46.10.17796/jcpd.27.3.dm4v13441p16192812739684 [Google Scholar] [CrossRef] [PubMed]
[6]. Downs WB, Analysis of dentofacial profileAngle orthod 1956 26(4):191 [Google Scholar]
[7]. Bjork A, Skieller V, Facial development and tooth eruption: an implant study at the age of pubertyAm J Orthod 1972 62(4):339-83.10.1016/S0002-9416(72)90277-1 [Google Scholar] [CrossRef]
[8]. Rakosi T, An atlas and manual of cephalometric radiography 1982 1st EditionWolfe Medical Publication Ltd [Google Scholar]
[9]. Nanda RS, Ghosh J, Longitudinal growth changes in the sagittal relationship of maxilla and mandibleAm J Orthod Dentofac Orthoped 1995 107(1):79-90.10.1016/S0889-5406(95)70159-1 [Google Scholar] [CrossRef]
[10]. American association of Orthodontists recommendation for orthodontic check up http://www.olmortho.com/pdf/about-braces/PTWF_7yr_olds-MLMS-l.pdf [Google Scholar]
[11]. Martina R, Cioffi I, Tagliaferri R, Michelotti A, Paduano S, Farella M, Relationship [11]between molar dentoalveolar and craniofacial heights in childrenProg Orthod 2009 10(2):64-69. [Google Scholar]
[12]. Riolo ML, Moyer RE, Mc Namara JA, Hunter SW, An atlas of craniofacial growth: Cephalometric standards from the University School Growth Study, University of MichiganMonograph No. 2, Craniofacial Growth Series 1974 :33 [Google Scholar]
[13]. Kucera J, Marek I, Tycova H, Baccetti H, Molar height and dentoalveolar compensation in adult subjects with skeletal open biteThe Angle orthodontist 2011 81(4):564-69.10.2319/081910-488.121306229 [Google Scholar] [CrossRef] [PubMed]
[14]. Subramaniam P, Naidu P, Mandibular dimensional changes and skeletal maturityContemp Clin Dent 2010 1(4):218-22. [Google Scholar]
[15]. Falkner F, Tanner JN, Post natal growth neurobiologySpringer Science & Business Media 2013 11(1):253-55. [Google Scholar]
[16]. Enoki C, Telles CD, Matsumoto MA, Dental-skeletal dimensions in growing individuals with variations in the lower facial heightBraz Dent J 2004 5(1):68-74.10.1590/S0103-6440200400010001315322649 [Google Scholar] [CrossRef] [PubMed]
[17]. Ochoa BK, Nanda RS, Comparison of maxillary and mandibular growthAm J Orthod Dentofac Orthop 2004 125(1):148-59.10.1016/j.ajodo.2003.03.00814765052 [Google Scholar] [CrossRef] [PubMed]
[18]. Bjork A, variation in the growth pattern of the human mandible: longitudinal [18]radiographic study by the implant methodJ Dent Res 1963 42(1):400-11.10.1177/0022034563042001470113971295 [Google Scholar] [CrossRef] [PubMed]
[19]. Ashkenazi M, Taubman L, Gavish A, Age associated changes of the mandibular foramen position in anteroposterior dimension and of the mandibular angle in dry human mandiblesAnat Rec 2011 294(8):1319-25.10.1002/ar.2142921714109 [Google Scholar] [CrossRef] [PubMed]
[20]. Leversha J, McKeough G, Myrteza A, Skjellrup-Wakefiled H, Welsh J, Sholapurkar A, Age and gender correlation of gonial angle, ramus height and bigonial width in dentate subjects in a dental school in Far North QueenslandJ Clin Exp Dent 2016 8(1):e49-e54.10.4317/jced.5268326855706 [Google Scholar] [CrossRef] [PubMed]
[21]. Yassir A, Ramus height and its relationship with skeletal and dental measurementsJ Oral Res 2013 1(1):2-5.10.12816/0012186 [Google Scholar] [CrossRef]
[22]. Ahila SC, Sasikala C, Kumar BM, Tah R, Abinaya K, Evaluation of the correlation of ramus height, gonial angle, and dental height with different facial forms in individuals with deep bite disordersAnn Med Health Sci Res. 2016 16(4):232-38.10.4103/amhsr.amhsr_335_1528480098 [Google Scholar] [CrossRef] [PubMed]
[23]. Odegaard J, Growth of mandible studied with the aid of metal implantAm J Orthod 1970 57(2):145-57.10.1016/0002-9416(70)90261-7 [Google Scholar] [CrossRef]
[24]. Lavergne J, Gasson N, Operational definitions of mandibular morphogenetic and positional rotationsScan J Dent Res 1977 85(3):185-92.10.1111/j.1600-0722.1977.tb00552.x265610 [Google Scholar] [CrossRef] [PubMed]
[25]. Lavergne J, Gasson N, Direction and intensity of mandibular rotation in the sagittal adjustment during growth of the jawsScan J Dent Res 1977 85(3):193-96.10.1111/j.1600-0722.1977.tb00553.x265611 [Google Scholar] [CrossRef] [PubMed]
[26]. Miller S, Kerr WJ, A new look at mandibular growth-a preliminary reportEur J Orthod 1992 14(2):95-98.10.1093/ejo/14.2.951582463 [Google Scholar] [CrossRef] [PubMed]
[27]. Wang MK, Buschang PH, Behrents R, Mandibular rotations and remodelling changes during early childhoodAngle Orthodontist 2009 79(2):271-75.10.2319/022808-118.119216596 [Google Scholar] [CrossRef] [PubMed]