Introduction
World Health Organisation and International Obesity Task Force have defined Obesity in terms of BMI, which is an indirect measurement of obesity [1]. However, it does not locate the site of fat nor does it differentiate muscle and fat mass.
Obesity can be assessed by portable or field methods such as SFT measurements, waist circumference, Waist Hip Ratio (WHR), BIA; while methods like Dual Energy X-ray absorptiometry (DEXA), air displacement plethysmography and Under Water Weighing are restricted to laboratory settings. All of these methods have their individual advantages and disadvantages [2].
At present the most commonly used field methods are skinfold thickness measurements and BIA. These are inexpensive and relatively quick to perform; though, not direct measures of BF%, are useful for screening the population at risk of co-morbidities of obesity. Skinfold and BIA data require equations to calculate BF% from thickness and bioelectrical impedance measurements respectively. Several equations such as Brook’s, Johnston’s, Slaughter’s and Deurenberg’s have been derived for the prediction of BF% or body density from SFT measurements [2-6]. But these equations seem to be population specific and the validity in any other population would be questionable. On individual basis, the accuracy was doubtful, thus they were not suitable for longitudinal comparisons [7,8].
In BIA method, the body is considered as a cylinder, and impedance to a small electric current is measured by means of electrodes, applied on the skin at the wrist and ankle [8].
South asians have high risk of metabolic disorders at a lower threshold of BF% [9]. It has been recommended that the risk assessment studies should use population-specific skinfold and BIA equations [10]. Recently, equations have been developed in Indian adults using primary reference methods [11]. We are currently aware of two skinfold equations developed in south asian children, both using a two-compartment (2C) model and none for converting BIA measurements to BF% [12]. The objective of the current study was to derive the population and gender specific prediction equation from the raw skinfold data, and compare it with BF% derived from published skinfold equation by Shaikh’s and obtained by BIA, separately for boys and girls.
Materials and Methods
A randomised cross sectional school based study was carried out from December 14 to January 16 in Nagpur, Gondia and Wardha districts of Maharashtra, which comes under central part of India.
A total of 15 schools were randomly selected, two from urban, three from urban slum and 10 from rural areas of central India. The total sample of 2304 students, both boys and girls from the age group of 8-16 years, were recruited. After discussing the aim of the study and explaining the method of data collection, permission was obtained from the school Principals. Parents’ consent was obtained before data collection. During school visits, a team of three resident doctors, two female and one male, a technician and an attendant was accompanying the principle investigator. The inclusion criteria were age between 8-16 years, apparently healthy on history and clinical examination. Those who had fever, acute respiratory infection, with history of diabetes, tuberculosis or any operative procedure or any skeletal deformity, were excluded from the study. Approval of the Institutional Ethics committee of Indira Gandhi Government Medical College, Nagpur, India was obtained before data collection.
Materials used were digital weighing machine, stature meter, non-stretchable measuring tape, metallic scale, Harpenden Skinfold Calliper and Quadscan 4000 Body composition analyser.
Sample Size Calculation
Based on the previous studies on Indian children, the minimum sample size calculated for 80% power was 314 for boys and 748 for girls [12-14].
Anthropometry
Height of children was measured in standing position by stature meter. The value to the nearest centimetre was taken following the standard protocol. Weight was measured by Digital weighing machine in lightest possible uniform garments, without footwear to the precision of 0.100 kg. Non-stretchable measuring tape was used to measure waist circumference at the level of midpoint, between lower border of ribcage and the iliac crest, and the value to the nearest centimetre was taken. Hip circumference was measured by the same tape, at maximum protrusion of the hip at the level of greater trochanter, with the student in standing position and heels together on the floor. The tape was applied lightly on the minimal uniform garment so that the tape remains tight but not too tight. Mid upper arm circumference was measured to the nearest 0.1 cm at halfway point between the Acromion and Olecrenon processes.
Skin Fold Thickness
Triceps and subscalpular skinfolds were measured by Herpenden calliper CE 0120 (Baty International instruments, England) to the nearest 0.2 mm. The skinfold was grasped between index finger and thumb pads, and calliper was allowed to hold the skinfold 1 cm below, with dial up and the instrument perpendicular to the skin surface. Two such readings were taken at each site and the average was considered as final. For mid upper arm circumference and Skinfold thickness measurements, right hand was preferred.
Body Fat Percentage Measurement
Bioelectrical impedance analysis: Whole body impedance at 50 kHz was measured using a Quadscan 4000 (Bodystat, Isle of Mann, British Isles). Before starting the measurements, all metal accessories were asked to be removed. Children were asked to lie in supine position for five minutes before application of electrodes. On right hand, one electrode was attached at the level of ulnar head at the wrist, and another just behind the knuckles. On right foot, one electrode was attached in between medial and lateral malleoli and another just behind the toes. At impedance 50 kHz, measurements were recorded for BF%.
Body fat percentage estimated from prediction equation: Shaikh’s equation was used for calculating BF% in the present study [12]. The equations proposed by them were as follows:
BF% (boys)=5.304+0.269*T+0.50*SS+0.685*M−0.063*A
BF% (girls)=7.017−0.053*T+0.201*SS+0.765*M+0.052*A
Where, T is tricep skinfold thickness, SS is subscapular skinfold thickness, M is mid upper arm circumference and A is age in months.
Body fat percentage estimated from present data: The prediction equation was calculated from the data obtained. Multiple Linear Regression analysis by STATA 13 was used to obtain the regression considering BF% as dependent variable and age (months), mid arm circumference, triceps, and sub-scapular skinfold thickness as independent variables. The correlations coefficients were statistically significant for all four variables (p<0.001). We used the same parameters for deriving the prediction equation as in Shaikh equation, for the purpose of better comparison.
Regression equations were as follows: BF% (boys) =17.09267+(-0.10016)*A+0.535823*M+0.443805*T+0.468107*SS. BF% (girls)=17.96293+(-0.07976)*A+0.385465*M+0.497878*T+0.58131*SS.
Data Analysis
Thus, we got three values of predicted BF% for total 1299 boys and 1005 girls in the age group of 8-16 years. Bland-Altman analysis was used to compare the BF percentage obtained by three methods-BIA, sheikh’s equation and present equation. The whole body BIA method was considered as reference method against which Shaikh equation and present equation was tested. The difference between two test methods was plotted against the mean BF% obtained by the two methods. The ideal situation with zero average of difference indicated both the methods give same observations. The mean difference calculated indicated positive or negative bias. A range of agreement was based on ±2SD, an interval in which 95% of the difference between measurements obtained by the two methods were expected to lie [15].
Statistical Analysis
Multiple linear regression was done to draw prediction equations separately for boys and girls using age, mid arm circumference, tricep skinfold thickness and subscapular skinfold thickness. Bland Altman analysis was used to compare BF% obtained by Shaikh’s equation, present prediction equation and by BIA. Intraclass correlation coefficient, Cronbach’s alpha was calculated to observe the degree of agreement between two methods BIA and Shaikh’s, BIA and present, Shaikh’s and present, using SPSS 20.0.
Results
The descriptive statistics as mean value of age in years, BMI, waist circumference, MAC, SFT at triceps and subscapular regions separately for boys and girls are shown in [Table/Fig-1]. Mean BF% with SD obtained by all the three methods is also presented. The mean of paired values of BF% between BIA and Shaikh’s, BIA and present and Shaikh’s and present are shown in [Table/Fig-2]. The difference between two independent methods for measuring BF% was compared with average value of these two measurements separately for boys and girls. These values were compared by Bland-Altman analysis. Limits of agreement were obtained as 95% confidence interval of the mean difference [Table/Fig-2].
| Parameters | Boys (n=1299) | Girls (n=1005) |
|---|
| Min | Max | Mean | SD | Min | Max | Mean | SD |
|---|
| Age (year) | 8 | 16 | 11.95 | 2.38 | 8 | 16 | 11.83 | 2.46 |
| BMI | 9.75 | 43.71 | 16.65 | 4.35 | 9.3 | 33.20 | 16.64 | 3.95 |
| WC (cm) | 23 | 125 | 62.88 | 12.13 | 42 | 108 | 61.93 | 11.10 |
| MAC (cm) | 11.5 | 38 | 19.68 | 4.12 | 12 | 38 | 19.89 | 3.87 |
| SFT-Triceps (mm) | 3 | 66 | 8.67 | 5.0 | 3.2 | 92 | 10.57 | 6.21 |
| Subscapular (mm) | 2.4 | 40 | 8.32 | 5.78 | 3.3 | 42 | 10.0 | 6.4 |
| BF% | | | | | | | | |
| BIA | 1.00 | 53.00 | 20.59 | 8.84 | 5.50 | 52.00 | 25.98 | 8.58 |
| Shaikh’s | 6.22 | 43.57 | 16.00 | 6.23 | 17.57 | 51.23 | 29.06 | 6.20 |
| Present | 9.40 | 47.98 | 20.58 | 6.47 | 18.23 | 72.53 | 39.21 | 12.69 |
| Avg of BIA and Shaikh | 3.75 | 42. | 18.30 | 6.99 | 12.22 | 46.35 | 27.52 | 6.42 |
| Avg of BIA and present | 5.70 | 45.79 | 20.59 | 6.76 | 12.22 | 46.35 | 27.52 | 6.42 |
| Avg of Shaikh’s and present | 7.81 | 43.50 | 18.29 | 5.75 | 22.77 | 55.21 | 34.13 | 7.48 |
BM: Body mass index; WC: Waist circumference; SFT: Skinfold thickness; MAC: Mid arm circumference; Avg: Average
Mean difference and limits of agreement for comparison of three predictive methods of measurement of body fat percentage.
| BF% | Mean diff | SD | Upper limit | Lower limit | Cronbachs alpha |
|---|
| Boys |
| BIA-Shaikh’s | 4.59 | 6.17 | 16.69 | -7.49 | 0.805 |
| BIA-Present | 0.019 | 7.53 | 14.79 | -14.75 | 0.689 |
| Shaikh’s-Present | - 4.58 | 5.37 | 5.95 | -15.11 | 0.782 |
| Girls |
| BIA-Shaikh’s | -3.09 | 7.712 | 12.02 | -18.21 | 0.639 |
| BIA-Present | -13.23 | 16.38 | 18.87 | -45.35 | -0.334 |
| Shaikh’s-Present | -10.14 | 13.23 | 15.80 | -36.08 | 0.218 |
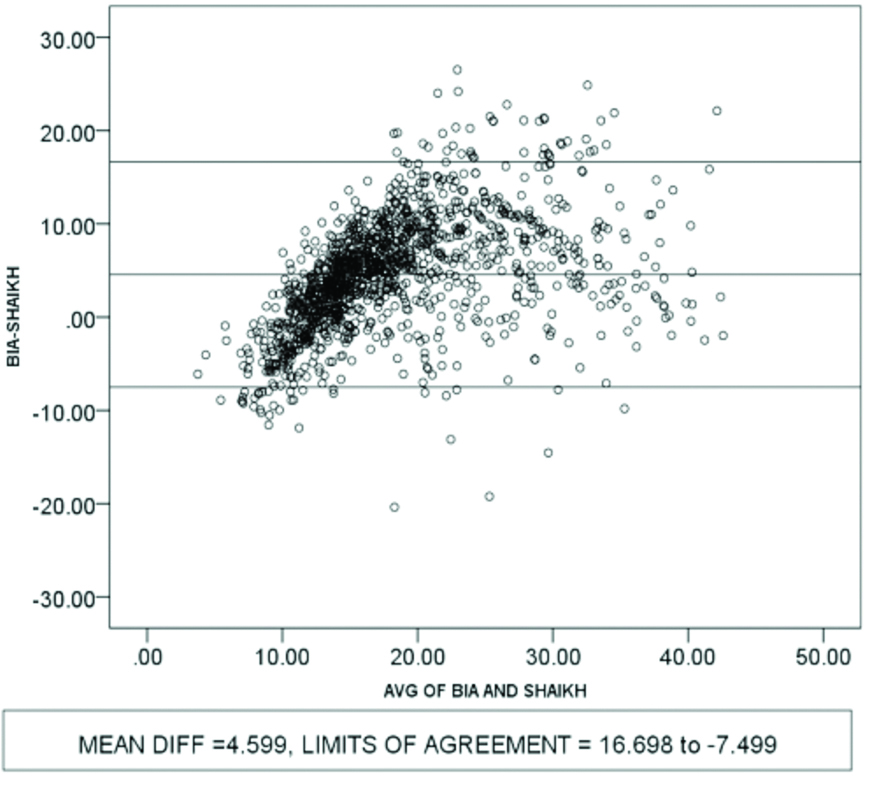
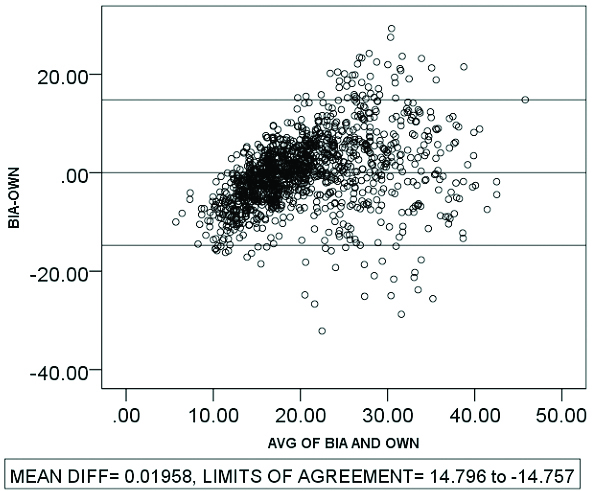
On comparison between BF% for boys, the BIA method versus Shaikh’s equation, mean difference was found 4.59 with 95% CI (16.69, -7.49) interpreted as upper and lower limits of agreement (LOA). BIA method and present equation show mean difference of 0.019 with 14.79 and -14.75 as limits of agreement. Similarly, Shaikh equation and present equation shows mean difference of -4.58 and 5.95,-15.11 as limits of agreement. [Table/Fig-3a,3b,3c]
Bland-Altman plots showing comparison of body fat percentage measurement methods in boys; between BIA and Shaikh’s.
Bland-Altman plots showing comparison of body fat percentage measurement methods in boys, between BIA and present.
Bland-Altman plots showing comparison of body fat percentage measurement methods in boys, between Shaikh’s and present.
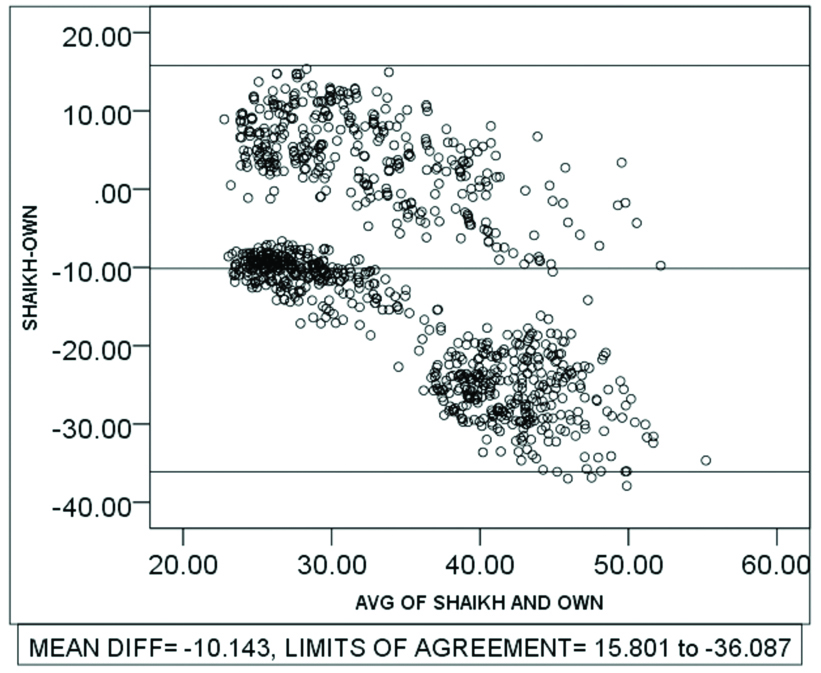
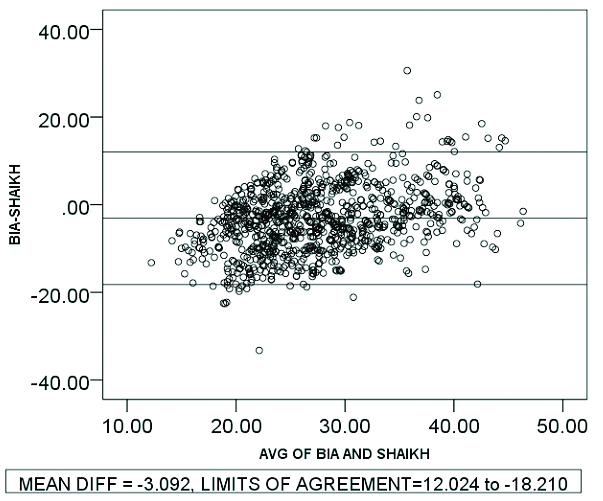
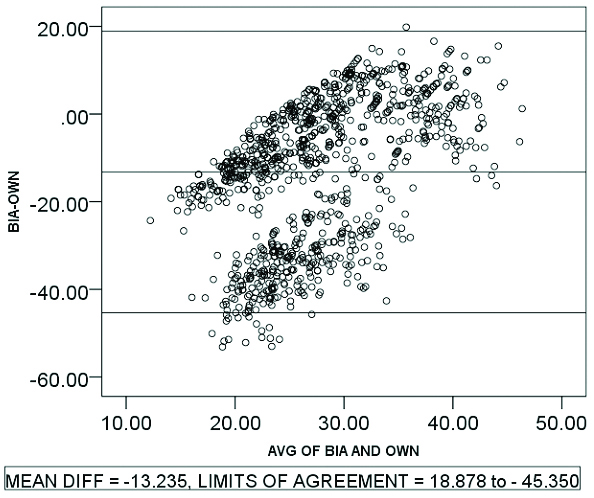
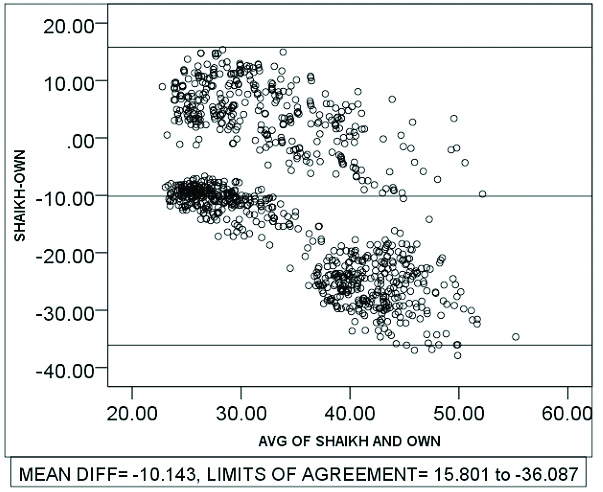
For girls, mean difference and LOA of BF% values for BIA versus Shaikh’s, BIA versus present and Shaikh’s versus present are -3.09 (12.02, -18.21), -13.23 (18.87,-45.35) and -10.14 (15.80,-36.08) respectively. [Table/Fig-4a,4b,4c].
Bland-Altman plot showing comparison of body fat percentage measurement methods in girls between BIA and Shaikh’s equation.
Bland-Altman plot showing comparison of body fat measurement methods in girls between BIA and present equation.
Bland-altman plot showing comparison of body fat percentage measurement methods in girls between Shaikh and present equation.
Discussion
The objective of the present study was to compare the BF% obtained by BIA, Shaikh’s prediction equation and present prediction equation derived from the raw skinfold data, in the school children of age 8-16 years in central India. Although, there were more equations for comparison like Dezenberg equation, Slaughter, Wickramsinghe Equation, Kushner, Deurenberg, Ellis, Goran and Schaefer equations, we chose to compare the equation by Shaikh et al because they used Bio-impedance method as a reference method in the south asian population and validated with the D2O dilution method, which is a gold standard method for body composition [5]. Their study subjects were Indian children of both genders and they recommended it for prediction of BF% in south asian children [12]. Dezenberg’s, Slaughter’s and Kushner’s equation were also derived from children; however, the population was of Caucasian and African American origin [16,17]. Wickramsinghe equation was derived using D2O as a reference method [18]. Other equations stated above were derived from the adult population. Bray GA et al., evaluated 16 different methods for estimation of body fat by different methods for age 12.7 year, systematically, dividing the methods in multicompartment models, isotope and DXA models, density models, anthropometric models and BIA models [2,3,5]. B-A approach was used to compare and prediction equation they derived in their previous study, was used as a reference method. They concluded that several methods, including DXA, density, total body water and skinfold thickness methods may be appropriate i.e. some methods are better than others. The 4 compartment models are most reliable. Among single methods, the isotope dilution, DXA, Pennington skinfold thickess, and Pennington density methods are slightly less reliable. BIA models and anthropometric models appeared less accurate [5].
In another study conducted by Salamat MR et al., on 143 adults coming for DEXA scan for bone mineral density, anthropometric measurements were done and by multiple regression analysis, derived equation using BMI, WC, gender, and age regressed over actual measurements. They suggested that combination of anthropometric parameters should be used than single index, to predict the fat mass, lean mass and truncal fat in adults [19].
Chambers AJ et al., compared predictive capabilities of skinfold regression equations currently available, for older adults and obese Americans. They compare BF% predicted by skinfold equations to that determined by DXA. Durnin and Womersly and Jackson and Pollock had reasonably good agreement with DXA. Gause-Nilsson, Jackson and Pollock significantly underestimating BF%, while Visser and Kwok overestimated BF%. They concluded that, numerous factors of a population including age, race, ethnicity, gender and obesity affects skinfold regression equation to estimate BF% [20].
Both BIA and prediction equation derived from SFT are not accurate methods of measurement of BF% as they are predictive methods [2,5]. For screening the population we need to choose the best possible fit for present ethnic group. The BIA gives complete body fat estimations while prediction equations derived from skinfolds assumes a relationship between subcutaneous fat and total body fat, so we considered BIA method as a reference method and other two as categorical methods for comparison. We considered mean of two methods as a best estimate and plotted it against the difference between the measurements by two methods [21]. Bland Altman plots are shown in [Table/Fig-3a,3b,3c] for boys and [Table/Fig-4a,4b,4c] for girls.
Bioelectric Impedance Analysis
On evaluating the agreement between BIA and Shaikh’s equation by B-A plots in case of boys, it was observed that Shaikh’s equation slightly under predicts BF% than BIA equation with a mean bias of 4.59 the LOA was 16.69 and -7.49. In girls, Shaikh’s equation over predicts with mean bias of -3.09 and LOA (12.02, -18.21) showed a narrow range. Kehoe SH et al., found similar observations: that body fat percent predicted by Shaikh’s equation, in their study ranged in a linear fashion from underestimation to overestimation [2].
Present Prediction Equation
When the BF% estimated by BIA was compared with present equation derived from data on skinfold thickness, showed least bias of 0.019 in case of boys with LOA (14.79,-14.75) in a narrow range, which suggests that present prediction equation and BIA measures similar BF% with practically negligible difference in case of boys. However, it was over predicted in case of girls with a bias of -13.23 and LOA (18.87, -45.35) showed wider range. Bray GA et al., compared BF% estimated by two BIA models with criterion model, which they described as BF% in kg divided by current weight [5]. They found both the BIA models over estimated BF% than criterion model. The over prediction observed in present study with a wide range of LOA may be because present study subjects included girls of pubertal age. Hormonal changes during puberty affects the body water, electrolyte and fat compositions specially in girls [22,23].
Shaikh’s Equation
From observations in B-A plots, when compared with the Shaikh’ equation, present prediction equation overestimates BF% with the mean bias of -4.58 and LOA (5.95, -15.11) in narrow range in case of boys. It under predicts BF% in case of girls with the bias of -10.14. The limit of agreement is wider (15.80, -36.08). This difference may be because the children included in the study by Shaikh’s were in the age group of 1-5 years while in present study, children were in the age group of 8-16 years. So, this may not be suitable for present geographic region though it was recommended by author for south asian children.
Intra-class correlation coefficient Cronbach’s alpha showed better agreement (80%) between BIA and Shaikh’s method and Shaikh’s and present (78%). It showed medium agreement (68%) between BIA and present, in case of boys. In case of girls only BIA and Shaikh’s equation showed medium agreement (63%) while other two methods showed poor agreement [Table/Fig-2].
Limitation
The tendency of south asians for central deposition of fat makes it mandatory to include waist circumference in such prediction equations, along with skinfold thickness. The major limitation was that we neither considered the influence of puberty on study population nor we cross validated with any of the standard methods of measurement of BF% such as D2O method or DEXA. Thus, we recommend that prediction equation derived should be regional, age, gender and Tanner stage specific and it should be cross validated with standard technique of BF% estimation.
Conclusion
To predict BF% in boys, of age 8-16 years in central India, BIA and Shaikh’s prediction equation may provide moderately good estimates, but prediction equation, derived from skinfold thickness and midarm circumference, is seen to provide excellent estimates, closer to those by the reference method BIA. It could possibly be helpful for rapid and accurate prediction of BF% in nutritional surveys and risk assessment programmes as a primary screening tool. In case of girls, BIA and Shaikh’s equation may provide less accurate estimates of BF%. However present prediction equation for girls of 8-16 years, which encompasses complete pubertal age group, a single equation was inadequate in giving fair estimates of BF%.
BM: Body mass index; WC: Waist circumference; SFT: Skinfold thickness; MAC: Mid arm circumference; Avg: Average
[1]. Cole TJ, Bellizzi MC, Flegal KM, Dietz William H, Establishing a standard definition for child overweight and obesity worldwide: international surveyBMJ 2000 320:124010.1136/bmj.320.7244.124010797032 [Google Scholar] [CrossRef] [PubMed]
[2]. Kehoe SH, Krishnaveni GV, Lubree HG, Wills AK, Guntupalli AM, Veena SR, Prediction of body fat percentage from skinfold and bio-impedance measurements in Indian School ChildrenEur J Clin Nutr 2011 65:1263-70.10.1038/ejcn.2011.11921731039 [Google Scholar] [CrossRef] [PubMed]
[3]. Brook CG, Determination of body composition of children from skinfold measurementsArch Dis Child 1971 46(246):182-84.10.1136/adc.46.246.1825576028 [Google Scholar] [CrossRef] [PubMed]
[4]. Johnston JL, Leong MS, Checkland EG, Zuberbuhler PC, Conger PR, Quinney HA, Body fat assessed from body density and estimated from skinfold thickness in normal children and children with cystic fibrosisAm J Clin Nutr 1988 48(6):1362-66.10.1093/ajcn/48.6.13623202085 [Google Scholar] [CrossRef] [PubMed]
[5]. Bray GA, DeLany JP, Volaufova J, Harsha DW, Champagne W, Prediction of body fat in 12-y-old African American and white children: evaluation of methodsAm J Clin Nutr 2002 76(5):980-90.10.1093/ajcn/76.5.98012399269 [Google Scholar] [CrossRef] [PubMed]
[6]. Deurenberg P, Pieters JJ, Hautvast JG, The assessment of the body fat percentage by skinfold thickness measurements in childhood and young adolescenceBr J Nutr 1990 63(2):293-303.10.1079/BJN199001162334665 [Google Scholar] [CrossRef] [PubMed]
[7]. Reilly JJ, Wilson J, Durnin JV, Determination of body composition from skinfold thickness: a validation studyArch Dis Child 1995 73(4):305-10.10.1136/adc.73.4.3057492193 [Google Scholar] [CrossRef] [PubMed]
[8]. Wells JC, Fuller NJ, Dewit O, Fewtrell MS, Elia M, Cole TJ, Four-component model of body composition in children: density and hydration of fat-free mass and comparison with simpler modelsAm J Clin Nutr 1999 69(5):904-12.10.1093/ajcn/69.5.90410232629 [Google Scholar] [CrossRef] [PubMed]
[9]. Misra A, Khurana L, Vikram NK, Goel A, Wasir JS, Metabolic syndrome in children: current issues and South Asian perspectiveNutrition 2007 23(11-12):895-910.10.1016/j.nut.2007.08.01817936199 [Google Scholar] [CrossRef] [PubMed]
[10]. Bhat DS, Yajnik CS, Sayyad MG, Raut KN, Lubree HG, Rege SS, Body fat measurement in Indian men: comparison of three methods based on a two compartment modelInt J Obes (Lond) 2005 29(7):842-48.10.1038/sj.ijo.080295315824749 [Google Scholar] [CrossRef] [PubMed]
[11]. Goel K, Gupta N, Misra P, Poddar A, Pandey RM, Vikram NK, Predictive equations for body fat and abdominal fat with DXA and MRI as reference in Asian IndiansObesity (Silver. Spring) 2008 16(2):451-56.10.1038/oby.2007.5518239658 [Google Scholar] [CrossRef] [PubMed]
[12]. Shaikh S, Mahalanabis D, Empirically derived new equations for calculating body fat percentage based on skinfold thickness and midarm circumference in preschool Indian childrenAm J Hum Biol 2004 16(3):278-88.10.1002/ajhb.2003015101053 [Google Scholar] [CrossRef] [PubMed]
[13]. Khadgawat R, Marwaha RK, Tandon N, Upadhyay AD, Sastry A, Percentage Body Fat in Apparently Healthy School Children From Northern IndiaIndian Pediatr 2013 50(9):859-66.10.1007/s13312-013-0237-323502670 [Google Scholar] [CrossRef] [PubMed]
[14]. Veena SR, Hegde BG, Ramachandraiah S, Krishnaveni GV, Fall CH, Srinivasan K, Relationship between adiposity and cognitive performance in 9-10 year old children in south IndiaArch Dis Child 2014 99(2):126-34.10.1136/archdischild-2013-30447824146284 [Google Scholar] [CrossRef] [PubMed]
[15]. Bland JM, Altman DG, Statistical methods for assessing agreement between two methods of clinical measurementsLancet 1986 1(8476):307-10.10.1016/S0140-6736(86)90837-8 [Google Scholar] [CrossRef]
[16]. Dezenberg CV, Nagy TR, Gower BA, Johnson R, Goran MI, Predicting body composition from anthropometry in pre-adolescent childrenInt J Obes Relat Metab Disord 1999 23(3):253-59.10.1038/sj.ijo.080080210193870 [Google Scholar] [CrossRef] [PubMed]
[17]. Slaughter MH, Lohman TG, Boileau RA, Horswill CA, Stillman RJ, Van Loan MD, Skinfold equations for estimation of body fatness in children and youthHum Biol. 1988 60(5):709-23. [Google Scholar]
[18]. Wickramasinghe VP, Lamabadusuriya SP, Cleghorn GJ, Davies PS, Assessment of body composition in Sri Lankan children: validation of a skin fold thickness equationCeylon Med J 2008 53(3):83-88.10.4038/cmj.v53i3.24718982800 [Google Scholar] [CrossRef] [PubMed]
[19]. Salamat MR, Shanei A, Salamat AH, Khoshhali M, Asgari M, Anthropometric predictive equations for estimating body compositionAdv Biomed Res 2015 4:3410.4103/2277-9175.15042925709999 [Google Scholar] [CrossRef] [PubMed]
[20]. Chambers AJ, Parise E, McCrory JL, Cham RA, Comparison of prediction equations for the estimation of body fat percentage in non-obese and obese older caucasian adults in the United StatesJ Nutr Health Aging 2014 18(6):586-90.10.1007/s12603-014-0017-324950148 [Google Scholar] [CrossRef] [PubMed]
[21]. Giavarina D, Understanding bland altman analysisBiochem Med (zagreb) 2015 25(2):141-51.10.11613/BM.2015.01526110027 [Google Scholar] [CrossRef] [PubMed]
[22]. Kaplowitz PB, Link between body fat and the timing of pubertyPediatrics 2008 121(3):S08-217.10.1542/peds.2007-1813F18245513 [Google Scholar] [CrossRef] [PubMed]
[23]. Siervogel RM, Demerath EW, Schubert C, Remsberg KE, Chumlea WC, Sun S, Puberty and body compositionHorm Res 2003 60(Suppl 1):36-45.10.1159/00007122412955016 [Google Scholar] [CrossRef] [PubMed]