Introduction
A relatively specific quantitative Electroencephalogram (qEEG) signature is shown to be indicative of working memory deficits in low performing high school students. Previous studies have shown that Theta/Beta (T/B) ratio measured by qEEG is an indicator of poor Attention Control (AC) and that high T/B ratio may be diagnostic of attention deficit disorders.
Aim
This study tests the hypothesis that high T/B ratio measured by qEEG may be associated with low academic performance in a medical school curriculum.
Materials and Methods
Nine healthy male volunteers were subjected to 5-10 minutes of qEEG measurements at 19 electrode sites, under Eyes-Open (EO) and Eyes-Closed (EC) conditions. The qEEG measurements were performed for three days before each of the first two block examinations, covering standard first semester integrated basic science courses. Mean±Standard Deviations (SD) of the amplitudes, expressed in μV, and of the mode frequency in each of four standard bandwidths (delta, theta, alpha, beta), expressed in hertz, were measured. T/B ratio was then computed.
Results
Mean theta and beta amplitudes increased significantly and T/B ratio decreased significantly for both the EO and EC conditions. Dominant (mode) theta frequency also increased. Overall inter and intra-hemispheric theta and beta band coherences increased for both the EO and EC conditions between the Block 1 and Block 2 exams; theta intra-hemispheric coherence was significant only for the EC condition. Correlations between Human Structure and Function (HSF) Block 2 exam scores and overall inter and intra-hemispheric coherences were significant for the beta bandwidth under the EC condition only.
Conclusion
These findings suggest that high T/B ratio, a qEEG indicator of AC, may be associated with low academic performance. Future studies including a larger number of subjects should be done to determine whether these findings are gender-specific and whether lowering the T/B ratio is a predictor of medical school performance and other academic challenges.
Introduction
Learning requires individuals in a society to interact with objects in their environment and with other individuals. Depression and anxiety are reported to be good predictors for academic underachievement [1], probably because they are markers for the ability of individuals to interact effectively with their society. Another school of thought is that overall health and wellness is correlated with academic performance [2]. Academic underachievement has been largely viewed as a function of low intelligence, motivation and/or socioeconomic status [3,4]. However, this viewpoint does not account for the large number of highly intelligent, motivated and affluent individuals who exhibit academic underachievement. Individuals categorised by Myers-Briggs Personality Type as introverted personalities outperformed Myers-Briggs Type extroverted personalities in a first year Australian university chemistry course [5]. Individuals with reflective personalities and visual learning style exhibited the best academic performance in an ophthalmology course for fifth year students in a Chilean Medical School [6]. It has been long hypothesised that inter-individual differences in learning style preference (e.g., auditory vs. visual learning) may account for academic underachievement. However, learning style preference is difficult to quantify and most curricula require an individual to successfully employ varied learning styles. Indeed, research on optimising academic performance has suffered from an inability to translate what is known about an individual’s learning style preference to how effectively he/she is able to use the critical nodes and hubs in his/her cerebral cortex for learning.
This impediment to studying academic performance has been effectively overcome by the advent of computer-based technologies for measuring electrical and metabolic functions of the cerebral cortex (e.g., qEEG, functional MRI) and for psychometric testing. Whereas, functional MRI (fMRI) provides information about the metabolic activity of the brain, qEEG is primarily a measure of electrical activity. Because of the tight coupling between metabolic and electrical signaling in the brain [7], each can be viewed as a surrogate for the other. In that context, an inexpensive qEEG recording may be useful as a surrogate for an expensive fMRI recording [8,9]. In recent years, qEEG has been approved by the US FDA as a diagnostic and, through neurofeedback training, a treatment tool for identifying children diagnosed with Attention Deficit Disorder (ADD) and Attention Deficit Hyperactivity Disorder (ADHD) syndromes [10]. In conventional EEG, a trained observer, usually a physician, visually detects and reports abnormal waveforms such as spikes for the purpose of diagnosing epilepsy or uncharacteristic frequencies. Such frequencies are usually slow waves for identifying brain areas affected by lesions such as those created by tumours, ischaemia, infarct or stroke. The qEEG differs from conventional EEG primarily by the data analysis. Because it is a time series, the analogue data is decomposed to a Fast Fourier Transform (FFT), expressed in individual frequency bands, as a power spectrum. The FFT data for each electrode are expressed in voltage amplitude or power and dominant frequency for each of the four standard EEG frequency bands: delta (2-4 Hz), theta (4-7 Hz), alpha (8-12 Hz) and beta (13-30 Hz). The qEEG is shown to be useful for selecting those children and adults who are likely to be responsive to treatment with neurostimulants [11-13]. The qEEG is also becoming more widely used for neurofeedback training in both athletics and academics. The qEEG profiles were indicative of improved athletic performance in major league baseball players, and in olympic athletes with performance deficits following injuries [14]. The qEEG based neurofeedback training is also shown to be effective in improving neurosurgical skills in ophthalmic microsurgeons [15]. A relatively specific qEEG signature is shown to be indicative of working memory deficits in low-performing high school students, compared to their high-performing counterparts [16]. Specific qEEG changes, indicative of increased brain efficiency, may also result from several practices of yoga [17,18], suggesting a potential of yoga training to generate improvements in academic performance.
Previous studies have shown that quantitative qEEG T/B ratio is an indicator of poor AC and that high T/B ratio may be diagnostic of ADD [19]. Since the 1970s, there has been increasingly more research concerning the link between EEG abnormalities and individuals with ADHD [20]. A meta-analysis reported that the increase in the T/B power ratio is likely the most reliable EEG finding in ADHD to date [21]. Besides the potential for clinical ADHD diagnosis, there is increased interest in the T/B ratio in healthy adults [22]. This pilot study was, therefore designed to test the hypothesis that high T/B ratio may be associated with low academic performance in a medical school curriculum.
Materials and Methods
This study was approved by the American University of Antigua College of Medicine Research Committee, Antigua and informed consent was obtained from the study participants (February 2017). Using the inputs from the study done by Moore CG et al., the final sample size for the present study was calculated to be 10 [23]. Therefore, 10 subjects were recruited for the study. One subject discontinued the study due to his ill health. Female participants were not included in this study owing to the difficulty in carrying out the procedure on them and to avoid confounding due to hormonal changes.
The nine volunteers were subjected to 5-10 minutes of qEEG measurements at 19 standard electrode sites, under EO and EC conditions [11-19]. The qEEG measurements were performed using the Brain Master Discovery System (Brain Master Technologies, Inc., Bedford, OH, USA), three days before each of the first two summative block examinations covering standard first-semester integrated basic science courses. The qEEG measurements were performed with subjects seated comfortably in a darkened room, while gazing at a blank wall during the EO and EC conditions. Mean±SD of the amplitudes, expressed in μV, and of the mode frequency in each bandwidth, expressed in Hz were measured for the following standard qEEG frequencies: delta (2-4 Hz), theta (4-7 Hz), alpha (8-12 Hz) and beta (13-30 Hz) after manual editing using the New Mind Maps online editing tool (New Mind Technologies, Roswell, GA, USA). T/B ratio was computed.
Results
Statistical significance of differences between the two block examinations was determined using the 2013 Microsoft Excel statistical software package. Statistical significance was guaranteed by Student’s t-test, at p<0.05. Significance of correlations was determined by Pearson product-moment correlation coefficient (r), at p<0.05.
Results
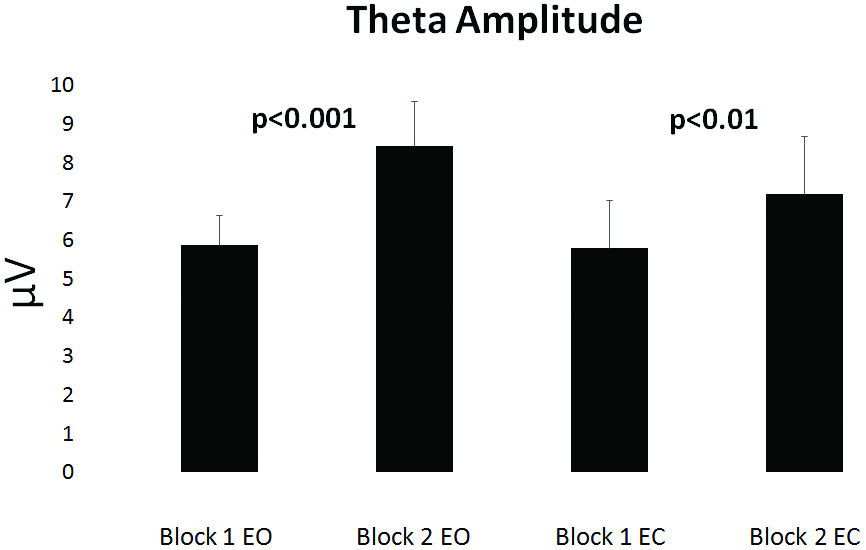
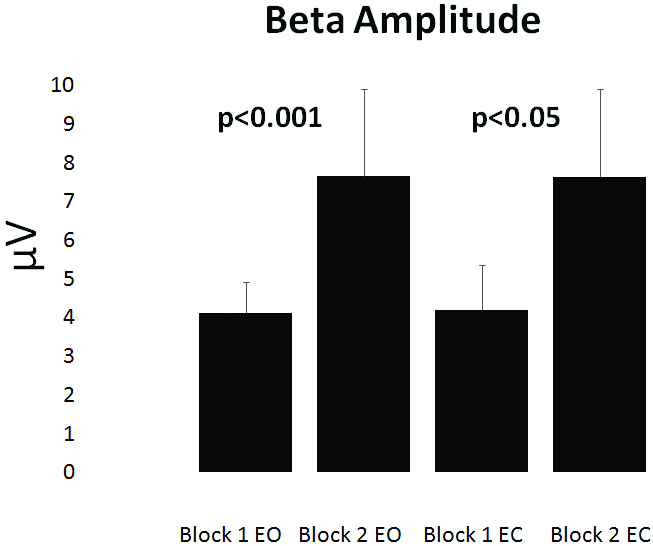
[Table/Fig-1,2] show that the mean theta and beta amplitudes increased significantly between the two block examinations. EO theta increased from 5.9±1.2 μV to 8.6±1.2 μV and EO beta from 4.1±1.7 μV to 7.8±2.1 μV (p<0.001). EC theta increased from 5.8±1.1 μV to 7.3±1.4 μV (p<0.01). EC beta increased from 4.2±1.1 μV to 7.7±2.1 μV (p<0.05).
Theta amplitude. Bars represent mean±standard deviation of quantitative electroencephalographically measured 4-7 Hz brain waves, expressed in μV, before and after their first two basic science block examinations (Block 1, Block 2).
Beta amplitude. Bars represent mean±standard deviation of quantitative electroencephalographically-measured 13-30 Hz brain waves, expressed in μV, before and after their first two basic science block examinations (Block 1, Block 2).
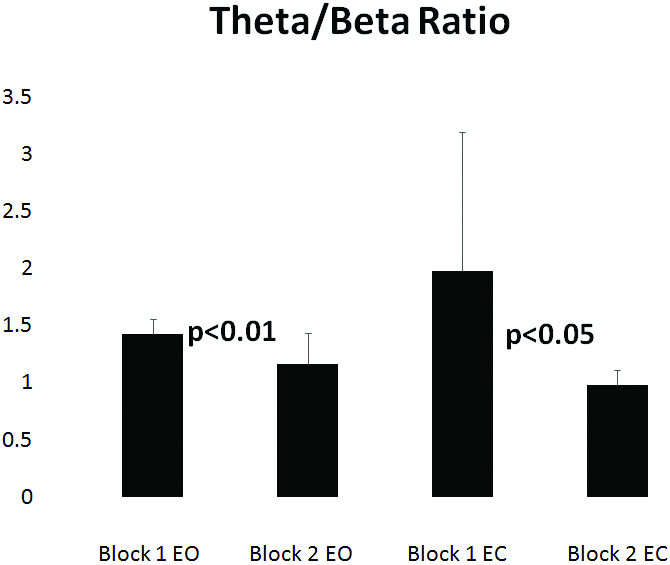
[Table/Fig-3] demonstrates that T/B ratio decreased significantly for both the EO and EC conditions, from 1.4±0.1 to 1.2±0.2 (p<0.01) and from 2.0±1.2 to 1.0±0.1 (p<0.05), respectively.
Theta/beta ratio. Bars represent the ratio of quantitative electroencephalographically-measured theta (4-7 Hz) and beta (13-30 Hz) brain waves, before and after their first two basic science block examinations (Block 1, Block 2).
Standard deviation of the theta, alpha and beta amplitudes increased significantly, but only for the EO condition. SD of the theta amplitude increased from 3.0±0.8 μV to 4.0±0.4 μV (p<0.001). SD of the alpha amplitude increased from 5.8±2.2 μV to 8.6±2.4 μV and SD of the beta amplitude increased from 1.8±0.4 μV to 3.3±0.8 μV (p<0.01). Dominant (mode) theta frequency also increased from 4.8±0.3 Hz to 5.2±0.4 Hz (p<0.05).
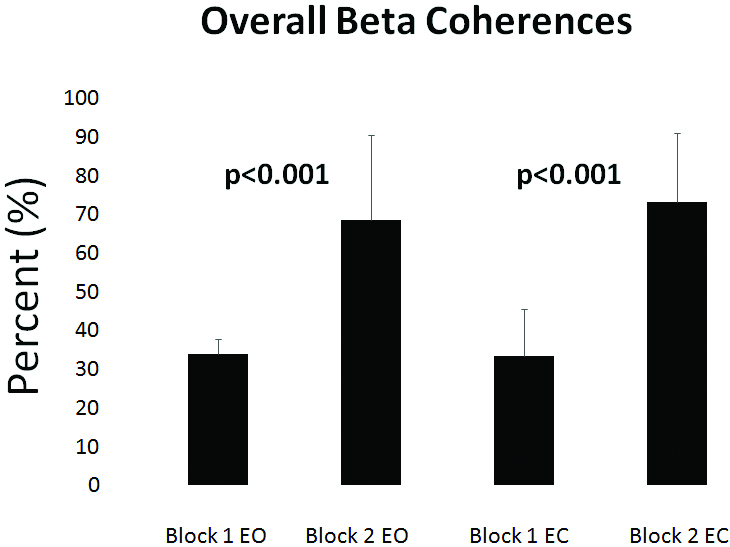
[Table/Fig-4] shows that overall inter and intra-hemispheric theta and beta coherences increased for both the EO and EC conditions between the Block 1 and Block 2 exams (p<0.001). The increase in theta intra-hemispheric coherence was significant only for the EC condition. An increase in alpha intra-hemispheric coherence was observed, and was significant only for the EO condition (p<0.05).
Beta coherences. Bars represent mean±standard deviation of quantitative electroencephalographically-measured beta bandwidth (13-30 Hz) brain wave inter-hemispheric and intra-hemispheric (overall) coherences, expressed in percent (%), before and after their first two basic science block examinations (Block 1, Block 2).
The correlations between HSF Block 2 exam scores and overall intra and inter-hemispheric coherences were found to be significant for the beta bandwidth under the EC condition only (r=0.69, p<0.05). The Block 1 and Block 2 EO and EC T/B ratio values were computed electronically and those computed manually were correlated (Block 1: r=0.70, p<0.05; Block 2: r=0.97, p<0.001).
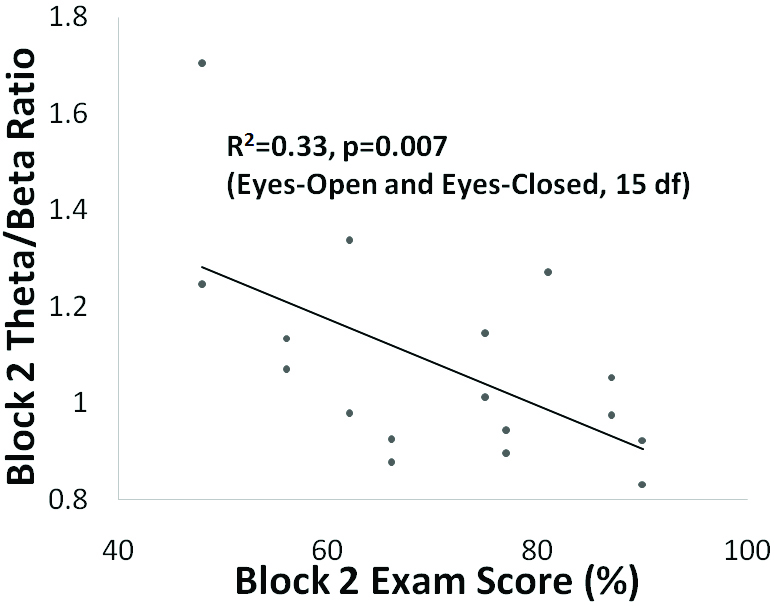
[Table/Fig-5] shows that the Block 2 T/B ratios and the Block 2 HSF examination scores were also correlated across both the EO and the EC conditions (r=-0.58, p=0.007). This is one of the more interesting findings of this study. This finding indicates that the subjects scoring highest on the exam, a measure of academic achievement, tends to have the lowest T/B ratio, and vice versa. This finding also seems to support our working hypothesis that lower academic achievement may be related to lower AC indicated, in this study, by higher T/B ratio.
Correlation between exam scores and theta/beta ratio. Linear logistical regression analysis of second block examination scores and their ratios of quantitative electroencephalographically measured theta (4-7 Hz) and beta (13-30 Hz) brain waves.
Discussion
The main drawback of conventional EEG is its inherent subjectivity, an impediment to using EEG as a research tool. The advent of qEEG technology has overcome this impediment by providing precise measurements of voltage and dominant frequency within each of the standard EEG frequency bands of interest; delta, theta, alpha and beta. Evidence is emerging that T/B ratio might also provide an objective marker for prefrontal mediated executive cognitive control; specifically, AC in healthy adults [22]. There appears to be a negative relationship between T/B ratio, expression of an AC trait and stress-induced AC decline, attentional orienting, emotional regulation, behavioural inhibition, and motivated decision-making in healthy adults [24]. These findings support the notion that anxious stress compromises cognitive executive performance, and indeed, previous research has suggested that the T/B ratio is related to trait AC, which might moderate the effects of stress on attentional function [25]. One study was even able to quantify the moderating influence of the T/B ratio on the effects of stress on AC. This study found that the T/B ratio explained 28% of the variance in stress-induced deterioration of self-reported AC and ultimately concluded that people with elevated T/B ratios showed stronger declines of subjectively experienced AC [25]. From a behavioural standpoint, in a study comparing 24 adults with ADHD to 24 normal controls, it was reported that a high T/B ratio was correlated with quick responses-to-choice stimuli, albeit with a high error rate. The correlation between high T/B ratio and difficulties in AC and cognitive performance seems to suggest that medical students with high T/B ratio would have poor academic performance. The next logical step is to determine whether T/B ratio in an adult medical student is relatively inflexible or if it can improve based on progressively more difficult cognitive challenges. Studies examining the effects of biofeedback training coupled with cognitive techniques suggest that a person’s brain can learn and adapt. Such training purports to increase a person’s ability to go into a state of relaxed but alert, calm problem-solving, with focus and concentration and without negative self-talk or circular thinking [26-28]. When a person achieves this mental state, there is a corresponding change in their EEG, including lowering of T/B ratio [26]. There are several reports of neurobiofeedback training improving AC in teenagers diagnosed with ADHD by improving T/B ratio [29].
Funding: This work is supported by a grant from the American University of Antigua College of Medicine Research Fund.
Limitation
The main conceptual limitation of this study was that an independent evaluation of AC was not included. Although, none of the study subjects qualified for an ADHD diagnosis based on their T/B ratio values, it will be of interest to see if in a similar, larger cohort the T/B ratio correlate with AC by psychometric testing. Based on the statistically significant findings of the present study, a future study with a larger number of subjects is likely to address the aforementioned conceptual limitation and to lessen the chances of a type 2 statistical error commonly found in small pilot studies.
Conclusion
These preliminary findings suggest that increases in theta and beta amplitudes, overall intra and inter-hemispheric theta, alpha and beta coherences and theta modal frequency may characterise the changes in the qEEG signatures of first-semester male medical students between periods of preparation for their first two block examinations. These results also seem to support the hypothesis that high theta/beta ratio, a qEEG indicator of AC, may be associated with low academic performance on block examination questions covering information presented in a first-semester integrated medical anatomy-physiology course. The results of this study should be interpreted carefully with the pending confirmation by a larger controlled trial. Future studies with a larger number of subjects may determine whether these findings are gender-specific and if lowering the T/B ratio is a predictor of medical school performance and of other academic challenges. Future studies should also determine genetic profiles and identify specific genetic haplotypes that are correlated with the T/B ratios or other qEEG signatures of academic performance.
[1]. Humensky J, Kuwabara SA, Fogel J, Wells C, Goodwin B, Van Voorhees BW, Adolescents with depressive symptoms and their challenges with learning in schoolJ Sch Nurs. 2010 26(5):377-92.10.1177/105984051037651520606058 [Google Scholar] [CrossRef] [PubMed]
[2]. Haight SJ, Chibnall JT, Schindler DL, Slavin SJ, Associations of medical student personality and health/wellness characteristics with their medical school performance across the curriculumAcad Med 2012 87(4):476-85.10.1097/ACM.0b013e318248e9d022361792 [Google Scholar] [CrossRef] [PubMed]
[3]. Kieffer J, Socioeconomic status, English proficiency, and late-emerging reading difficultiesEducational Researcher 2010 39(6):484-86.10.3102/0013189X10378400 [Google Scholar] [CrossRef]
[4]. Caro DH, Socio-economic status and academic achievement trajectories from childhood to adolescenceCanadian Journal of Education 2009 32(3):558-90. [Google Scholar]
[5]. Yeung A, Read J, Schmid S, Students’ learning style and academic performance in first year chemistryUniServe Science Blended Learning Symposium Proceedings 2005 :137-42. [Google Scholar]
[6]. Pellon M, Nome S, Aran A, Relationship between learning styles and academic performance in fifth graders enrolled in a medical courseRevista Brasileira de Oftalmologia 2013 72:181-84.10.1590/S0034-72802013000300008 [Google Scholar] [CrossRef]
[7]. Jolivet R, Coggan JS, Allaman I, Magistretti PJ, Multi-timescale modeling of activity-dependent metabolic coupling in the neuron-glia-vasculature ensemblePLoS Computational Biology 2015 11:e100403610.1371/journal.pcbi.100403625719367 [Google Scholar] [CrossRef] [PubMed]
[8]. Duyn JH, EEG-fMRI methods for the study of brain networks during sleepFrontiers in Neurology 2012 3:10010.3389/fneur.2012.0010022783221 [Google Scholar] [CrossRef] [PubMed]
[9]. Plichta M, Wolf I, Hohmann S, Baumeister S, Schwarz R, Pinkham AJ, Simultaneous EEG and fMRI reveals a causally connected subcortical-cortical network during reward anticipationJ Neurosci 2013 33(36):14526-33.10.1523/JNEUROSCI.0631-13.201324005303 [Google Scholar] [CrossRef] [PubMed]
[10]. FDA News Release July 15, 2013. Available from: https://wayback.archiveit.org/7993/20170112223021/http://www.fda.gov/NewsEvents/Newsroom/PressAnnouncements/ucm360811.htm [Google Scholar]
[11]. White JN, Hutchens TA, Lubar JF, Quantitative EEG assessment during neuropsychological task performance in adults with attention deficit hyperactivity disorderJournal of Adult Development 2005 12(2):113-21.10.1007/s10804-005-7027-7 [Google Scholar] [CrossRef]
[12]. Sangal RB, Sangal JM, Use of EEG beta-1 power and theta/beta ratio over Broca’s area to confirm diagnosis of attention deficit/hyperactivity disorder in childrenClin EEG Neurosci 2015 46(3):177-82.10.1177/155005941452728424973230 [Google Scholar] [CrossRef] [PubMed]
[13]. Snyder SM, Rugino TA, Hornig M, Stein MA, Integration of an EEG biomarker with a clinician’s ADHD evaluationBrain Behav 2015 5:e0033010.1002/brb3.33025798338 [Google Scholar] [CrossRef] [PubMed]
[14]. Graczyk M, Pachalska M, Ziółkowski A, Manko G, Łukaszewska B, Kochanowicz K, Neurofeedback training for peak performanceAnn Agri Environl Med 2014 21(4):871-75.10.5604/12321966.112995025528937 [Google Scholar] [CrossRef] [PubMed]
[15]. Ros T, Moseley MJ, Bloom PA, Benjamin L, Parkinson LA, Gruzelier JH, Optimizing microsurgical skills with EEG neurofeedbackBMC Neurosci 2009 10:8710.1186/1471-2202-10-8719630948 [Google Scholar] [CrossRef] [PubMed]
[16]. Aguirre-Pérez DM, Otero-Ojeda GA, Pliego-Rivero FB, Ferreira-Martínez AA, Relationship of working memory and EEG to academic performance: A study among high school studentsInt J Neurosci 2007 117(6):869-82.10.1080/0020745060091007717454248 [Google Scholar] [CrossRef] [PubMed]
[17]. Field T, Diego M, Hernandez-Reif M, Tai Chi/Yoga effects on anxiety, heart rate, EEG and math computationsComplement Ther Clinl Pract 2010 16(4):235-38.10.1016/j.ctcp.2010.05.01420920810 [Google Scholar] [CrossRef] [PubMed]
[18]. Trakroo M, Bhavanani AB, Pal GK, Udupa K, Krishnamurthy N, A comparative study of the effects of asan, pranayama and asan-pranayama training on neurological and neuromuscular functions of Pondicherry police traineesInt J Yoga 2013 6:96-103.10.4103/0973-6131.11339823930027 [Google Scholar] [CrossRef] [PubMed]
[19]. Putman P, Verkuil B, Arias-Garcia E, Pantazi I, van Schie C, EEG theta/beta ratio as a potential biomarker for attentional control and resilience against deleterious effects of stress on attentionCogn Affect Behav Neurosci 2014 14(2):782-91.10.3758/s13415-013-0238-724379166 [Google Scholar] [CrossRef] [PubMed]
[20]. Loo SK, Makeig S, Clinical utility of EEG in attention-deficit/hyperactivity disorder: a research updateNeurotherapeutics 2012 9(3):569-87.10.1007/s13311-012-0131-z22814935 [Google Scholar] [CrossRef] [PubMed]
[21]. Ogrim G, Kropotov J, Hestad K, The quantitative EEG theta/beta ratio in attention deficit/hyperactivity disorder and normal controls: sensitivity, specificity, and behavioral correlatesPsychiatry Res 2012 198(3):482-88.10.1016/j.psychres.2011.12.04122425468 [Google Scholar] [CrossRef] [PubMed]
[22]. Angelidis A, van der Does W, Schakel L, Putman P, Frontal EEG theta/beta ratio as an electrophysiological marker for attentional control and its test-retest reliabilityBiol Psychol 2016 121(Pt A):49-52.10.1016/j.biopsycho.2016.09.00827697551 [Google Scholar] [CrossRef] [PubMed]
[23]. Moore CG, Carter RE, Nietert PJ, Stewart PW, Recommendations for planning pilot studies in clinical and translational researchClin Transl Sci 2011 4(5):332-37.10.1111/j.1752-8062.2011.00347.x22029804 [Google Scholar] [CrossRef] [PubMed]
[24]. Putman P, van Peer J, Maimari I, van der Werff S, EEG theta/beta ratio in relation to fear-modulated response-inhibition, attentional control, and affective traitsBiol Psychol 2010 83(2):73-78.10.1016/j.biopsycho.2009.10.00819897008 [Google Scholar] [CrossRef] [PubMed]
[25]. Putman P, Verkuil B, Arias-Garcia E, Pantazi I, Schie C, EEG theta/beta ratio as a potential biomarker for attentional control and resilience against deleterious effects of stress on attentionCogn Affect Behav Neurosci 2014 14(2):782-91.10.3758/s13415-013-0238-724379166 [Google Scholar] [CrossRef] [PubMed]
[26]. Hosseini S, Pritchard-Berman M, Sosa N, Ceja A, Kesler S, Task-based neurofeedback training: A novel approach toward training executive functionsNeuroimage 2016 134:153-59.10.1016/j.neuroimage.2016.03.03527015711 [Google Scholar] [CrossRef] [PubMed]
[27]. Thompson M, Thompson L, Improving attention in adults and children: differing electroencephalography profiles and implications for trainingAssociation for Applied Psychophysiology & Biofeedbac 2006 34(3):99-105. [Google Scholar]
[28]. Vernon D, Egner T, Cooper N, Compton T, Neilands C, Sheri A, The effect of training distinct neurofeedback protocols on aspects of cognitive performanceInt J Psychophysiol 2003 47(1):75-85.10.1016/S0167-8760(02)00091-0 [Google Scholar] [CrossRef]
[29]. Marzbani H, Marateb HR, Mansourian M, Neurofeedback: a comprehensive review on system design, methodology and clinical applicationsBasic and Clinical Neuroscience 2016 7(2):143-58.10.15412/J.BCN.0307020827303609 [Google Scholar] [CrossRef] [PubMed]